D e si g n & l a y o u t: B & T O n tw e rp e n a d v ie s ( w w w. b -e n -t .n l) P ri n t: H a v e k a ( w w w.
Surveys are widely used by scholars, companies, and public policymakers to generate invaluable insights. Despite the popularity of surveys, several biases can affect the validity of self-reported data. In his inaugural address, Martijn de Jong discusses how new survey methods can help to extract valid information from surveys. Several examples are presented that showcase the relevance of better research design and careful statistical modeling of the response process. In addition, De Jong addresses some commonly held perceptions about the ability to make causal inferences with survey data.
Martijn de Jong is Full Professor of Marketing Research at the Erasmus School of Econo -mics. He obtained his PhD in marketing (cum laude)from Tilburg University in 2006, and an MSc in Econometrics (cum laude)from Erasmus University Rotterdam in 2002. He was a visiting scholar at Columbia University and NYU in 2008. Martijn received several major research grants, including an NWO (Netherlands Organization for Scientific Research) VENI and VIDI grant. His awards include the 2009 J. C. Ruigrok award, the 2010 Christiaan Huygens award, and the 2010 Erasmus Research prize. He was named a “Marketing Science Young Scholar” by the Marketing Science Institute (MSI) in 2009. His main research interests are consumer preference measurement, cross-cultural marketing, sensitive topics, psychometrics and privacy issues. His articles have been published in Marketing Science, Journal of Marketing Research, Journal of Consumer Research, Journal of Marketing, Quantitative Marketing & Economics, Journal of Personality and Social Psychology, Psychometrika, and Applied Psychological Measu re ment. Martijn serves on the editorial boards of the Journal of Marketing Research, Marketing Science, and the International Journal of Research in Marketing(associate editor).
The Erasmus Research Institute of Management (ERIM) is the Research School (Onder -zoek school) in the field of management of the Erasmus University Rotterdam. The founding participants of ERIM are the Rotterdam School of Management (RSM), and the Erasmus School of Econo mics (ESE). ERIM was founded in 1999 and is officially accre dited by the Royal Netherlands Academy of Arts and Sciences (KNAW). The research under taken by ERIM is focused on the management of the firm in its environment, its intra- and interfirm relations, and its busi ness processes in their interdependent connections.
The objective of ERIM is to carry out first rate research in manage ment, and to offer an ad vanced doctoral pro gramme in Research in Management. Within ERIM, over three hundred senior researchers and PhD candidates are active in the different research pro -grammes. From a variety of acade mic backgrounds and expertises, the ERIM commu nity is united in striving for excellence and working at the fore front of creating new business knowledge.
Inaugural Addresses Research in Management contain written texts of inaugural addresses by members of ERIM. The addresses are available in two ways, as printed hardcopy booklet and as digital fulltext file through the ERIM Electronic Series Portal.
E
ra
s
m
u
s
R
e
s
e
a
rc
h
I
n
s
ti
tu
te
o
f
M
a
n
a
g
e
m
e
n
t
-Inaugural Address Series
Research in Management
Erasmus Research Institute of Management
-New Survey Methods:
Tools to Dig for Gold
Martijn de Jong
ISBN 978-90-5892-338-7
Erasmus Research Institute of Management - Rotterdam School of Management (RSM) Erasmus School of Economics (ESE) Erasmus University Rotterdam (EUR) P.O. Box 1738, 3000 DR Rotterdam, The Netherlands
Tel. +31 10 408 11 82 Fax +31 10 408 96 40 E-mail [email protected] Internet www.erim.eur.nl
New Survey Methods:
Tools to Dig for Gold
Bibliographical Data and Classifications
Library of Congress Classification HF5415.2, HM538, HB137 (LCC)
http://lcweb.loc.gov/catdir/cpso/lcco/lcco_h.pdf
Journal of Economic Literature (JEL) C19, C42, D71, M3 http://www.aeaweb.org/journal/jel_class_system.html
Gemeenschappelijke Onderwerpsontsluiting (GOO)
Classification GOO 85.40, 70.03
Keywords GOO marketing enquetes,
interpretative van onderzoek; onderzoeksontwerp, statistische modellen
Free keywords surveys,
item response theory, scale usage, response styles, cross-cultural, sensitive questions, social desirability, causality, common method bias, common method variance
Erasmus Research Institute of Management - ERIM
The joint research institute of the Rotterdam School of Management (RSM) and the Erasmus School of Economics (ESE) at the Erasmus Universiteit Rotterdam Internet: www.erim.eur.nl
ERIM Electronic Series Portal:
http://hdl.handle.net/1765/1
Inaugural Addresses Research in Management Series
Reference number ERIM: EIA- 2013-053-MKT ISBN 978-90-5892-338-7
© 2013, Martijn de Jong
Design and layout: B&T Ontwerp en advies (www.b-en-t.nl)
Print: Haveka (www.haveka.nl)
This publication (cover and interior) is printed by haveka.nl on recycled paper, Revive®. The ink used is produced from renewable resources and alcohol free fountain solution. Certifications for the paper and the printing production process: Recycle, EU Flower, FSC, ISO14001. More info: http://www.haveka.nl/greening
All rights reserved. No part of this publication may be reproduced or transmitted in any form or by any means electronic or mechanical, including photocopying, recording, or by any information storage and retrieval system, without permission in writing from the author(s).
New Survey Methods:
Tools to Dig for Gold
Address delivered at the occasion of accepting the appointment of Professor of Marketing Research
at the Erasmus School of Economics, Erasmus University Rotterdam, on Friday May 31, 2013
dr. Martijn G. de Jong
Erasmus School of Economics Erasmus Universiteit Rotterdam Postbus 1738
3000 DR Rotterdam
M A R T IJ N D E J O N G N E W S U R V E Y M E T H O D S : T O O L S T O D IG F O R G O L D 4
Samenvatting
Enquêtes worden veel gebruikt door wetenschappers, bedrijven, en beleidsmakers om waardevolle inzichten te genereren. Ondanks de populari -teit van enquêtes kunnen respondenten antwoordneigingen vertonen die de valideit van zelfgerapporteerde gegevens negatief kunnen beïnvloeden. In zijn inaugurele rede bespreekt Martijn de Jong hoe via nieuwe enquêterings methoden valide informatie uit enquêtes kan worden geëxtraheerd. De rele -van tie -van een betere onderzoeksopzet en het zorgvuldig modelleren -van het responsproces wordt aangetoond aan de hand van enkele voorbeelden. Bovendien kaart De Jong enkele heersende ideeën aan over de mogelijkheid om causale verbanden af te leiden op basis van enquêtedata.
Abstract
Surveys are widely used by scholars, companies, and public policymakers to generate invaluable insights. Despite the popularity of surveys, there are several biases that can affect the validity of self-reported data. In his inaugural address, Martijn de Jong discusses how new survey methods can help to extract valid information from surveys. Several examples are presented that showcase the relevance of better research design and careful statistical modeling of the response process. In addition, De Jong addresses some commonly held perceptions about the ability to make causal inferences with survey data.
M A R T IJ N D E J O N G N E W S U R V E Y M E T H O D S : T O O L S T O D IG F O R G O L D 5
M A R T IJ N D E J O N G N E W S U R V E Y M E T H O D S : T O O L S T O D IG F O R G O L D 6
Content
Samenvatting 4 Abstract 5 Content 7 1. Introduction 9 2. Examples 133. Types of survey data 21
4. Looking ahead 25
Dankwoord 29
References 33
Erasmus Research Institute of Management - ERIM 39
M A R T IJ N D E J O N G N E W S U R V E Y M E T H O D S : T O O L S T O D IG F O R G O L D 7
M A R T IJ N D E J O N G N E W S U R V E Y M E T H O D S : T O O L S T O D IG F O R G O L D 8
1. Introduction
Dear Rector Magnificus, dear colleagues, dear friends and family, dear distinguished guests.
Surveys are ubiquitous. Universities ask students to fill out surveys in order to evaluate courses, and ask employees to indicate their job satisfaction. Companies administer surveys to measure brand awareness, attitudes, associations, and purchase intentions. Public policymakers regularly conduct surveys to measure a host of attitudes, behaviors and societal trends. Scholars use surveys to measure preferences and to test theories. In sum, all these actors mine survey data to generate new insights that could improve decision making.
Despite the popularity of surveys and the powerful insights they can generate, some scholars are skeptical about survey data. Such a militant mindset seems especially pervasive among economists. Here is a quote by Manski some thirteen years ago (Manski 2000, p. 131): “They are taught early in their careers to believe only what people do, not what they say. Economists often assert that respondents to surveys have no incentive to answer questions about their preferences or expectations carefully or honestly; hence, there is no reason to believe that subjective responses reliably reflect respondents’ thinking. As a result, the profession has enforced something of a prohibition on the collection of subjective data.”
Interestingly, Manski himself investigated the scientific basis underlying the beliefs of economists and did not find much support. His own conclusion, therefore, was that these opinions are unfounded, and that survey respondents are able to provide coherent and useful information. Several influential economists have also shown how valuable survey data can be. For instance, the Dutch economist Bernard van Praag was one of the first to use stated preferences to determine the individual welfare function of income (Van Praag 1971). This led to new insights about income evaluation that could not possibly be generated from revealed choice data. Later generations of Dutch economists such as Arie Kapteyn and Arthur van Soest followed in his footsteps and developed new and advanced stated preference methods, published in top economics journals such as the American Economic Review(Kapteyn, Smith and van Soest 2007). And I must mention Emeritus Professor Geert Hofstede, one of
M A R T IJ N D E J O N G N E W S U R V E Y M E T H O D S : T O O L S T O D IG F O R G O L D 9
the most highly cited Dutch scholars1, who collected survey data in many
countries and derived his well-known cultural dimensions (Hofstede 1980, 2001).
In the field of marketing, surveys have also long been popular. For example, of the 636 empirical articles that appeared in the Journal of Marketingand Journal of Marketing Research between 1996 and 2005, nearly 30 percent employed surveys (Rindfleisch et al. 2008). One key reason for the popularity of surveys in marketing is that they allow scholars to measure important mindset metrics such as brand awareness, associations, satisfaction, brand equity, and purchase intentions. Such throughput metrics cannot be measured using revealed preference data, but they are extremely valuable. Through their marketing actions, companies often try to strengthen the competitive position of their brands in customers’ hearts and minds. A better position does not always immediately translate into more sales, but perceptual measures allow companies to gauge if the attitudinal needle is moving in the right direction. They can thus be used by managers as advance warning signals. Indeed, Srinivasan, Vanhuele, and Pauwels (2010) showed that including such subjectively measured mindset metrics into market response models improves the predictive ability of the market response models. Similarly, economists have found that surveys may help to identify structural parameters in demand models (Berry, Levinsohn, and Pakes 2004).
Despite the frequent use of surveys, there is some evidence that caution is required when analyzing survey data. One of the buzz words one frequently hears in academic circles is that survey data suffer from “common method bias”. This refers to various systematic biases that affect survey responses. Podsakoff, MacKenzie, and Podsakoff (2012) provide a review of such biases that can affect the validity of self-reported data. While I will not review all these biases here in the interest of time, many of them occur during one of the stages of the response process. The stages that respondents go through to answer a question are generally considered to be (Tourangeau, Rips and Rasinski 2000): item comprehension, retrieval of information from memory, judgment, and mapping of the judgment on the response scale. Obviously, if respondents don’t pay attention to the questions because they are tired or improperly incentivized, they won’t retrieve accurate information from memory about the topic at hand, and the response will be inaccurate. Let me give you another example. If respondents with similar judgments map these judgments onto a rating scale differently, comparability of answers is hampered. Unfortunately, most scholars
M A R T IJ N D E J O N G N E W S U R V E Y M E T H O D S : T O O L S T O D IG F O R G O L D 10
who rely on surveys for their inferences do not model any of these behavioral tendencies. I think this is where the discomfort of some economists comes from.
During the last few years, my co-authors and I have tried to develop proper incentives and questions, as well as advanced statistical models to enhance validity and to capture the response process as completely as possible. In other words, we have tried to build the psychology of survey response into econometric models by developing behaviorally rich models that provide explicit equations for response utility. In a way, the approach strongly resembles structural econometric work, where decision-makers or agents are represented by a set of primitives, such as a utility function and beliefs. In such structural econometric models, the goal is to uncover the form of the stochastic process that generated the choices, and to estimate the underlying primitives. Something similar can be attempted for the survey response.
The scaling methodology I use has a formal name: item response theory. This theory was originally developed in the 1950s and 1960s to deal with intelligence tests. Early models combined ideas from factor analysis with the phi-gamma law in psychology (McDonald 1999). Later the models were further developed to deal with attitude questions (Samejima 1969). A key strength of the framework is that the models feature both person-specific parameters, as well as item-specific parameters. Both types of parameters are necessary to capture the response process. Why? First, individuals differ in how they answer items. And here I am not referring to different opinions, but rather to factors such as the amount of time individuals spend on a survey, or their innate preferences for particular response options. For instance, some respondents find it very hard to say “no” to a question, while others have no difficulty doing so. Second, questions have certain characteristics as well. Questions can be long or short, ambiguous or clear, difficult or easy, their position in the survey can vary (e.g., at the start of a survey or at the end), and questions can be grouped by topic or randomly dispersed throughout the survey. By combining person and question charac -teristics, item response theory can shed light on how to ask questions in such a way that information is maximized (De Jong, Steenkamp and Veldkamp 2009), and on the underlying response process.
M A R T IJ N D E J O N G N E W S U R V E Y M E T H O D S : T O O L S T O D IG F O R G O L D 11
M A R T IJ N D E J O N G N E W S U R V E Y M E T H O D S : T O O L S T O D IG F O R G O L D 12
2. Examples
To showcase the benefits of the item response theory framework, I will give two examples from my own research. The first example is about cross-cultural comparisons. The second is about analyzing sensitive questions.
Example 1: cross-cultural comparisons
Let’s start with some background. Marketing researchers are increasingly keen on examining the validity of their measures and theories in other cultural contexts (Steenkamp 2005). This is due to several reasons. First, the large majority of the world’s consumers live outside of the U.S., where most marketing theories have been developed and tested. Second, the international market place is expanding rapidly as more of the world’s population enters the free market economy. A third major reason is technology. The Internet has enabled companies to sell directly to consumers across national boundaries at very low costs.
Some marketing practitioners experience firsthand that theories and models that were tested and calibrated in Western markets have little relevance elsewhere. Here is a quote from a manager working in China, whose job is to collect and analyze data on Chinese consumers (Schultz 2012): “Our existing loyalty models don’t work in China. All the algorithms we’ve developed over the past 20 or so years in Europe, Australia and North America don’t seem to have any relevance in China. We’re going to have to rethink all our models, metho -dologies, systems and approaches. We simply can’t apply Western models here.”
In the academic realm, several articles have shown that marketing theories often lack cross-cultural generalizability (Steenkamp 2005). As an example, consider the concept of market orientation. Market orientation is defined as “the organization-wide generation of market intelligence, dissemination of the intelligence across departments and organization-wide responsiveness to it” (Kohli and Jaworski 1990). Many studies have found that market orientation has a positive effect on performance (e.g., sales, market share, profitability), and therefore it is important to improve the level of market orientation in companies. Research in the West has shown that formalization and centralization have an adverse effect on market orientation. However, Burgess and Nyajeka (2007) conducted research among retailers in Zimbabwe, and found that centralization and formalization do not have significant effects on market orientation in that institutional context. M A R T IJ N D E J O N G N E W S U R V E Y M E T H O D S : T O O L S T O D IG F O R G O L D 13
Large scale comparative international research that tests the validity of marketing theories across many countries often relies on surveys. The reason is that data in emerging markets are frequently not available, and if available, they are typically unreliable. These conditions make collecting primary, self-report data a necessity. In other words, we ask people from different countries questions to obtain information. Questions about attitudes and opinions usually have a binary answer scale like “yes / no”, or a polytomous answer scale with answer labels ranging from “strongly disagree” to “strongly agree”. A key assumption when using such scale formats is that respondents from different countries use the response scale in the same way. However, there is some evidence that this assumption is not valid due to cross-cultural differences in the preferences for specific response options (Baumgartner and Steenkamp 2001). Consequently, differences in reported attitudes, perceptions or behaviors cannot be easily compared.
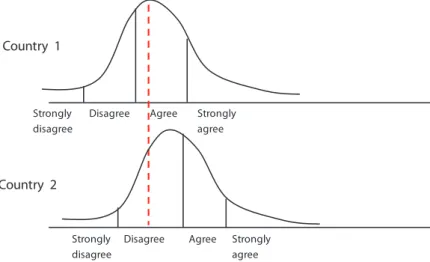
As an example, consider a large-scale comparative study on subjective well-being, with the goal to examine systematic and predictable differences in well-being across countries. Figure 1 presents the distribution of the item “I am very satisfied with my life” in two different countries.
Figure 1. Comparing self-reported life satisfaction across two countries
We can see that the mean of the distribution in country 1 is to the left of the mean in country 2. So, people in country 2 are, on average, more satisfied with their lives than people in country 1. However, the response scale is used very
M A R T IJ N D E J O N G N E W S U R V E Y M E T H O D S : T O O L S T O D IG F O R G O L D 14
differently. People in country 1 agree more easily with statements. In fact, people with the same life satisfaction (indicated by the dashed line) provide different ratings in country 1 and 2. Hence, a histogram of the reported life satisfaction scores may suggest that the mean is higher in country 1 than in country 2. Such a conclusion would be incorrect.
In order to make valid substantive cross-national comparisons, we cannot rely on some simple descriptive statistics. My co-authors and I use an approach that anchors on an individual’s answers to a dedicated set of items with low inter-item correlation. It allows us to assess an individual’s response style because using a dedicated set of items facilitates the separation of content and style. For instance, if a respondent agrees with some statements about some specific topic, we don’t know if agreement with the statements is because the respondent truly agrees, or because the respondent is a yeah-sayer, and uncritically agrees with pretty much all the questions that s/he may get, even if the questions are logical opposites. Similarly, if a respondent gives an extreme answer, we don’t know if the respondent feels strongly about the topic, or whether the respondent generally prefers the extremes of the rating scale. By using a larger and diffuse pool of items about all sorts of topics, we can thus separate stylistic variance from substantive variance.
I wrote a paper co-authored with Don Lehmann and Oded Netzer from Columbia University, which was published in Marketing Science (De Jong, Lehmann and Netzer 2012). In the paper, we developed a model that incorporates a variety of response tendencies. It includes individual and national differences in yeah-saying and extreme responding, but also individual differences in “state dependence”. State dependence is the tendency of respondents to stick with the response given to the previous item. It allows the respondent to reduce the cognitive effort invested in the response by simply selecting the same response given to the previous item.
Repeating the same answer is a problem because we normally assume that a respondent carefully processes each item. If this is not the case, item validity will suffer. The new model developed in the Marketing Science paper also accommodates that state dependence can become stronger at the end of the survey, when respondents are tired. Furthermore, several item characteristics may increase state dependence. For very long items, that is, items with many words, respondents are more likely to repeat their answer, because processing the long item is effortful.
M A R T IJ N D E J O N G N E W S U R V E Y M E T H O D S : T O O L S T O D IG F O R G O L D 15
We calibrated the model on survey data from six major countries. Our results show that there are statistically significant differences across countries in the response process, and that they can be included in a behaviorally rich statistical model. We also show that in the U.S., the predictive validity of survey items is better at the start of the survey than at the end. That is, if we measure consumers’ tendency to innovate using an existing measurement scale, this scale predicts actual new product purchases better if the scale is administered at the start of the survey than at the end. In Japan, however, respondents stay motivated throughout the course of even very long surveys. One of the messages is therefore that survey length may be different in various countries.
Example 2: sensitive questions
It is common in market research studies to ask questions about personal and sensitive issues. For example, interviews may be conducted on problem drinking, drugs use, smoking behavior, consumption of adult entertainment, fraud (e.g., tax and insurance fraud), gambling problems, debt, medical information (e.g., impotence, urinary incontinence, risky sexual behavior). All of these topics are incredibly relevant for public policymakers, and surveys can help us to get insight into these behaviors.
However, asking questions about such topics poses a formidable challenge to market researchers. For instance, NRC Handelsblad published an interview with Bart Becht, the former CEO of Reckitt Benckiser, two years ago. He was asked: “How do you ask people questions about a product like Durex?” His response was: “That’s a very interesting issue. If you ask people directly, they won’t tell you much. They prove to be unwilling to answer questions directly. We are looking at how we can do marketing research for such product categories.”
Obviously, Becht recognized that asking sensitive questions leads to response refusals or to deliberate under or overreporting. What are the theore -tical mechanisms that lead to under-reporting? First, people may experience shame and embarrassment when confronted with such questions, especially if the behavior is inconsistent with cultural norms. Second, there could be fear of reprisals if behavior is illegal. However, it is important to realize that over-reporting can occur as well. For instance, Catania et al. (1990) posit that in cultures with machismo values, sexual potency may be valued, so over-reporting could occur for sexual behavior. In any case, it is obvious that there are serious validity challenges when asking people questions about sensitive topics.
M A R T IJ N D E J O N G N E W S U R V E Y M E T H O D S : T O O L S T O D IG F O R G O L D 16
What kind of incentives and techniques should we use to prevent or correct possible biases? Some have suggested that it is sufficient to guarantee anony -mity to respondents. If responses are anonymous, it is believed that respondents have no incentive to lie about their behavior. Unfortunately, in my own research I have found that the approach does not work very well. Respondents still refuse to answer such direct questions or provide evasive answers. Furthermore, the increasing use of Web-surveys implies that respondents are part of panels and that answers of individuals across multiple surveys are linked. Participants know this, and so they might be especially reluctant to provide information that can be linked to a host of other variables.
Other researchers have used fake lie detectors, such as the bogus pipeline technique (Roese and Jamieson 1993). With this technique, participants are connected to a fake lie detector that can supposedly detect lies. Obviously, the approach is difficult to implement because respondents would have to come to some special lab. In addition, the technique clearly deceives participants, because the machine cannot actually detect lies. The codes of conduct of professional survey organizations prohibit deception of respondents.
In light of the limitations of such approaches, researchers frequently try to implement statistical corrections after data collection. However, if you collect extremely distorted data, it’s virtually impossible to recover the true behaviors and preferences of an individual. For example, if everybody in a sample denies engaging in a particular behavior, what can we really infer about specific individuals? Indeed, nothing. There is no information whatsoever that we can use to determine who was lying and who was speaking the truth. Hence, such approaches suffer from the “Garbage In, Garbage Out” principle.
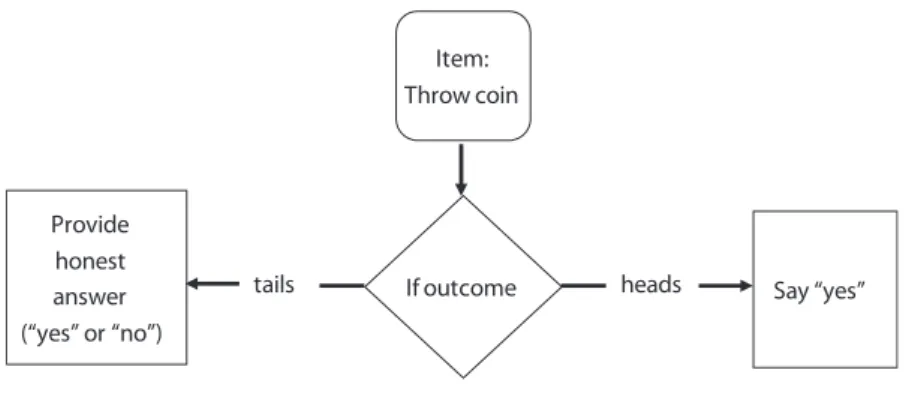
In my research with Rik Pieters and Jean Paul Fox that was published in the Journal of Marketing Research(De Jong, Pieters, and Fox 2010), we developed another approach that involves both an a priori change in the design of the survey, as well as a statistical technique that can be used to derive improved prevalence estimates. The method is called item randomized response, and the key idea is to protect respondents’ privacy at the question level through a randomization device like a coin or die. The simplest version uses a coin. A toss of the coin determines whether participants are requested to answer the question truthfully or whether they have to give a forced answer, such as “yes” (see Figure 2). M A R T IJ N D E J O N G N E W S U R V E Y M E T H O D S : T O O L S T O D IG F O R G O L D 17
Figure 2. Randomized response procedure
When throwing tails, the respondent has to give an honest answer. When throwing heads, the respondent has to say “yes”, independent of actual behavior. A respondent’s privacy is protected here, because the researcher does not observe the coin toss. A “yes” answer could be due to flipping heads, or because the respondent engaged in the behavior. Despite the privacy protection, it is possible to make aggregate level inferences about the proportion of respondents that engages in a specific behavior or holds a certain opinion, because we know the proportion of heads and tails in a sample. Thus, we can derive the true incidence in a sample. While this model provides aggregate, sample-level results, it does not allow for disaggregate (individual-level) results because the privacy of individuals is protected. This is a problem because policymakers such as companies and the government are often interested in understanding which individuals display certain undesirable or sensitive behaviors.
However, it is possible to ask each individual multiple questions about a sensitive topic. The advantage of such an approach is that we can exploit the correlation structure among the questions to still say something at the individual level. While privacy remains protected at the level of specific items, an individual reveals his behavioral tendencies across multiple questions. A psychometric model can be combined with the randomized response procedure to extract participants’ behavioral tendency that underlies the specific items.
In the paper, we applied a slightly more complicated version of the randomized response procedure to desires for adult entertainment. Even though the market for adult entertainment is huge, little is known about
M A R T IJ N D E J O N G N E W S U R V E Y M E T H O D S : T O O L S T O D IG F O R G O L D 18
individuals’ desires for commercial sex. The domain is also undertheorized because many researchers frown upon the domain (Cronin and Davenport 2001). As already echoed by Bart Becht, the adult product category elicits strong self-conscious emotions like embarrassment, shame, and guilt. Respondents tend not to reveal their sexual desires and activities, but are likely to answer in culturally accepted ways.
We interviewed 1260 members of the CentER Data panel of Tilburg University about their adult entertainment desires. The respondents participated voluntarily, and the panel was nationally representative for people over 16 years of age. Panel members were assigned to a condition of a two-group between-subjects experimental design. The control group answered questions directly (without any randomization mechanism), and the treatment group used a randomized response procedure when answering the questions, for which they received a die at home by regular mail, one week before participating in the survey. The questions covered a spectrum of desires, ranging from visiting paid erotic websites, to same-gender prostitution.
The data analysis generated several interesting insights. First, and not unexpected, males have a higher desire for adult entertainment than females. However, the gender gap narrows under randomized response questioning. In other words, women lie more about this topic, and while there is truly a difference in desires between men and women, the difference is less pronounced than we would infer from direct questions. Second, we found that the age group between 28 and 45 had the highest desires under direct questioning, higher than the desires of younger and older respondents. One explanation is that satiation lurks in longer stabilized marital and other intimate relationships, which leads respondents in this group to search for other, commercial ways to satiate their desires. Under randomized response, however, younger respondents have an equally strong adult entertainment desire. Hence, they seem more susceptible to normative pressures to under-report this under direct questioning.
M A R T IJ N D E J O N G N E W S U R V E Y M E T H O D S : T O O L S T O D IG F O R G O L D 19
M A R T IJ N D E J O N G N E W S U R V E Y M E T H O D S : T O O L S T O D IG F O R G O L D 20
3. Types of survey data
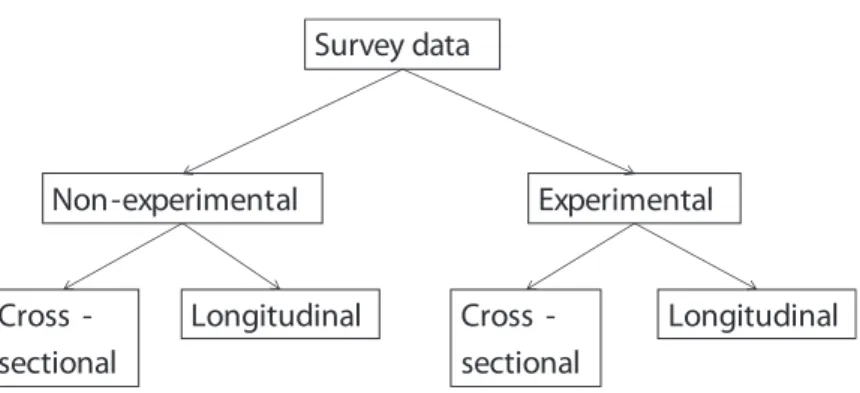
Now, I would like to briefly discuss different types of survey data that can be collected by researchers. The reason for doing so is that I would like to address and correct some perceptions about survey research that exist in the field. First, let me give you some definitions. The survey is a data collection method, and so survey-based data can be experimental or non-experimental (see Figure 3). Experimental survey data feature a treatment and a control group, and respondents are randomly assigned to groups. The random assignment ensures that we can estimate an average causal effect over a population of respondents (Holland 1986). Non-experimental data do not feature explicit randomization into treatment and control groups, which generally complicates identification of causal parameters. Independent of whether data are experimental or not, survey data could have a sectional or a longitudinal structure. A cross-sectional structure implies that multiple persons answer survey questions at one pointin time. A longitudinal structure implies that multiple persons are tracked over time, that is, they answer survey questions at multiple points in time.
Figure 3. Types of survey data
In marketing strategy, most scholars empirically test their conceptual models by collecting non-experimental cross-sectional survey data. The aim is to identify the causal effect of a variable X on a variable Y by linking observed variation in X (e.g., customer orientation) to variation in Y (e.g., salesperson performance), controlling for other variables. However, nowadays reviewers often complain that no causality can be shown using such cross-sectional data.
M A R T IJ N D E J O N G N E W S U R V E Y M E T H O D S : T O O L S T O D IG F O R G O L D 21
In fact, authors who rely on cross-sectional surveys are sometimes even chastised by reviewers for alluding to causality. However, as marketing scholars, we are often not merely interested in associations (Kohli 2011). Moreover, even longitudinal data do not always enhance the ability to make causal inferences, because temporal contiguity may be weakened and temporal erosion may occur (Rindfleisch et al. 2008).
It would help to distinguish between theoreticalcausality, and empirically identifyingcausal parameters. Let’s go back in history a bit to see why survey researchers make allusions to causality. In an Econometricapaper from the 1970s, Goldberger defines a structural equation as one representing a causal relationship, as opposed to a relationship that simply captures statistical associations (Goldberger 1972). The article’s conclusion contains a fascinating sentence: “economic, sociological, psychological, and political theory all have something to say about the causal links…” (p. 999). Note the emphasis on the role of theory, and not exclusively economic theory, in deciding whether a relationship should be considered causal or not. Survey researchers frequently use Structural Equation Modelingsoftware to analyze links between variables in their conceptual models, developed by the psychometrician Karl Jöreskog in the 1970s (Jöreskog and Van Thillo 1972). Back then, there was obviously little divergence among social scientists in their views of structural equations. The word “structural” simply suggests that the paths should theoretically be seen as causal, because the relationships are derived from a theory, or from informal reasoning (see Wooldridge 2010, p. 53).
Naturally, empirically identifyingcausal parameters from non-experimental data is non-trivial, and requires assumptions. Non-experimental “structural econometric” work, defined as work which combines economic theory with statistics (Reiss and Wolak 2007), also requires strong assumptions on the primitives to make causal inferences. Nonetheless, in the field of marketing, we rarely hear causality criticisms for structural econometric work. However, criticism has been voiced in the field of economics. For instance, Angrist and Pischke claim that structural econometric work often tends to pin a causal interpretation of the results on econometric methodology (Angrist and Pischke 2010). I would like to highlight that empirical identification of causal parameters does not depend on the use of self-reported data versus actual behavior, or on the use of economic theory versus other theories.
Some economists and marketing scholars have recently proposed a categoriza tion for empirical work (Reiss 2012). I refer to the distinction between
M A R T IJ N D E J O N G N E W S U R V E Y M E T H O D S : T O O L S T O D IG F O R G O L D 22
descriptive, structural, and experimental empirical research. Descriptive models can only show associations and cannot formally test theories, whereas structural econo metric models allow us to do more than summarizing the joint distribution of the data. By carefully parameterizing the way in which new policies affect the primitives, structural work enables counterfactual analysis to answer what-if policy questions.
Survey-based work could be either descriptive or structural. Unfortunately, I think that many scholars in our field would generally classify non-experimental survey papers as descriptive. However, we should realize that survey work can be structural if survey researchers use careful theoretical reasoning to develop fully specified nomological networks (i.e., all relevant variables and paths included) and measurement models (i.e., models to capture the response process)2. It is
also possible to do counterfactual analysis based on the implied system of simultaneous equations (see Pearl 2009, p. 120). But whatever the specified process, and whatever the nature of the data (self-reported or not), the causal interpretation of parameters in non-experimental studies depends on a priori restrictions.
Many researchers see experiments as optimal from a causality point of view. After all, cross-sectional randomization ensures that an average causal effect can always be estimated (Holland 1986). Randomized longitudinal data may also shed some light on heterogeneity of treatment effects (Chen et al. 2009). So should we only conduct experiments as some argue? Absolutely not. First, economics and marketing are not experimental sciences. It is often impossible to conduct an experiment. Indeed, by demanding strict evidence of causality based on randomized experiments, we unduly narrow the set of phenomena we can investigate. I am not alone in saying this. Other senior marketing scholars have also voiced their concerns that placing a premium on rigor of the design goes at the expense of focusing on important problems (Lehmann 2005; Reibstein, Day, and Wind 2009).
Second, some argue that even though true experiments are often infeasible, natural experiments and quasi experiments also enhance the credibility of empirical studies. In natural experiments, nature or factors outside the researcher’s control exogenously determine assignment to treatment and control conditions. In quasi experiments, assignment to the treatment condition is based on some other criterion than randomization (Campbell and Stanley 1963). While these approaches are sometimes feasible and very useful, they are also occasionally merely used as rhetorical devices to give a rigorous
2 Note that my definition of “structural work” refers to work in which theory, not merely economic theory, and statistical method are fused in the analysis of data.
M A R T IJ N D E J O N G N E W S U R V E Y M E T H O D S : T O O L S T O D IG F O R G O L D 23
flavor to the research, and to avoid having to estimate an advanced econometric model (Sims 2010).
Third, while it may appear as if experimental work is free of assumptions, experimental researchers do make many implicit assumptions (Keane 2010). Unfortunately, the interpretation of experimental inferences is ambiguous if the underlying mechanisms that drive a result are not specified. For instance, if treatment effects are heterogeneous in a population (Hutchinson, Kamakura, and Lynch 2000), instrumental variables – that is, variables correlated with the explanatory variable but not with the error term in a regression – cannot identify the causal effect for an entire population, and may even become invalid if a monotonicity assumption is not satisfied (Heckman and Vytlacil 2005). In sum, to guide marketing policy, implicit assumptions are not helpful.
Fourth, in practice, experimental researchers often have so many degrees of freedom that significant results can be generated even if a phenomenon does not exist (Simmons, Nelson, and Simonsohn 2011). It is primarily the flexibility in data collection, analysis, and reporting that can increase false-positive rates. Thus, in theory, the internal validity of experiments is high, but in practice, experiments can lack internal and external validity.
Personally, I believe nonexperimental and experimental work have compli -mentary roles in marketing. Each approach has its own strengths and weaknesses. It is my hope that editors, reviewers and authors keep an open mind to each other’s research, and do not become overly dogmatic. Experiments with college students are useful, and so are non-experimental cross-sectional and longitudinal survey studies that, in general, require more assumptions to establish causality. A key question reviewers should ask is whether it is realistic to conduct the study using another design. Furthermore, more emphasis should be on whether the results are in line with theoretical expectations. After all, “the strongest foundation for causal inferences is the degree to which results conform to theory” (Rindfleisch et al. 2008, p. 275).
M A R T IJ N D E J O N G N E W S U R V E Y M E T H O D S : T O O L S T O D IG F O R G O L D 24
4. Looking ahead
The mission of my chair is marketing research. So, let me list my marketing research goals for the coming years.
Mission 1: Developing new survey methods
The literature on the psychology of survey response has identified numerous response tendencies. However, psychometric scaling models have generally lagged behind, mostly for reasons of mathematical tractability and due to compu tational limitations. As computers are becoming more powerful, increa -singly rich models can be specified. Necessarily, we will have to make some assumptions and pay attention to identification. As with all structural models, identifying some of the behavioral effects will be easier through the use of specific research designs. For instance, it is possible to manipulate between-subjects the probabilities of having to provide a truthful answer when using the randomized response technique (Clark and Desharnais 1998). By doing so, we can estimate non-adherence to the procedure, which would otherwise be unidentified if a single question were asked via the randomized response procedure. Combining such statistical and design-based procedures can lead to valuable new insights for those who rely on surveys for inference.
Mission 2: A cross-cultural focus
While it is relatively easy and cheap to collect data in one country, the costs of data collection for large-scale cross-cultural research are often prohibitive. Nonetheless, knowing how to ask and analyze questions in non-Western markets is very important. After all, the majority of the world’s consumers do not live in the countries where marketing theories and scaling methodologies were developed. Measuring preferences in emerging markets requires different wording, response formats, and analysis techniques. For example, Schwartz and colleagues developed the Portrait values questionnaire to measure value priorities of respondents who are not that highly educated (Schwartz et al. 2001). The measure is more concrete and less cognitively complex than his original scale to measure values. In my work with Steenkamp and Veldkamp, I also developed a cross-cultural method to derive short-form scales that maximizes the amount of information and minimizes the burden for the respondent (De Jong, Steenkamp, and Veldkamp 2009).
The rise of the Internet has made collecting international data via Web-surveys much cheaper, but cross-cultural data is still expensive. Several colleagues have told me that they would like to work on cross-cultural topics but
M A R T IJ N D E J O N G N E W S U R V E Y M E T H O D S : T O O L S T O D IG F O R G O L D 25
lack the resources. I will take up this task, because generally I have access to great international datasets. During my PhD, I had access to a large cross-cultural dataset provided to me by my advisor. At Erasmus, I collected data in 17 countries together with my co-authors Stefan Stremersch and Nuno Camacho. And I am happy to announce that I have been awarded a VIDI grant by the Netherlands Organization for Scientific Research, which includes a budget for a large survey-based international data collection. Last but not least, I also teach global marketing in ESE’s MSc in Marketing program, so I can disseminate cross-cultural knowledge.
Mission 3: Validating the new methods
Approaches to improve the behavioral richness of psychometric models should go in tandem with validation. That is, we should test whether the newly proposed methods improve the quality of our inferences. There are several ways to go about this. Looking at nomological validity is an approach that I have frequently used in my own research. Improved nomological validity implies that the links between variables become more plausible. Another approach is to consider predictive validity. A new method should better predict some observed behavior than a simpler model. We can also compare observed data and self-reported data. For instance, my co-author Jean Paul Fox and colleagues used a biomarker to determine actual smoking status (Fox, Avetisyan, and Van der Palen 2012). Such comparisons help us to determine whether the added complexity is warranted.
Mission 4: Disseminating the new methods
Most survey researchers in our field use relatively simple techniques to calibrate their models. They either rely on the directly observed scores, or on the Structural Equations Modeling (SEM) framework, implemented in popular software packages such as LISREL and MPlus. Given the complexity of the models that specify a richer response process, it may come as no surprise that the adoption of item response theory models in marketing has been rather slow. In fact, the estimation of multidimensional IRT models suited for the analysis of attitudinal responses was simply not feasible until recently, and considerable econometric skill is required to specify and estimate such models. Obviously, if models are available in commercial software packages, popularity of the models is boosted. One of the models I developed to ensure comparable scores across nations (De Jong, Steenkamp, and Fox 2007; De Jong et al. 2008), has already been implemented in the MPlus software package. Furthermore, software code for the item randomized response models I developed is available in the appendix of one of my most recently published articles (De Jong, Pieters, and Stremersch
M A R T IJ N D E J O N G N E W S U R V E Y M E T H O D S : T O O L S T O D IG F O R G O L D 26
2012). Such code will also help social science researchers in other disciplines to adopt and apply the new methods. Finally, it would be very valuable to report estimated item parameters in popular handbooks of marketing scales (e.g., Bearden and Netemeyer 1999), in order to construct item banks. Item banks can be used to select the best items given a certain objective function (De Jong, Steenkamp and Veldkamp 2009).
M A R T IJ N D E J O N G N E W S U R V E Y M E T H O D S : T O O L S T O D IG F O R G O L D 27
M A R T IJ N D E J O N G N E W S U R V E Y M E T H O D S : T O O L S T O D IG F O R G O L D 28
Dankwoord
Ik ben aan het einde van mijn rede beland, dus is het de hoogste tijd om een heel aantal mensen te bedanken.
Geachte Rector Magnificus, mijnheer de Decaan. Het is een voorrecht om op Erasmus te mogen werken. De reputatie van Erasmus op het gebied van economie en bedrijfskunde is ijzersterk. Ik hoop via mijn werk te mogen bijdragen aan het verstevigen van dit merk. Vanaf mijn doctoraat heb ik alle medewerking gehad om veel tijd aan mijn onderzoek te besteden en me maximaal te ontplooien. Ik denk aan het ERIM Early Career programme, de EUR fellowship, de ERIM young researcher awarden de Erasmus Research awarddie eervolle onderscheidingen op mijn curriculum vitae opleverden. Mijn langdurige verblijf in het buitenland als visiting scholar op Columbia University is eveneens volledig gefaciliteerd. De benoeming tot hoogleraar is het meest recente bewijs.
Hooggeleerden Commandeur, Franses.
Harry, ik wil om te beginnen jou bedanken. Je was de eerste die mijn keuze voor de wetenschap heeft beïnvloed. Tijdens mijn studie econometrie was je een bron van inspiratie voor mij. Je hebt altijd in me geloofd, maar gaf me ook de vrijheid om mijn eigen pad te volgen.
Philip Hans, ik begon als je studentassistent, en nu, iets meer dan 10 jaar later sta ik hier tijdens jouw decanaat als hoogleraar. De tijd vliegt. Ik ben je zeer dankbaar voor de grote inspanningen die je levert voor de faculteit, en dat je me de mogelijkheid hebt gegeven om weer terug te keren naar de ESE.
Hooggeleerden Steenkamp, Pieters.
Jan Benedict, er zijn weinig mensen aan wie ik meer dank ben verschuldigd dan jij. De vaardigheden die je me hebt bijgebracht en de mooie datasets die je me kon verschaffen hebben mijn carrière in een stroomversnelling gebracht. Onze samenwerking heeft vele toppublicaties opgeleverd. Helaas kun je er niet bij zijn omdat je congresorganisator bent in North Carolina deze week.
Mijn band met Tilburg is niet verdwenen na het behalen van mijn doctoraat. Rik, we zijn intensief gaan samenwerken na mijn vertrek uit Tilburg. Jouw encyclopedische kennis en unieke manier van denken zijn ronduit inspirerend. Ik heb reeds veel van je mogen leren waardoor ik me als wetenschapper verder heb kunnen vormen.
M A R T IJ N D E J O N G N E W S U R V E Y M E T H O D S : T O O L S T O D IG F O R G O L D 29
Hooggeleerden Van Bruggen, Van Osselaer, Verschoor.
Gerrit, een speciaal woord van dank richting jou. Ik heb vele jaren met plezier bij de Rotterdam School of Management gewerkt, en dat kwam vooral door jouw bezielende leiderschap. Stijn, na Gerrits vakgroepvoorzitterschap heb je het stokje overgenomen. Je hebt me altijd uitgedaagd om meer uit mezelf te halen, om mezelf te blijven verbeteren. Willem, je doet voortreffelijk werk als capaciteitsgroepsdirecteur bij de ESE. Je enorme menselijke betrokkenheid, tomeloze inzet en je streven naar kwaliteit heeft de capaciteitsgroep tot nieuwe hoogtes gebracht.
Hooggeleerde Stremersch.
Stefan, we kennen elkaar al een lange tijd. Je bent wat mij betreft een ware pionier. Het is een voorrecht om je als collega te hebben. Nadat ik je te kennen had gegeven graag bij mijn alma materte willen terugkeren heb je dit gefacili -teerd en snel actie ondernomen om de zaak rond te krijgen. Ik ben je hier zeer erkentelijk voor.
Mijn co-auteurs: Jan Benedict Steenkamp, Hans Baumgartner, Jean-Paul Fox, Rik Pieters, Bernard Veldkamp, Olivier Toubia, Don Lehmann, Oded Netzer, Ulf Böckenholt, Peter Verhoef, Bas Donkers, Stefan Stremersch, Daniel Stieger en Johann Fueller.
Ik heb me mogen optrekken aan jullie intellect. Net zoals mensen in de sport beter worden door te trainen met anderen die zeer goed zijn, zo ben ik als wetenschapper beter geworden door met jullie te werken. Jullie talent en vaardigheden houden me scherp en motiveren me.
Collega’s van de marketing secties van RSM en ESE.
Dank voor de camaraderie. Jullie hebben altijd gezorgd voor een zeer aangename werkcultuur waarin zowel kwaliteit van onderzoek als gezelligheid hoog in het vaandel staan.
Mijn ouders.
Waar zou ik zijn zonder jullie? Jullie zijn mijn steun en toeverlaat. Vroeger, nu, en in de toekomst. Dank dat jullie me altijd hebben bijgebracht om het maximale uit mezelf te halen, en voor jullie vele wijze lessen.
Mijn tweelingbroer Bas.
Bas, niemand kent mij langer dan jij. Het is uniek om tweeling te zijn, om iemand in je leven te hebben die je door en door begrijpt, en aan een enkel woord al voldoende heeft. Ik hoop spoedig ook bij jouw oratie aanwezig te zijn.
M A R T IJ N D E J O N G N E W S U R V E Y M E T H O D S : T O O L S T O D IG F O R G O L D 30
Yvonne.
Ik ben heel blij met het hoogleraarschap, maar toch ben jij het meest waarde -volle geschenk dat de Erasmus universiteit me heeft gegeven. Dank voor je liefde en de rust die je brengt in mijn leven. Ik zie uit naar onze bruiloft.
Ten slotte bedank ik God, mijn Schepper, voor alle zegeningen die ik heb mogen ontvangen, en voor de talenten die Hij mij gegeven heeft. Ik zal ze zo goed mogelijk gebruiken in mijn nieuwe functie.
Ik heb gezegd! M A R T IJ N D E J O N G N E W S U R V E Y M E T H O D S : T O O L S T O D IG F O R G O L D 31
M A R T IJ N D E J O N G N E W S U R V E Y M E T H O D S : T O O L S T O D IG F O R G O L D 32
References
Angrist, Joshua D., and Jorn-Steffen Pischke (2010), “The Credibility Revolution in Empirical Economics: How Better Research Design is Taking the Con out of Econometrics,”Journal of Economic Perspectives, 24 (2), 3-30.
Baumgartner, Hans and Jan-Benedict E.M. Steenkamp (2001), “Response Styles in Marketing Research: A Cross-National Investigation,” Journal of Marketing Research, 38 (May), 143-156.
Bearden, W. O., and R. G. Netemeyer (1999), Handbook of Marketing Scales: Multi-Item Measures for Marketing and Consumer Behavior Research, 2nded.
Newbury Park, CA: Sage Publications.
Becht, Bart (2011), NRC Handelsblad, June 4.
Berry, Steven, James Levinsohn, and Ariel Pakes (2004), “Differentiated Products Demand Systems from a Combination of Micro and Macro Data: The New Car Market,” Journal of Political Economy,112 (1), 68-105.
Burgess, Stephen M. and Pfavai Nyajeka (2007), “Market Orientation and Performance in Low-Income Countries: The Case of Zimbabwean Retailers,” in José Antonio Rosa, Madhubalan Viswanathan (ed.) Product and Market Development for Subsistence Marketplaces (Advances in International Manage -ment, Volume 20), Emerald Group Publishing Limited, p. 215-257.
Campbell, Donald T., and Julian C. Stanley (1963), “Experimental and quasi-experimental designs for research on teaching,” in: Gage, N.L. (Ed.), Handbook of Research on Teaching. Rand McNally, Chicago.
Catania, Joseph A., David R. Gibson, Dale D. Chitwood, and Thomas J. Coates (1990), “Methodological Problems in AIDS Behavioral Research: Influences on Measurement Error and Participation Bias in Studies of Sexual Behavior,” Psychological Bulletin, 108, 339-362.
Chen, Xinlei, George John, Julie M. Hays, Arthur V. Hill, and Susan E. Geurs (2009), “Learning from a Service Guarantee Quasi Experiment,” Journal of Marketing Research, 46 (October), 584-596.
M A R T IJ N D E J O N G N E W S U R V E Y M E T H O D S : T O O L S T O D IG F O R G O L D 33
Clark, Stephen J., and Robert H. Desharnais (1998), “Honest Answers to Embarrassing Questions: Detecting Cheating in the Randomized Response Model,”Psychological Methods, 3 (2), 160-168.
Cronin, Blaise and Elisabeth Davenport (2001), “E-Rogenous Zones: Positioning Pornography in the Digital Economy,” The Information Society, 17, 33-46.
De Jong, Martijn G., Don Lehmann, and Oded Netzer (2012), “State-dependence Effects in Surveys,” Marketing Science, 31 (September-October), 838-854.
De Jong, Martijn G., Rik Pieters, and Jean-Paul Fox (2010), “Reducing Social Desirability Bias Through Item Randomized Response: An Application to Measure Underreported Desires,” Journal of Marketing Research, 47 (February), 14-27.
De Jong, Martijn G., Rik Pieters, and Stefan Stremersch (2012), “Analysis of Sensitive Questions Across Cultures: An Application of Multigroup Item Randomized Response Theory to Sexual Attitudes and Behavior,” Journal of Personality and Social Psychology, 103, 543-564.
De Jong, Martijn G., Jan Benedict E.M. Steenkamp, and Jean-Paul Fox (2007), “Relaxing Measurement Invariance in Cross-National Consumer Research Using a Hierarchical IRT Model,”Journal of Consumer Research, 34 (August), 260-278.
De Jong, Martijn G., Jan-Benedict E.M. Steenkamp, Jean-Paul Fox, and Hans Baumgartner (2008), “Using Item Response Theory to Measure Extreme Response Style in Marketing Research: A Global Investigation,” Journal of Marketing Research, 45 (February), 104-115.
De Jong, Martijn G., Jan Benedict E.M. Steenkamp, and Bernard P. Veldkamp (2009), “A Model for the Construction of Country-Specific, Yet Internationally Comparable Short-form Marketing Scales,” Marketing Science, 28 (4), 674-689.
Fox, Jean-Paul A., Marianna Avetisyan, and Job A.M.Van der Palen (2012), “Mixture Randomized Response Modeling: A Smoking Behavior Validation Study”, Twente University, working paper.
M A R T IJ N D E J O N G N E W S U R V E Y M E T H O D S : T O O L S T O D IG F O R G O L D 34
Goldberger, Arthur S. (1972), “Structural Equation Methods in the Social Sciences,”Econometrica, 40 (6), 979-1001.
Heckman, James J., and Edward Vytlacil (2005), “Structural Equations, Treatment Effects, and Econometric Policy Evaluation,” Econometrica, 73 (3), 669-738.
Hofstede, Geert H. (1980), Culture’s Consequences: International Differences in Work-Related Values, Thousand Oaks, CA: Sage.
Hofstede, Geert H. (2001), Culture’s Consequences: Comparing Values, Behaviors, Institutions, and Organizations Across Nations. 2nded., Thousand Oaks,
CA: Sage.
Holland, Paul W. (1986), “Statistics and Causal Inference,” Journal of the American Statistical Association, 81, 945-960.
Hutchinson, Wesley J., Wagner A. Kamakura, and John G. Lynch Jr. (2000), “Unobserved Heterogeneity as an Alternative Explanation for “Reversal” Effects in Behavioral Research,” Journal of Consumer Research, 27 (December), 324-344.
Jöreskog, Karl G. and Marielle van Thillo (1972), “LISREL: A General Computer Program for Estimating a Linear Structural Equation System Involving Multiple Indicators of Unmeasured Variables (RB-72-56),” Princeton, NJ: Educational Testing Service.
Kapteyn, Arie, J. P. Smith, and Arthur van Soest (2007), “Vignettes and Self-reports of Work Disability in the US and The Netherlands,” American Economic Review, 97(1), 461-473.
Keane, Michael P. (2010), “Structural Versus Atheoretic Approaches to Econometrics,” Journal of Econometrics, 156, 3-20.
Kohli, Ajay, and Bernard J. Jaworski (1990), “Market Orientation: The Construct, Research Propositions, and Managerial Implications,” Journal of Marketing, 54 (April), 1-18.
Kohli, Ajay (2011), “Reflections on the Review Process,” Journal of Marketing, 75 (November), 1-4. M A R T IJ N D E J O N G N E W S U R V E Y M E T H O D S : T O O L S T O D IG F O R G O L D 35
Lehmann, Donald (2005), “Journal Evolution and the Development of Marketing,” Journal of Public Policy & Marketing, 24 (1), 137-142.
Manski, Charles F. (2000), “Economic Analysis of Social Interactions,” The Journal of Economic Perspectives, 14 (3), 115-136.
McDonald, Roderick P. (1999), Test Theory: A Unified Treatment, Mahwah, NJ: Lawrence Erlbaum Associates.
Pearl, Judea (2009), “Causal Inference in Statistics: An Overview,” Statistics Surveys, 3, 96-146.
Podsakoff, Philip M., Scott B. MacKenzie, and Nathan P. Podsakoff (2012), “Sources of Method Bias in Social Science Research and Recommendations on How to Control It,” Annual Review of Psychology, 63, 539-569.
Reibstein, David J., George Day, and Jerry Wind (2009), “Guest editorial: Is Marketing Academia Losing Its Way?”Journal of Marketing, 73 (July), 1-3.
Reiss, Peter C. (2012), “Structural Workshop Paper: Descriptive, Structural, and Experimental Empirical Methods in Marketing Research,” Marketing Science, 30 (6), 950-964.
Reiss, Peter C. and Frank A. Wolak (2007), “Structural Econometric Modeling: Rationales and Examples from Industrial Organization,” in James J. Heckman and Edward E. Leamer (Eds.) Handbook of Econometrics, Vol. 6A, 4277-4415.
Rindfleisch, Aric, Alan J. Malter, Shankar Ganesan and Christine Moorman (2008), “Cross-Sectional Versus Longitudinal Survey Research: Concepts, Findings, and Guidelines,” Journal of Marketing Research, 45 (June), 261-279.
Roese, Neal J. and David W. Jamieson (1993), “Twenty Years of Bogus Pipeline Research: A Critical Review and Meta-Analysis,” Psychological Bulletin, 114 (2), 363-375.
Samejima, Fumiko (1969), “Estimation of Latent Ability Using a Response Pattern of Graded Scores,” Psychometrika Monograph Supplement, 17, 1-100.
Schultz, Don (2012), “Can Big Data Do It All?” Marketing News, November, p. 9.
M A R T IJ N D E J O N G N E W S U R V E Y M E T H O D S : T O O L S T O D IG F O R G O L D 36
Schwartz, Shalom H., Gila Melech, Arielle Lehmann, Steven Burgess, Marri Harris, and Vicki Owens (2001), “Extending the Cross-Cultural Validity of the Theory of Basic Human Values with a Different Method of Measurement,” Journal of Cross-Cultural Psychology, 32 (5), 519-542.
Simmons, Joseph P., Leif D. Nelson, and Uri Simonsohn (2011), “False-Positive Psychology: Undisclosed Flexibility in Data Collection and Analysis Allows Presenting Anything as Significant ,” Psychological Science, 22 (11), 1359-1366.
Sims, Christopher A. (2010), “But Economics Is Not an Experimental Science,” Journal of Economic Perspectives, 24 (2), 59-68.
Srinivasan, Shuba, Marc Vanhuele, and Koen Pauwels (2010), “Mind-Set Metrics in Market Response Models: An Integrative Approach,” Journal of Marketing Research, 47 (4), 672-684.
Steenkamp (2005), “Moving Out of the U.S. Silo: A Call to Arms for Conducting International Marketing Research,” Journal of Marketing, 69 (4), 6-8.
Steenkamp, Jan Benedict E.M. and Inge Geyskens (2006), “What Drives the Perceived Value of Web Sites? A Cross-national Investigation,” Journal of Marketing, 70 (3), 136-150.
Tourangeau, Roger, Lance J. Rips and Kenneth Rasinski (2000), The Psychology of Survey Response, Cambridge, UK: Cambridge University Press.
van Praag, Bernard (1971), “The Welfare Function of Income in Belgium: An Empirical Investigation,” European Economic Review, 2 (3), 337-369.
Wooldridge, Jeffrey M. (2010), Econometric Analysis of Cross-section and Panel Data(Second Edition), Cambridge, MA: MIT Press.
M A R T IJ N D E J O N G N E W S U R V E Y M E T H O D S : T O O L S T O D IG F O R G O L D 37
M A R T IJ N D E J O N G N E W S U R V E Y M E T H O D S : T O O L S T O D IG F O R G O L D 38
Erasmus Research Institute of Management - ERIM
Inaugural Addresses Research in Management Series ERIM Electronic Series Portal: http://hdl.handle.net/1765/1
Balk, B.M., The residual: On monitoring and Benchmarking Firms, Industries and Economies with respect to Productivity,9 November 2001, EIA-07-MKT, ISBN 90-5892-018-6, http://hdl.handle.net/1765/300
Benink, H.A., Financial Regulation; Emerging from the Shadows,15 June 2001, EIA-02-ORG, ISBN 90-5892-007-0, http://hdl.handle.net/1765/339
Bleichrodt, H., The Value of Health, 19 September 2008, EIA-2008-36-MKT, ISBN/EAN 978-90-5892-196-3, http://hdl.handle.net/1765/13282
Boons, A.N.A.M., Nieuwe Ronde, Nieuwe Kansen: Ontwikkeling in Management Accounting & Control, 29 September 2006, EIA-2006-029-F&A,
ISBN 90-5892-126-3, http://hdl.handle.net/1765/8057
Brounen, D., The Boom and Gloom of Real Estate Markets, 12 December 2008, EIA-2008-035-F&A, ISBN/EAN 978-90-5892-194-9,
http://hdl.handle.net/1765/14001
Bruggen, G.H. van, Marketing Informatie en besluitvorming: een inter-organisationeel perspec tief, 12 October 2001, EIA-06-MKT, ISBN 90-5892-016-X, http://hdl.handle.net/1765/341
Commandeur, H.R., De betekenis van marktstructuren voor de scope van de onderneming. 05 June 2003, EIA-022-MKT, ISBN 90-5892-046-1, http://hdl.handle.net/1765/427
Dale, B.G., Quality Management Research: Standing the Test of Time; Richardson, R., Performance Related Pay – Another Management Fad?; Wright, D.M., From Downsize to Enterprise: Management Buyouts and Restructuring Industry. Triple inaugural address for the Rotating Chair for Research in Organisation and Management. March 28, 2001, EIA-01-ORG, ISBN 90-5892-006-2, http://hdl.handle.net/1765/338 M A R T IJ N D E J O N G N E W S U R V E Y M E T H O D S : T O O L S T O D IG F O R G O L D 39
De Cremer, D.,On Understanding the Human Nature of Good and Bad Behavior in Business: A Behavioral Ethics Approach, 23 October 2009,
ISBN 978-90-5892-223-6, http://hdl.handle.net/1765/17694
Dekimpe, M.G.,Veranderende datasets binnen de marketing: puur zegen of bron van frustratie?, 7 March 2003, EIA-17-MKT, ISBN 90-5892-038-0, http://hdl.handle.net/1765/342
Dijk, D.J.C. van,“Goed nieuws is geen nieuws”, 15 November 2007,
EIA-2007-031-F&A, ISBN 90-5892-157-4, http://hdl.handle.net/1765/10857
Dissel, H.G. van, “Nut en nog eens nut” Over retoriek, mythes en rituelen in informatie systeem onderzoek,15 February 2002,EIA-08-LIS,
ISBN 90-5892-018-6,http://hdl.handle.net/1765/301
Donkers, A.C.D., “The Customer Cannot Choose”,Apruil 12, 2013, ISBN 978-90-5892-334-9,http://hdl.handle.net/1765/39716
Dul, J., “De mens is de maat van alle dingen” Over mensgericht ontwerpen van producten en processen., 23 May 2003, EIA-19-LIS, ISBN 90-5892-038-X, http://hdl.handle.net/1765/348
Ende, J. van den, Organising Innovation, 18 September 2008,
EIA-2008-034-ORG, ISBN 978-90-5892-189-5, http://hdl.handle.net/1765/13898
Groenen, P.J.F., Dynamische Meerdimensionele Schaling: Statistiek Op De Kaart, 31 March 2003, EIA-15-MKT, ISBN 90-5892-035-6,
http://hdl.handle.net/1765/304
Hartog, D.N. den,Leadership as a source of inspiration,5 October 2001, EIA-05-ORG, ISBN 90-5892-015-1, http://hdl.handle.net/1765/285
Heck, E. van, Waarde en Winnaar; over het ontwerpen van electronische veilingen, 28 June 2002, EIA-10-LIS, ISBN 90-5892-027-5,
http://hdl.handle.net/1765/346
Heugens, Pursey P.M.A.R., Organization Theory: Bright Prospects for a Permanently Failing Field, 12 September 2008, EIA-2007-032 ORG, ISBN/EAN 978-90-5892-175-8, http://hdl.handle.net/1765/13129 M A R T IJ N D E J O N G N E W S U R V E Y M E T H O D S : T O O L S T O D IG F O R G O L D 40