On the Evolution of Mobile Platform Ecosystem
Structure and Strategy
The mobile ecosystem is experiencing a wave of transformation with the emergence of new
players, changing roles of existing players, and the creation of new business models. Drivers
of change include attractive consumer tariffs for ubiquitously available mobile broadband
access, development of increasingly powerful mobile devices, and the emergence of an
“App Economy”. Mobile platforms play a particularly central role in this transformation.
Drawing on theories of technological platforms and business ecosystems a visualization
approach to the study of mobile platform ecosystem structure and strategy is presented.
The study provides a basis for understanding change in the converging mobile ecosystem.
DOI 10.1007/s12599-011-0174-4
The Authors
Rahul C. Basole, Ph.D. (
) Georgia Institute of Technology Tennenbaum Institute 760 Spring Street NW Atlanta, GA 30332 USA [email protected] Dr. Jürgen KarlaInstitute of Business Information Systems RWTH Aachen Templergraben 64 52062 Aachen Germany [email protected] Received: 2010-08-30 Accepted: 2011-07-11 Accepted after three revisions by Dr. Bub.
Published online: 2011-08-30 This article is also available in Ger-man in print and via http://www. wirtschaftsinformatik.de: Basole RC, Karla J (2011) Entwicklung von Mo-bile-Platform-Ecosystem-Strukturen und -Strategien. WIRTSCHAFTSIN-FORMATIK. doi: 10.1007/s11576-011-0286-y.
©Gabler Verlag 2011
1 Introduction
In recent years global handset sales have been primarily driven by the significant growth of smartphones, a type of mo-bile device that uses a high-level oper-ating system (OS), or mobile platform, to run a wide variety of applications which are downloaded and installed by users. The success of smartphones has in turn led to an intense battle between mobile platform providers, each look-ing for ways to become the system of choice for mobile device manufactur-ers, mobile network operators, and mo-bile application developers (Calem2010, p. 18). Unquestionably, the outcomes of this platform battle will shape the fu-ture of the mobile industry as it will ei-ther accelerate or stifle innovation and growth.
This paper uses a visualization ap-proach to provide a deeper understand-ing of the evolvunderstand-ing structure and strate-gies used in the mobile platform ecosys-tem over the past five years and its impli-cations for the future. We focus our study on four key market segments, namely mobile device manufacturers (MDM), mobile network operators (MNO), mo-bile application developers (MAD), and mobile platform providers (MPP). The chosen context and timeframe is rele-vant for three key reasons. First, due to the enormous financial opportunities generated by smartphones, the mobile ecosystem is rapidly transforming and new relations and affiliations are con-tinuously formed (Basole2009, p. 147). Second, the four segments constitute the core of the evolving mobile ecosys-tem as they are fundamentally involved
in the building, design, and distribu-tion of handsets, software, hardware, and mobile networks associated with smart-phones. Lastly, the chosen time span has seen a rapid rise in smartphones adop-tion and usage as well as the emer-gence of several new mobile platforms, such as Apple’s iOS (formerly named Apple OS), Android, LiMo, and web-OS (formerly named Palm web-OS). Any attempt to understand the future of mobile telecommunications will conse-quently require an understanding of the as-is and to-be of the mobile platform ecosystem.
2 Theoretical Foundation
Our study of the evolution of the mo-bile platform ecosystem builds on sev-eral complementary theoretical founda-tions. A complete review of the literature is beyond the scope of this paper. Table1 presents a summary of relevant research streams and key studies. In the follow-ing section we elaborate in further de-tail on the particular importance of plat-forms, the strategic and economic rele-vance of interfirm networks, and the ap-plication of structural analysis and visu-alization to the study of business ecosys-tems.
2.1 Technology Platforms
The value, design, and management of technology platforms has been a topic of increasing interest to both researchers and practitioners (see Table 1). Arm-strong (2006, p. 668) and Rochet and
Ti-Table 1 Summary of Relevant Literature
Research Stream Description Supporting Literature
Business ecosystem •Study of economic communities consisting of interacting organizations.
Moore (1993,1996), Iansiti and Levien (2004a, 2004b), Iyer et al. (2006), Chesbrough and Appleyard (2007)
•Concept is based on the ecological metaphor that firms are part of a larger ecosystem, each occupying a contributing role and forming symbiotic relationships with customers, suppliers, and competitors.
Interfirm networks •Study of the formation, evolution, governance, transformation, and consequences of different types of interfirm networks (e.g., strategic, innovation, R&D, supply, licensing, consortia, etc.).
Oliver (1990), Galaskiewicz and Wasserman (1989), Ahuja (2000), Dyer and Singh (1998), Gnyawali and Madhavan (2001), Gulati (1998), Gulati et al. (2000), Nohria and Garcia-Pont (1991), Gulati and Gargiulo (1999), Venkatraman and Lee (2004), Koka and Prescott (2008), Provan et al. (2007), Schilling and Phelps (2007), Rosenkopf and Schilling (2007) •Studies assume one of two complementary levels of
analysis: actor level or whole network level.
•Common themes include relationships, connectedness, embeddedness, social capital, collaboration, trust, cooperation, and contracts.
Technology platforms •Study of the purpose, design, economics (e.g., pricing, incentives, network externalities, etc.), and role of proprietary or open source technology platforms.
Gawer and Cusumano (2002), Rochet and Tirole (2003), West (2003), Economides and Katsamakas (2006), Brousseau and Penard (2007), Eisenmann (2008), Evans et al. (2006)
Network visualization •Study of the visualization and navigation of abstract data structures for purposes of exploration, discovery, and sense-making.
Tufte (1983), Becker et al. (1995), Eick (1996), Abello et al. (1999), Di Battista et al. (1999), Herman et al. (2000), Ware et al. (2002), Moody et al. (2005), Keller et al. (2006), Shneiderman and Aris (2006) •Human-computer interaction issues play a central role.
•Common topics include graph layouts, navigation and interaction, clustering, and system development. Mobile telecom industry •Study of a wide range of topics, including competition,
partnerships, innovation, evolution, policy, etc.
Barnes (2002), Li and Whalley (2002), Maitland et al. (2002), Peppard and Rylander (2006), Tilson and Lyytinen (2006), Dittrich and Duysters (2007), Rosenkopf and Padula (2008), Basole (2009), Reuver et al. (2009)
role (2003, pp. 3–4) suggested that tech-nology platforms are multi-sided mar-kets since they bring together various types of participants, or sides, such as buyers and sellers. Studies have used various lenses to understand platform competition (Rochet and Tirole 2003), emergence (Iyer et al. 2007), strate-gies (West 2003), strategic differences (Economides and Katsamakas 2006), and the role of complementary markets (Gawer and Henderson 2007). Gawer and Henderson (2007, p. 1) suggest that many high-tech products and services can be considered as “systems of in-terdependent components, built around and on top of platforms” and are of-ten provided by a complex network of firms, or ecosystem (Iansiti and Levien 2004a, p. 17). Technology platforms pro-vide other constituents the ability to build and provide complementary prod-ucts and services (Parker and Alstyne 2008, p. 2).
2.2 Interfirm Networks and Business Ecosystems
The conceptualization of markets as ecosystems is a result of theoretical ex-tensions of work in interfirm networks, alliances, and innovation (Basole and Rouse2008, p. 55). In her seminal work, Oliver (1990) suggested that interfirm re-lations are a result of six fundamental determinants, namely asymmetry, reci-procity, efficiency, stability, legitimacy, and necessity. In emerging technology industries, networks and alliances were found particularly beneficial due to the ability for firms to share risks, to develop, and to have access to synergistic knowl-edge (Eisenhardt and Schoonhoven1996, p. 136).
Recent studies have adopted a com-plex networked systems perspective to examine why, when, and how interfirm networks and alliances form and change (Gulati et al.2000). This view combines
both the resource-dependency and em-beddedness perspective and suggests that interfirm networks are complex systems characterized by co-evolving actors en-gaged in collaboration and competition (Iansiti and Levien 2004a, p. 41). The complex networked systems approach we apply has been used to study value net-works and ecosystems in a variety of in-dustries (Basole2009; Basole and Rouse 2008; Rosenkopf and Schilling2007). 2.3 Structural Analysis and Visualization Given the importance of interfirm rela-tions in the technology platform context, it is valuable to gain a greater understand-ing of the underlyunderstand-ing structural char-acteristics of different platform ecosys-tems and the resulting business model implications. Broadly, an ecosystem can be described as a networked system that contains a set of objects (e.g., actors, nodes, etc.) that are tied to each other. In
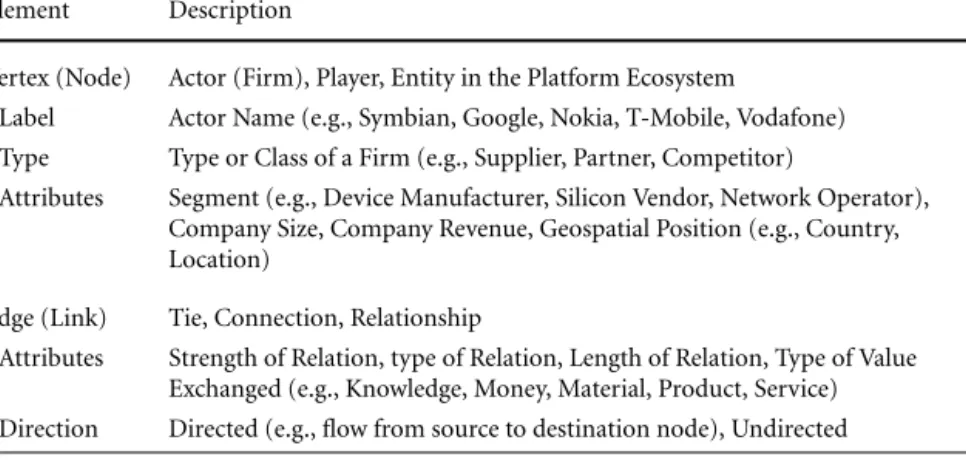
Table 2 Summary of Platform Ecosystem Elements Element Description
Vertex (Node) Actor (Firm), Player, Entity in the Platform Ecosystem
- Label Actor Name (e.g., Symbian, Google, Nokia, T-Mobile, Vodafone) - Type Type or Class of a Firm (e.g., Supplier, Partner, Competitor)
- Attributes Segment (e.g., Device Manufacturer, Silicon Vendor, Network Operator), Company Size, Company Revenue, Geospatial Position (e.g., Country, Location)
Edge (Link) Tie, Connection, Relationship
- Attributes Strength of Relation, type of Relation, Length of Relation, Type of Value Exchanged (e.g., Knowledge, Money, Material, Product, Service) - Direction Directed (e.g., flow from source to destination node), Undirected
platform ecosystems, these objects tend to be firms, and ties are often buyer-supplier relationships, alliances, or part-nerships. Depending on the relationship, ties can be directional, indicating an ori-gin and destination, or non-directional. The conceptualization of ecosystems as a combination of objects and ties is par-ticularly useful as researchers can base their model and hypotheses testing on the established mathematical field of graph theory. While an analytical ap-proach provides valuable insights into the structure and dynamics of ecosys-tems, important knowledge can also be gained through the visualization of com-plex network data (Basole et al. 2010, pp. 1–2).
Visualization of complex systems, how-ever, is not only a very challenging and difficult task but also, if not devel-oped, implemented, or applied correctly, may lead to non-conclusive results (Tufte 1983). Particularly in visualizing com-plex interfirm networks or ecosystems, node-link configurations are not neces-sarily unique, and results may be mis-leading. The boundary-setting problem, or inclusion of nodes, is often artificial. Conclusions based on these models must thus be carefully scrutinized for the pos-sibility of alternative explanations. Along the same lines, the amount of informa-tion that is captured and presented can often be overwhelming to the end-user. In many instances, what complex net-work data are and how they are visual-ized depends not only on the nature of the data but also on the question that is being asked and ultimately the cogni-tive abilities of the user. In order to over-come the aforementioned challenges, re-searchers must therefore ensure a balance between detail, abstraction, accuracy, ef-ficiency, perceptual tension, and
aesthet-ics in their complex network visualiza-tions. These observations highlight the importance of setting the context and defining the elements in an ecosystem vi-sualization study very carefully. Table2 provides a non-exhaustive summary of relevant network elements and their at-tributes that should be considered when visualizing platform ecosystems.
3 The Mobile Platform Ecosystem
Prior to our structural analysis and vi-sualization, it is important to have an understanding of the overall context of our study. The mobile business market is highly dynamic particularly due to continuous technological advances. The enormous market opportunities have led to an entry of a multitude of new par-ticipants, while other participants had to re-position themselves. In other in-stances, firms have extended their activ-ities to neighboring value chain stages. This phenomenon was particularly ob-servable in the case of MNOs which, ow-ing to their unique market position, were able to actively participate in areas other than that of their core business, e.g., as portal providers, content providers, and MADs. The conceptualization of the mo-bile business market as a linear, one di-mensional supply chain process is there-fore inadequate and has led to study these contexts as value networks (Li and Whal-ley2002, p. 462; Peppard and Rylander 2006, p. 14). The mobile industry has consequently been described as a com-plex system with numerous inter-firm re-lationships across multiple segments (Ba-sole2009; Rosenkopf and Padula2008).The success of smartphones has led to a virtual battle of mobile platforms in the mobile ecosystem. There are over
40–50 different mobile platforms, but seven of them hold approximately 97% of the entire market (Nielsen2010). Key players include Symbian, Windows Mo-bile, BlackBerry, webOS, multiple vari-ants of Linux-based platforms, and more recently Apple’s iOS and Google’s An-droid.
The exponential development of mo-bile data service usage derives in part from the introduction of new devices and innovative concepts – in particular those of mobile platform ecosystems. It was Apple who triggered this develop-ment when they introduced the iPhone in 2007 which was tightly integrated with its iTunes software and has since be-come a commercial and cultural phe-nomenon. The success factor thus was not only the device, but also a tightly in-tegrated system that enabled simple ap-plication downloads, management, and payments called the App Store. The suc-cess of Apple’s App Store concept stimu-lated other device manufacturers to de-velop their own platform ecosystems as discussed later. Since the introduction in 2007, developments have been quite re-markable: whereas MNOs have been los-ing their control and influence on the mobile ecosystem, MPPs and MADs have significantly enhanced theirs.
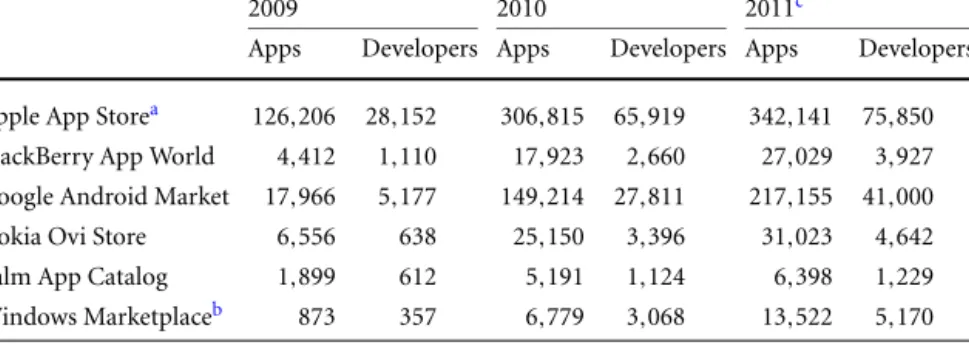
The emergence of app stores signif-icantly impacted MADs. Prior to app stores, market access for MADs was quite limited; MADs generally had to enter contracts with MNOs to have their ap-plication included in the MNO’s portal, the traditional application access channel for mobile users. MNO portals that once dominated content distribution are now paling in significance compared to app stores (Parton et al.2011, p. 28). While users also had the possibility to directly downloading an application from the de-veloper’s website, this option was rarely utilized. Transaction costs were simply too high. The introduction of integrated app stores fundamentally changed the rules of the game. MADs can now submit their products to two-sided electronic markets (Brousseau and Penard 2007, p. 90), benefiting from lowered market entrance barriers such as reduced search costs and payment process handling. This has led to massive entry of many small and medium sized software firms as well as an enormous number of individual de-velopers. Table3provides an overview of the development of the total number of apps and active MADs for each mobile
Table 3 Major App store characteristics (Distimo2011)
2009 2010 2011c
Apps Developers Apps Developers Apps Developers Apple App Storea 126,206 28,152 306,815 65,919 342,141 75,850 BlackBerry App World 4,412 1,110 17,923 2,660 27,029 3,927 Google Android Market 17,966 5,177 149,214 27,811 217,155 41,000 Nokia Ovi Store 6,556 638 25,150 3,396 31,023 4,642 Palm App Catalog 1,899 612 5,191 1,124 6,398 1,229 Windows Marketplaceb 873 357 6,779 3,068 13,522 5,170
aiPhone apps only (excludes Mac Apps and iPad apps) bIncludes apps and developers for Windows Phone 7 cQ1 data only
platform application store from 2009– 2011. Two points of caution should be noted when evaluating the growth: first, while large active MADs exist, many ac-tive MADs submit only a small number of applications, in many instances only a single application to a particular app store. Second, a multiple mobile platform development approach has only recently emerged.
4 Method
The aim of this paper is an analysis and visualization of the structure and evolution of the mobile platform ecosys-tem to identify structural configurations that characterize various types of busi-ness strategies and discuss both theoret-ical and practtheoret-ical implications.
4.1 Data
This study uses a unique dataset that was built by integrating two well-established primary data sources, (1) Thomson’s Fi-nancial SDC Platinum database, a source commonly used in the study of inter-firm networks (e.g., Schilling and Phelps 2007; Rosenkopf and Padula 2008; Lee et al.2010), and (2) Connexiti database, which captures global supplier informa-tion from public filings, company pub-lications, annual reports, major news feeds, and financial databases (e.g., Ba-sole 2009). The dataset was seeded through the identification of companies listed in the recently launched NAS-DAQ OMX® CEA® Smartphone Index (“QFON”), member companies partici-pating in open platform foundations and leading companies in the mobile indus-try as provided by Fortune 1000 lists for 2006-2010.
Our visualization focuses on three of the four core segments of the mobile platform ecosystem: MDMs, MNOs, and MPPs. We did not include MADs in the visualization for three reasons. First, a comprehensive set of MAD segment data (e.g., apps and developers) is available only in aggregate form and from 2008 onwards (see Table3). Second, an inclu-sion of all MADs would have unneces-sarily reduced the clarity of our platform ecosystem visualization. Lastly, even with the availability of detailed MAD segment data, inclusion criteria are not obvious: the majority of key MADs are not large firms (as is the case with the other seg-ments), but rather individual developers (e.g., Constantinou et al.2010, p. 35; Par-ton et al.2011, pp. 23–24). Both MDM (33422) and MNO (513322) map ex-actly to one NAICS code as provided by Thomson Corporation’s Gale Company Profiles and Datamonitor. Given the very large number of actors, the study ap-plied several company inclusion criteria: all leading MPP vendors were included; MNOs (>10 million subscribers) that of-fer high-speed data network services; and all leading MDMs (98% market share) (Milanesi et al. 2009). Furthermore, it should be noted that we included both US and internationally based companies as an exclusion of any market would not adequately capture the truly global foot-print of the mobile platform ecosystem.
The resulting dataset included 70 global companies and over 200 rela-tionships. For each of these companies, the date they entered into a relationship (e.g., partnership announcement, prod-uct launch, etc.) with another actor in the platform ecosystem was identified us-ing the Lexis-Nexis database; company-specific data, such as size and finan-cials, were also captured as provided
by the D&B Million Dollar and Com-puStat database. We also obtained and cross-referenced global market share data for all MPPs from various Gartner and ComScore reports (e.g., De La Vergne et al. 2010; Milanesi et al.2009). All data was collected and organized in a MySQL database for ease of manipulation and ex-traction.
4.2 Visualization
To visualize our interfirm network data, the study used Pajek (Version 1.26). Pajek is a general, non-commercial program for analysis and visualization of very large and complex networks (Batagelj and Mr-var 1998). Custom scripts were devel-oped to automatically generate source code from the MySQL database for use in Pajek.
There are several network layout al-gorithms implemented in Pajek. For the purpose of this study, we used a com-bination of the Kamada-Kawai (KK) al-gorithm (Kamada and Kawai1989) and Fruchterman-Reingold (FR) algorithm (Fruchterman and Reingold1991). Both algorithms are force-directed algorithms. The KK algorithm is a multi-scale lay-out algorithm for the aesthetic drawing of undirected graphs with straight-line edges. It is based on the idea of optimiz-ing a balanced sproptimiz-ing system through en-ergy minimization. Nodes that are close will pull on each other, while those that are distant will push one another apart. The algorithm seeks to find an opti-mum in which there is minimal stress on the springs connecting the whole set of nodes. The FR algorithm is similar to the KK algorithm but introduces a vari-able step width (or temperature) to en-sure that the system reaches an equilib-rium state. We chose to combine the two algorithms to generate a reasonable ini-tial layout using the KK algorithm and then improve the positioning of neigh-boring nodes using the FR algorithm (Di Battista et al.1999).
4.3 Measurement of Network Properties The analysis of the ecosystem requires an understanding of the overall cohesion, position, and number of ties of the actors. We therefore use three network metrics for the structural analysis of mobile plat-form ecosystem evolution. These metrics are: network centralization, network den-sity, and average degree of nodes (com-puted by segment type). Network cen-tralization refers to the degree to which
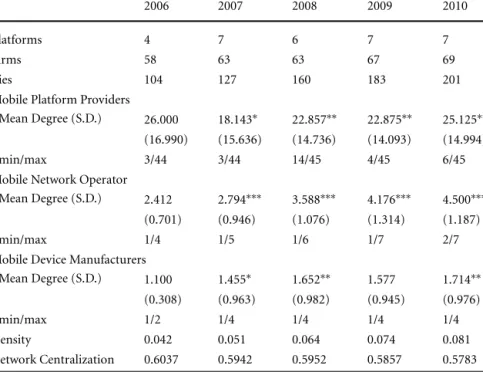
Table 4 Evolution of network characteristics
2006 2007 2008 2009 2010
Platforms 4 7 6 7 7
Firms 58 63 63 67 69
Ties 104 127 160 183 201
Mobile Platform Providers
- Mean Degree (S.D.) 26.000 18.143∗ 22.857∗∗ 22.875∗∗ 25.125∗∗ (16.990) (15.636) (14.736) (14.093) (14.994)
- min/max 3/44 3/44 14/45 4/45 6/45
Mobile Network Operator
- Mean Degree (S.D.) 2.412 2.794∗∗∗ 3.588∗∗∗ 4.176∗∗∗ 4.500∗∗∗ (0.701) (0.946) (1.076) (1.314) (1.187)
- min/max 1/4 1/5 1/6 1/7 2/7
Mobile Device Manufacturers
- Mean Degree (S.D.) 1.100 1.455∗ 1.652∗∗ 1.577 1.714∗∗ (0.308) (0.963) (0.982) (0.945) (0.976)
- min/max 1/2 1/4 1/4 1/4 1/4
Density 0.042 0.051 0.064 0.074 0.081
Network Centralization 0.6037 0.5942 0.5952 0.5857 0.5783 Note: Significant difference from previous year (∗p=0.1,∗∗p=0.05,∗∗∗p=0.01); not applica-ble to 2006
the entire network is focused around a few central nodes (Scott 1991, pp. 89– 90). It can therefore be considered a mea-sure of global centrality. Another global network measure is network density. Net-work density measures how sparse or dense a network is. It is measured using the proportion of ties in a network rel-ative to the total number possible (Scott 1991, p. 71). A dense network thus in-dicates greater degree of interaction be-tween actors in the ecosystem. The degree of a node refers to the number of connec-tions a node has to other nodes (Iyer et al. 2006, p. 32). We distinguish the degree of a node by segment type.
5 Results
Table 4 presents the evolution of net-work characteristics of the mobile plat-form ecosystem between 2006 and 2010. The results show an increase in the num-ber of leading mobile platforms from four in 2006 to seven in 2010, which in-cludes the addition of iOS, Android, and webOS. While we find a modest growth in the number of complementary firms particularly with the entry of several new MDMs, such as Dell and Lenovo, the total number of ties between the firms in the mobile platform ecosystem nearly doubled in our five-year timespan. This
tremendous growth may indicate both global growth of the industry as well as an increasing recognition for platform di-versification and alliance value.
Our results further reveal a substantial variation over time in the number of plat-forms per MNO and per MDM. The av-erage number of platforms per MNO in-creased from less than 2.5 in 2006 to 4.5 in 2010. A statistical means analysis re-veals that there is a significant difference (p<0.01) in the number of platforms per MNO from one year to the next. Sim-ilarly, we see a significant increase in the average number of platforms per MDM in every year, except 2009. The two other network metrics, density and centraliza-tion, show very little variation over time. However, the mobile platform ecosystem exhibits nearly 60% network centraliza-tion over the past five years indicating that the network is focused around a few platforms.
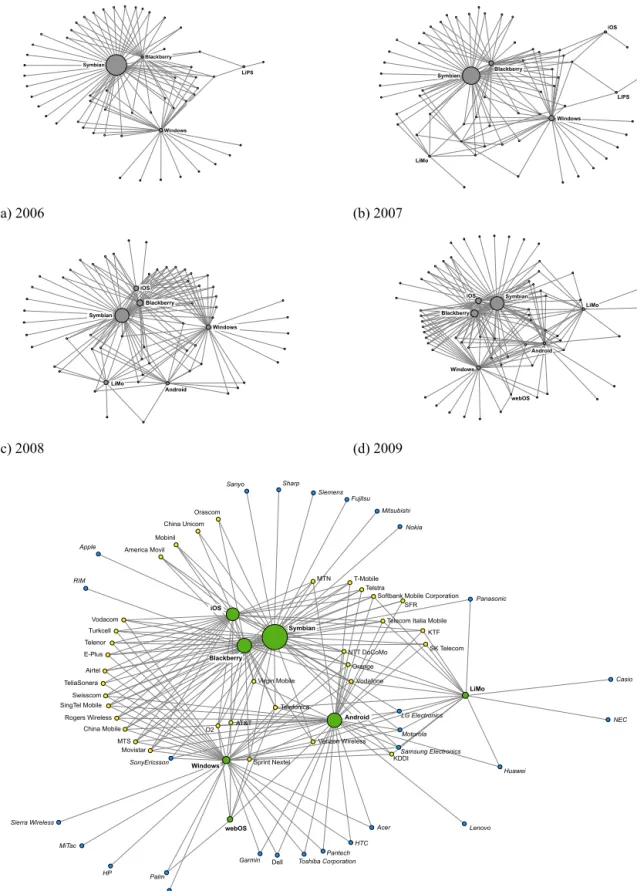
Figures 1a–1e show Pajek-generated visualizations of the mobile platform ecosystem from 2006 to 2010. Due to space constraints, we utilized Tufte’s small multiples approach (Tufte1983) to depict the structure of the mobile ecosys-tem for years 2006–2009. In Fig. 1e, 2010 MPPs, MDMs, and MNOs are de-picted as nodes with <bold>, <italic>, and <normal>-type labels, respectively. The size of the MPP node indicates the
global market share of that platform for that year. A link connects a firm to a plat-form if (i) a MDM sells a device with that platform or (ii) a MNO offers a device with that platform.
Several important observations can be made. First, while Symbian continues to be the leading platform, it has seen its market share shrink particularly due to the growth of iOS, BlackBerry, Windows Mobile, and more recently Android. This finding is supported by the fundamen-tal slower growth of the number of ac-tive developers for the Symbian platform (Table3). In contrast, iOS and Android in particular have seen their number of active developers surge dramatically. Another key observation across time is that several MDMs (e.g., Samsung, Mo-torola, and LG) provide devices with dif-ferent platforms, suggesting a single lead-ing platform has yet to emerge and mul-tiple licenses exist.
Interesting is the relative position of Windows Mobile in the ecosystem, as it does not appear to play a central role in the mobile platform ecosystem at any point during our five-year span. A sim-ilar observation can be made for one of the Linux-based platforms, LiMo. With the recent introduction of the new Win-dows Phone 7 platform, however, we are observing a rapid growth of the num-ber of active developers. It can also be observed that some of the larger MNOs (e.g., AT&T, Vodafone, Orange, and T-Mobile) offer a greater number of plat-forms and devices.
Figure1a shows the mobile platform ecosystem in 2006. Three distinct clusters can be identified; firms that are linked to Symbian, Windows Mobile, and Black-Berry. Symbian is the clear dominant mobile platform with nearly 75% of the total market. Virtually all major MDMs and MNOs use the Symbian platform. The next leading platform is Windows Mobile. It can be seen that there are sev-eral smaller MDMs that exclusively inte-grate the Windows Mobile platform into their product line.
Figure 1b shows the mobile plat-form ecosystem in 2007. This represents the year when Apple released the first-generation iPhone along with its iOS. Given the tremendous hype of the radi-cal technologiradi-cal innovations and design of the iPhone, the iOS has had an imme-diate impact on the mobile device form ecosystem. In 2007, two other plat-forms made their debut. One was An-droid, a platform supported by Google
and endorsed by the Open Handset Al-liance, a group of leading technology and mobile companies. The other platform was LiMo, a Linux-based platform sup-ported primarily by technology and mo-bile companies from Europe and Asia, and some members of the Android plat-form.
One of the most striking changes in the mobile platform ecosystem in 2008 (Fig.1c) is the rapid increase in ties Ap-ple formed with MNOs. The visualiza-tion also shows that BlackBerry, Win-dows Mobile, and Android gained mar-ket share, while Symbian’s platform lead-ership continued to decrease. In 2008, we also saw a consolidation in Linux plat-forms as LiPS announced to join the LiMo platform.
The mobile ecosystem in 2009 (Fig.1d) saw a continued growth of iOS and An-droid, a significant decrease in Symbian, and a stagnation of BlackBerry, Win-dows Mobile, and LiMo market share. The visualization also shows the sepa-ration of the mobile platform ecosys-tem into four distinct MPP clusters, with iOS, BlackBerry, and Symbian occupy-ing more central positions, Android and Windows Mobile placing on the inner ring and LiMo and the new entrant we-bOS clearly positioning at the periph-ery. In 2009, MADs clearly favored the iOS platform with Android coming in second.
Figure1e shows the mobile platform ecosystem in 2010. Platform diversifica-tion among MNOs continues to grow, suggesting that a single dominant plat-form has not yet emerged. Both Win-dows Mobile and Symbian saw their mar-ket share decrease while BlackBerry re-mained relatively stable. One of the most interesting observations, however, is that Android leaped iOS in overall market share as a result of an increasing num-ber of MDMs adopting it as their plat-form of choice and MNOs integrating it into their service offerings. Unquestion-ably, Android appears to have the largest momentum among all mobile platforms, although this is not clearly reflected in the number of active MADs. In 2010, iOS still held the top position with over 65,000 active MADs while the other plat-forms together were supported by less than 40,000 MADs. MAD segment data for 2011, however, suggests that Android will rapidly close the gap and perhaps even take the lead spot in the near future.
6 Discussion
The continuously evolving structure of the mobile platform ecosystem (see Fig.1) has enormous strategic and eco-nomic implications for players in all mar-ket segments of the mobile industry. The rapid pace of market transformation as well as growing consumer demands have led to a closer collaboration of key mobile complementors as shown by the number of ties in Table4. MPPs play a particu-larly critical brokering role in the con-verging mobile industry since they en-able and drive the creation and deliv-ery of new applications and content (Ba-sole2009, p. 156). Indeed, a mobile plat-form has the ability to lower the diffi-culty threshold of bringing content and applications to market, thus benefiting all players in the mobile ecosystem.
The fundamental reason for the rapid transformation of value creation and de-livery in the mobile ecosystem has been the introduction of app stores which are tied to their respective platforms. App stores serve as electronic markets for dig-ital goods and enable ecosystem partici-pants to collaborate and offer their ser-vices for a particular platform. App stores tend to be the primary gateway for end-users to mobile applications and content. Consequently, platform app stores will play a critical role in the future develop-ment of the mobile business ecosystem.
With the app store concept, control over content and usage as well as over handling of payment processes for mo-bile data services no longer resides with MNOs but more with MPPs and to a cer-tain extent MDMs (Suarez et al. 2009, pp. 2–10). In the past, mobile data us-age was primarily driven through mo-bile portals of MNOs. However, as app stores have become more prolific, the role of MNOs changed. Although MNOs are trying to follow suit by offering their own app stores, they have yet to ex-perience any notable success (Distimo 2010b). Our structural investigation sup-ports this as evidenced by the less promi-nent, roles occupied by MNOs and the increasingly central positions of MPPs shown in Fig.1. Our analysis also shows the close ties between MPPs and MDMs, which over the years have led to extensive value co-creation between the two seg-ments.
With the emergence of multiple new platforms, however, the market has be-come increasingly fragmented with no real dominant standard. This “broken”
ecosystem generates a myriad of chal-lenges to e.g. MNOs, MDMs, and MADs. Possibly, it also poses a serious barrier to the growth of the entire mobile indus-try. Answers to questions such as: “What platform should developers develop for?” “What platform should MDM adopt?” and “Which platform provides MNOs the greatest increase in average revenue per user?” are of tremendous interest to all stakeholders. Similarly, users are of-ten faced with the difficult decision which mobile device/platform combination to choose. While the user may not ulti-mately think about what platform they are using, they do care what applications are available, how they can get them, how much they cost, and how integrated the overall process is. Platforms have enabled MNOs and MDMs to differentiate their products and service offerings concern-ing different roles and different customer segments. In the past, MPPs often tar-geted a specific user segment. iOS and Android devices, for example, first were primarily used by consumers, whereas Blackberry focused on business profes-sionals. Not surprisingly, the number of available applications per platform also differed (Table3). With the recent surge in the consumer segment and growing recognition of the enormous enterprise mobility opportunity, however, virtually all MPPs are targeting both consumer and enterprise markets, leading to a blur-ring of the traditional platform segment foci. The goal of MPPs is therefore to become the preferred platform through collaborations and partnerships with its key enabling segments, MADs, MDMs and MNOs. In our structural analysis this goal translates to MPPs aiming to gain a more prominent position in the mobile ecosystem.
A case in point is the introduction of Apple’s App Store in 2008. Other firms rapidly followed suit by offering simi-lar solutions. After just one year, virtu-ally all competitors had launched their own app store. However, platforms differ along several key technical and marketing characteristics, in particular its installed base, the number of apps, the number of active developers, the learning curve required for development, developer in-centives, and last but certainly not least important revenue potential and revenue models (Distimo2010a,2010b). As a re-sult, success has differed greatly across the different platforms. Recent data sug-gests that while the Apple App Store re-mains the largest app store, the Android
Abstract
Rahul C. Basole, Jürgen Karla
On the Evolution of Mobile
Platform Ecosystem Structure
and Strategy
Platforms have become a core fun-dament of many technology indus-tries. Platforms not only enable new products and services but have also been shown to influence strategies, shape business models, and even trans-form entire industries. Plattrans-forms play a particularly important role in the mo-bile ecosystem. The success of smart-phones has led to an intense battle of mobile platforms, each looking for ways to become the system of choice for mobile device manufacturers, mo-bile network operators, and momo-bile ap-plication developers. Drawing on theo-ries of platform markets, strategic net-works, and business ecosystems, this paper uses a visualization approach to study the evolving global interfirm structure and examines strategies used in the mobile platform ecosystem over the past five years. We identify impor-tant differences between mobile plat-form strategies and discuss their im-plications for both mobile ecosystem participants and the future of the app economy.
Keywords: Mobile platform, Ecosys-tem, Visualization, Business model, Strategy, App economy
Market is the relatively fastest growing (Constantinou et al.2010, p. 12, Table2) which in turn supports our observation that Android appears to have the largest momentum. Android’s growing promi-nence is evident in Fig.1e. At the same time, the data presents only a proxy for the preferences and behavior of MADs. Indeed, iOS and Android are at the top of the list (Schwarzhoff2010, p. 3).
Due to the proliferation of platforms and the popularity of mobile applica-tions, people have begun to refer to this phenomenon as the “app economy” (Jef-fries 2009; MacMillan et al. 2009; Ed-wards2009). Indeed, with the rapid in-crease of people using mobile applica-tions for everyday life as well as enter-prise activities (Basole2008, pp. 3), a cor-responding development in supply and demand of mobile applications and ser-vices has been observed (Morgan Stan-ley Research2009, pp. 133–134). In turn, this has led to many new opportunities for both MADs and content providers. Both segments have benefited from the platform concept given that in the past they only had very limited access to cus-tomers and mobile devices. The advent of mobile platforms eliminated this bar-rier. MPPs, on the other hand, utilized long tail effects (Anderson2006, p. 53) to drive their platforms. The integration of mobile applications and mobile plat-forms therefore resulted in tremendous success for MPPs.
7 Summary and Outlook
Platforms have become a core feature of many emerging business models and are particularly important in the mobile industry. The success of a mobile plat-form is inextricably linked to its ecosys-tem. This study used a structural analy-sis and visualization lens to explore the interfirm relations in the mobile busi-ness sector with a focus on four key market segments, namely mobile de-vice manufacturers (MDM), mobile net-work operators (MNO), mobile applica-tion developers (MAD) and mobile plat-form providers (MPP). In doing so, this study provides an important first step to-wards understanding the structure and dynamics of interfirm relationships in an emerging and rapidly changing do-main, and makes several important con-tributions. First, the visual approach pre-sented in this study provides insights into
the structural evolution of interfirm rela-tions. Second, it provides a comparison of incumbent and emerging platforms’ competitive positions. Lastly, it identi-fies structural configurations that explain business strategies.
As any exploratory research, this study has some limitations. The accuracy of the visualization depends largely on the qual-ity of the underlying data. While every precaution was taken to validate the com-pleteness and accuracy of the data, it is possible that some firms and relations were not captured. At the same time, we also acknowledge that new platforms or platform versions will periodically emerge. For example, Microsoft recently released Windows Phone 7; unquestion-ably, the capabilities of this platform will alter the mobile platform landscape. Ad-ditionally, the recently shaped partner-ship between Nokia and Microsoft will also help to shift the prominence of both companies within the ecosystem. Our study also did not capture all rel-evant segments that may influence mo-bile platforms, such as momo-bile payment providers, for example. This simplifica-tion may have biased our results. Each of these limitations, however, represents an exciting area for future research.
Our study provides several avenues for future research. Visualization of busi-ness ecosystems is an area with tremen-dous research potential for the infor-mation systems, technology management and innovation research community. Fu-ture studies could include the compari-son of different configurations of tech-nology alliances and their impact on firm performance and innovation. An eco-nomic discussion of platform openness also seems promising. Similarly, visual-ization may help discover what struc-tures and behaviors facilitate or inhibit growth of the platform ecosystems. An-other opportunity for future research in-cludes an examination of the role of mo-bile application developers in the momo-bile ecosystem. With very little standardiza-tion across platforms, developers must custom code their applications for use on multiple platforms. This is both cost and resource intensive and increases time-to-market for applications.
Acknowledgements
The authors would like to thank the ed-itors and four anonymous reviewers for their helpful comments and feedback.
The authors would also like to thank Vin-cent Hoogsteder and Gert Jan Spriensma of Distimo B. V. for their insights on app store evolution and providing access to detailed data.
References
Abello J, Koutsofios E, Gansner E, North S (1999) Large networks present visualiza-tion challenges. ACM SIGGRAPH Computer Graphics 33:13–15
Ahuja G (2000) Collaboration networks, struc-tural holes, and innovation: a longitudi-nal study. Administrative Science Quarterly 45(3):425–455
Anderson C (2006) The long tail: why the fu-ture of business is selling less of more. Hy-perion, New York
Armstrong M (2006) Competition in two-sided markets. The Rand Journal of Eco-nomics 37:668–691
Barnes SJ (2002) The mobile commerce value chain: analysis and future developments. International Journal of Information Man-agement 22(2):91–108
Basole RC (2008) Enterprise mobility: appli-cations, technologies, and strategies. IOS, Amsterdam
Basole RC (2009) Visualization of interfirm relations in a converging mobile ecosys-tem. Journal of Information Technology 24(2):144–159
Basole RC, Rouse WB (2008) Complexity of service value networks: conceptualization and empirical investigation. IBM Systems Journal 47(1):53–70
Basole RC, Hu M, Patel P, Stasko J (2010) Vi-sualizing converging business ecosystems for competitive intelligence. In: Conference on Information Visualization, IEEE, Salt Lake City, pp 1–3
Batagelj V, Mrvar A (1998) Pajek – program for large network analysis. Connections 21(2):47–57
Becker RA, Eick SG, Wilks AR (1995) Visualizing network data. IEEE Transactions on Visual-ization and Computer Graphics 1:16–21 Brousseau E, Penard T (2007) The economics
of digital business models: a framework for analyzing the economics of platforms. Re-view of Network Economics 6(2):81–114 Calem RE (2010) Battle of the handset
operat-ing systems. Vision, May/June: 18–21 Chesbrough HW, Appleyard MM (2007) Open
innovation and strategy. California Man-agement Review 50(1):57–76
Constantinou A, Camilleri E, Kapetanakis M (2010) Mobile developer economics 2010 and beyond. VisionMobile, London De La Vergne HJ, Milanesi C, Cozza R, Gupta
A, Lu CK, Nguyen TH, Zimmermann A (2010) Competitive landscape: mobile de-vices, worldwide, 2Q10. Gartner, Stamford Di Battista G, Eades P, Tamassia R, Tollis IG
(1999) Graph drawing: algorithms for the visualization of graphs. Prentice Hall, Upper Saddle River
Distimo (2010a) App stores – overview.http:// www.distimo.com/appstores. Accessed 2010-08-10
Distimo (2010b) Report – June 2010.http:// www.distimo.com/uploads/reports/ Distimo%20Report%20-%20June%202010. pdf. Accessed 2010-08-27
Distimo (2011) App store characteristics 2008–2011. Custom report (2011-05-24)
Dittrich K, Duysters G (2007) Networking as a means to strategy change: the case of open innovation in mobile telephony. Jour-nal of Product Innovation Management 24(6):510–521
Dyer JH, Singh H (1998) The relational view: cooperative strategy and sources of interorganizational competitive advan-tage. Academy of Management Review 23(4):660–679
Economides N, Katsamakas E (2006) Two-sided competition of proprietary vs. open source technology platforms and the impli-cations for the software industry. Manage-ment Science 52:1057–1071
Edwards C (2009) iMgonnagetrich. Engineer-ing & Technology 4(16):70–71
Eick SG (1996) Aspects of network visualiza-tion. IEEE Computer Graphics and Applica-tions 16(2):69–71
Eisenhardt KM, Schoonhoven CB (1996) Resource-based view of strategic alliance formation: strategic and social effects in entrepreneurial firms. Organization Science 7(2):136–150
Eisenmann TR (2008) Managing proprietary and shared platforms. California Manage-ment Review 50(4):31–53
Evans DS, Hagiu A, Schmalensee R (2006) Invisible engines: how software platforms drive innovation and transform industries. MIT Press, Boston
Fruchterman TMJ, Reingold EM (1991) Graph drawing by force-directed placement. Soft-ware, Practice & Experience 21(11):1129– 1164
Galaskiewicz J, Wasserman S (1989) Mimetic and normative processes within an interor-ganizational field: an empirical test. Admin-istrative Science Quarterly 34(3):454–479 Gawer A, Cusumano M (2002) Platform
lead-ership: how Intel, Microsoft, and Cisco drive industry innovation. Harvard Busi-ness School Press, Boston
Gawer A, Henderson R (2007) Platform owner entry and innovation in complementary markets: evidence from Intel. Journal of Economics & Management Strategy 16(1):1–34
Gulati R (1998) Alliances and networks. Strate-gic Management Journal 19(4):293–317 Gulati R, Gargiulo M (1999) Where do
interor-ganizational networks come from? Ameri-can Journal of Sociology 104(5):1439–1493 Gulati R, Nohria N, Zaheer A (2000) Strate-gic networks. StrateStrate-gic Management Jour-nal 21:203–215
Gnyawali DR, Madhavan R (2001) Coopera-tive networks and competiCoopera-tive dynamics: a structural embeddedness perspective. Academy of Management Review 26:431– 445
Herman I, Melancon G, Marshall MS (2000) Graph visualization and navigation in infor-mation visualization: a survey. IEEE Trans-actions on Visualization and Computer Graphics 6(1):24–43
Iansiti M, Levien R (2004a) The keystone ad-vantage: what new dynamics of business ecosystems mean for strategy, innovation, and sustainability. Harvard Business School Press, Boston
Iansiti M, Levien R (2004b) Strategy as Ecol-ogy. Harvard Business Review 82(3):68–78 Iyer B, Lee CH, Venkatraman N (2006)
Man-aging in a ‘small world ecosystem’: lessons from the software sector. California Man-agement Review 48(3):28–47
Iyer B, Chi-Hyon L, Venkatraman N, Vesset D (2007) Monitoring platform emergence: guidelines from software networks. CAIS 19:1–13
Jeffries S (2009) The App economy. http:// www.guardian.co.uk/technology/2009/jul/ 29/iphone-apps. Accessed 2010-07-16 Kamada T, Kawai S (1989) An algorithm for
drawing general undirected graphs. Infor-mation Processing Letters 31:7–15 Keller R, Eckert CM, Clarkson PJ (2006)
Ma-trices or node-link diagrams: which visual representation is better for visualising con-nectivity models? Information Visualization 5(1):62–76
Koka BR, Prescott JE (2008) Designing alliance networks: the influence of network posi-tion, environmental change, and strategy on firm performance. Strategic Manage-ment Journal 29(6):639–661
Lee CH, Venkatraman N, Tanriverdi H, Iyer B (2010) Complementarity-based hypercom-petition in the software industry: theory and empirical test, 1990–2002. Strategic Management Journal 31:1431–1456 Li F, Whalley J (2002) Deconstruction of the
telecommunications industry: from value chains to value networks. Telecommunica-tions Policy 26:451–472
MacMillan D, Burrows P, Ante SE (2009) In-side the app economy. Business Week 4153:347–357
Maitland CF, Bauer JM, Westerveld R (2002) The European market for mobile data: evolving value chains and industry struc-tures. Telecommunications Policy 26(9– 10):485–504
Milanesi C, Cozza R, Zimmermann A, De La Vergne HJ, Nguyen TH, Gupta A, Lu CK (2009) Competitive landscape: mobile de-vices, worldwide, 3Q09. Gartner, Stamford Moody J, McFarland D, Bender-deMoll S
(2005) Dynamic network visualization. American Journal of Sociology 110(4): 1206–1241
Moore JF (1993) Predators and prey: a new ecology of competition. Harvard Business Review 71(3):75–86
Moore JF (1996) The death of competition: leadership and strategy in the age of busi-ness ecosystems. Harper Collins, New York Morgan Stanley Research (2009) The mobile
Internet report. Morgan Stanley, New York Nielsen (2010) U.S. smartphone battle heats
up: which is the “most desired” op-erating system? http://blog.nielsen.com/ nielsenwire/online_mobile/us-smartphone-battle-heats-up/. Accessed 2011-05-19 Nohria N, Garcia-Pont C (1991) Global
strate-gic linkages and industry structure. Strate-gic Management Journal 12(1):105–124 Oliver C (1990) Determinants of
interorgani-zational relationships: integration and fu-ture directions. Academy of Management Review 15:241–265
Parker G, Alstyne MV (2008) Managing plat-form ecosystems. In: Twenty ninth interna-tional conference on information systems. AIS, Paris, pp 1–13
Parton J, Kapetanakis M, Camilleri E, Con-stantinou A (2011) Developer economics 2011. VisonMobile, London
Peppard J, Rylander A (2006) From value chain to value network. European Manage-ment Journal 24(2):128–141
Provan KG, Fish A, Sydow J (2007) Interorga-nizational networks at the network level: a review of the empirical literature on whole networks. Journal of Management 33(3):479–516
Reuver MD, Bouwman H, Haaker T (2009) Mo-bile business models: organizational and financial design issues that matter. Elec-tronic Markets 19(1):3–13
Rochet JC, Tirole J (2003) Platform competi-tion in two-sided markets. Journal of the
European Economic Association 1(4):990– 1029
Rosenkopf L, Padula G (2008) Investigating the microstructure of network evolution: alliance formation in the mobile commu-nications industry. Organization Science 19(5):1–19
Rosenkopf L, Schilling M (2007) Comparing al-liance network structure across industries: observations and explanations. Strategic Entrepreneurship Journal 1:191–209 Schilling MA, Phelps CC (2007) Interfirm
col-laboration networks: the impact of large-scale network structure on firm innovation. Management Science 53(7):1113–1126
Schwarzhoff S (2010) Q2 mobile developer survey. Appcelerator, Mountain View Scott J (1991) Social network analysis: a
hand-book. Sage, London
Shneiderman B, Aris A (2006) Network vi-sualization by semantic substrates. IEEE Transactions on Visualization and Com-puter Graphics 12(5):733–740
Suarez F, Edelman B, Srinivasan A (2009) Symbian, Google & Apple in the mobile space. Harvard Business School Case 909-055, Boston
Tilson D, Lyytinen K (2006) The 3G tran-sition: changes in the US wireless in-dustry. Telecommunications Policy 30(10– 11):569–586
Tufte E (1983) The visual display of quantita-tive information. Graphics Press, Cheshire Venkatraman N, Lee CH (2004) Preferential
linkage and network evolution: a concep-tual model and empirical test in the U.S. video game sector. Academy of Manage-ment Journal 47(6):876–892
Ware C, Purchase H, Colpoy L, McGill M (2002) Cognitive measurements of graph aesthet-ics. Information Visualization 1(2):103 West J (2003) How open is open enough?
Melding proprietary and open source plat-form strategies. Research Policy 32(7): 1259–1285