arXiv:astro-ph/0406021v2 24 Jun 2004
Preprint typeset using LATEX style emulateapj v. 2/19/04
FAR INFRARED SOURCE COUNTS AT 70 AND 160µM INSPITZERDEEP SURVEYS
H. Dole1,2, E. Le Floc’h1, P. G. P´erez-Gonz´alez1, C. Papovich1, E. Egami1, G. Lagache2, A.
Alonso-Herrero1, C. W. Engelbracht1, K. D. Gordon1, D. C. Hines1,3, O. Krause1, K. A. Misselt1, J. E.
Morrison1, G. H. Rieke1, M. J. Rieke1, J. R. Rigby1, E. T. Young1, L. Bai1, M. Blaylock1, G. Neugebauer1, C. A. Beichman4, D. T. Frayer5, J. R. Mould6, P. L. Richards7
Accepted for Publication; To appear in the ApJS Special Issue on Spitzer, September 2004
ABSTRACT
We derive galaxy source counts at 70 and 160µm using the Multiband Imaging Photometer for
Spitzer (MIPS) to map the Chandra Deep Field South (CDFS) and other fields. At 70 µm, our
observations extend upward about 2 orders of magnitude in flux density from a threshold of 15 mJy, and at 160 µm they extend about an order of magnitude upward from 50 mJy. The counts are consistent with previous observations on the bright end. Significant evolution is detected at the faint end of the counts in both bands, by factors of 2-3 over no-evolution models. This evolution agrees well with models that indicate most of the faint galaxies lie at redshifts between 0.7 and 0.9. The new
Spitzerdata already resolve about 23% of the cosmic far-infrared background at 70µm and about 7% at 160µm.
Subject headings: infrared: galaxies – galaxies: evolution – galaxies: statistics 1. INTRODUCTION
The cosmic infrared background (CIB), relic emission of the formation and evolution of the galaxies, peaks in the far-infrared (FIR) in the 60-200µm wavelength range (Puget et al. 1996; Hauser et al. 1998; Lagache et al. 1999; Gispert et al. 2000; Hauser & Dwek 2001). In the local universe only about a third of the extragalactic emission is released in the FIR (Soifer & Neugebauer 1991). However, the CIB FIR peak accounts for more than half of the total optical/infrared background, indi-cating strong evolution of galaxy properties toward high FIR output in the past. Characterizing the galaxies re-sponsible for most of the CIB is therefore an important goal of cosmological surveys. Galaxy counts (or number counts) provide a powerful tool to investigate the evolu-tion of the galaxies and their contribuevolu-tion to the CIB.
The cryogenic infrared space missions IRAS (In-frared Astronomical Satellite) and ISO (Infrared Space Observatory) (Genzel & Cesarsky 2000; Dole 2003, for reviews) provided important data on source counts at 60 µm (Hacking & Soifer 1991) and at 100 µm (Rowan-Robinson et al. 1986) , and more recently at 90 µm (Kawara et al. 1998; Efstathiou et al. 2000; Juvela et al. 2000; Linden-Vornle et al. 2000; Matsuhara et al. 2000; Rodighiero et al. 2003; Kawara et al. 2004) and 170 µm (Kawara et al. 1998; Puget et al. 1999; Matsuhara et al. 2000; Dole et al. 2001; Kawara et al. 2004). Mid-infrared (MIR) obser-vation with ISOCAM at 15µm (Elbaz et al. 1999) are also of great interest since they are believed to resolve a significant fraction of the CIB into sources (Elbaz et al.
1
Steward Observatory, University of Arizona, 933 N Cherry Ave, Tucson, AZ 85721, USA
2
Institut d’Astrophysique Spatiale, bˆat 121, Universit´e Paris-Sud, F-91405 Orsay Cedex
3
Space Science Institute 4750 Walnut Street, Suite 205, Boulder, Colorado 80301
4
Michelson Science Center, CalTech, Pasadena, CA, USA
5
Spitzer Science Center, CalTech, Pasadena, CA, USA
6
NOAO, 950 N Cherry Ave, Tucson, AZ, 85719, USA
7
Dept. of Physics, 345 Birge Hall, Berkeley, CA, USA
2002). The Spitzer Space Telescope(Werner et al. 2004) provides the ability for much deeper and wider-area surveys from 3.6 to 160 µm. This paper investigates source counts at 70 and 160 µm from Spitzer. A companion paper addresses the MIR source counts at 24 µm (Papovich et al. 2004). The three-band source counts are the basis of new phenomenological models by Lagache et al. (2004).
2. OBSERVATIONS AND DATA REDUCTION Observations were carried out with the Multiband Imaging Photometer forSpitzer(Rieke et al. 2004) in the
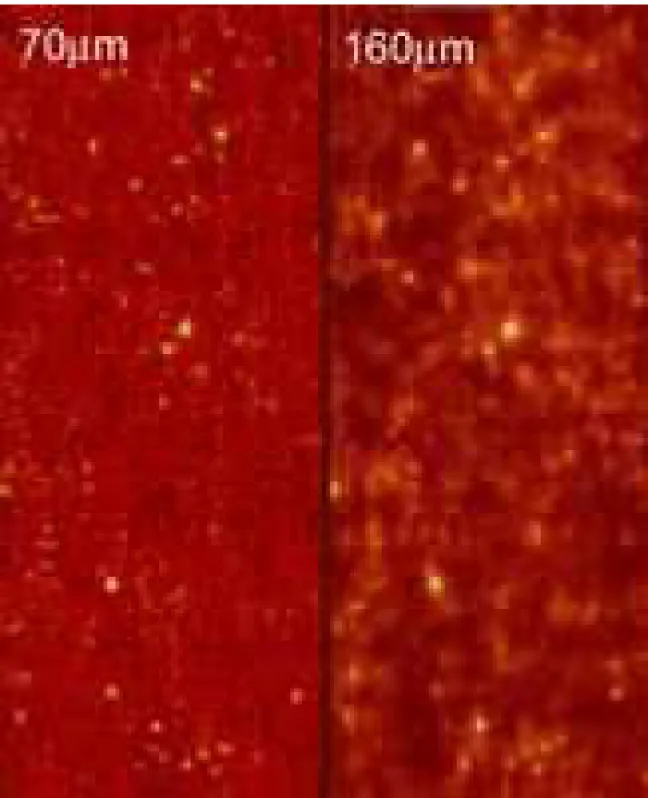
ChandraDeep Field South (CDFS) and the Bo¨otes field corresponding to the NOAO Deep Wide Field Survey NDWFS (Jannuzi & Dey 1999); We also used an engi-neering MIPS observation of the Marano field. The ob-servational mode (scan map) provides multiple sightings of each source, typically 10 and 60 at 70µm in the Bo¨otes and CDFS, respectively. However, at 160 µm, the num-ber of sightings is only typically 2 in Bo¨otes and 12 in CDFS. See Table 1 and Papovich et al. (2004) for details. The data were reduced with the Data Analysis Tool (Gordon et al. 2004), from the raw data (ramps) to the final coadded mosaics. The illumination corrections were derived from the data themselves. At 70 µm, the data have been median-filtered in the time domain before mo-saicking. Note that data from Ge:Ga detectors are al-ways challenging to process; but with MIPS, most of the difficulties are overcome with frequent calibrations (stimulator flashes), that track the responsivity varia-tions. Nevertheless, the noise properties at faint fluxes are still being investigated at both 70 and 160 µm. In this work, we will adopt conservative detection limits. A future paper will address extracting the ultimate sensi-tivity from these data. Sample images in the CDFS are shown in Figure 1.
3. PHOTOMETRY & CATALOGS
To control the sample and the selection function, we accepted source detections only where the redundancy
TABLE 1 Log of Observations Field MIPS 70µm 160µm Name AOTb Area tint c
Scutd Area tint
c Scutd a [deg2 ] [s] [mJy] [deg2 ] [s] [mJy]
Bo¨otes med. 8.75 40 80 7.70 8 · · · e
Marano slow 0.42 100 25 0.31 20 50 CDFS slow 0.67 600 15 0.54 120 50
a
see Papovich et al. (2004) for details on fields
b
scan map mode
c
per sky pixel
d
flux density at which catalog was cut
e
field data not used at 160µm
was high (typically 80% or more of the mean weight), avoiding the edges and the noisiest areas of the images. The resulting positions were fed to DAOPHOT (Stetson 1987) in IRAF8 for PSF fitting. We checked that the residual maps were indeed free of sources.
At 70µm the photometric calibration is derived from many observation campaigns, and its uncertainty is con-servatively estimated at the order of 20%. We use only detections at 15 mJy and brighter in the CDFS, 25 mJy and brighter in Marano, and 80 mJy and brighter in the Bo¨otes field. These flux levels are determined using the sharp decrease in the counts due to the incompleteness effect. At 160 µm, the calibration is based on a combi-nation of observations of standard stars, asteroids, and comparisons with measurements with other FIR missions (ISO, COBE, and modeling including IRAS measure-ments). It is also estimated to be accurate to about 20%. We have included in our counts only objects of 50mJy and brighter in the CDFS, and Marano (levels determined using incompleteness as at 70µm). Because of the low redundancy level of the 160 µm data in the Bo¨otes field, we postpone using it for a later paper.
Catalogs were produced separately at each wavelength; surveys at each wavelength are thus unbiased. Detected FIR sources in the CDFS sort as follows. For sources selected at 70 µm: 92% have a 24 µm ID; 54% have a 160µm ID (same with 24 and 160). For sources selected at 160µm: 98% have a 24µm ID; 43% have a 70µm ID (same with 24 and 70).
4. SOURCE COUNTS
At 70µm, 131 sources were detected down to 15 mJy in the CDFS, 55 sources down to 25 mJy in Marano, and 117 down to 80 mJy in the Bo¨otes. At 160µm, down to 50 mJy, 123 sources were detected in the CDFS, and 89 sources in Marano. The source density corresponds to about 150 beams per source at 70µm and 15 at 160µm, using the definition of Helou & Beichman (1990).
Source counts are given in integral form (Figure 2a and 3a) and differential form, divided by the Euclidean component (Figure 2b and 3b) at 70 and 160µm, respec-tively. Notice that we did not correct for incompleteness. Error bars on counts are 1σ Poisson uncertainty. Bins
8
IRAF is distributed by the National Optical Astronomy Ob-servatories, which are operated by the Association of Universities for Research in Astronomy, Inc., under the cooperative agreement with the National Science Foundation
with less than four sources have not been displayed for clarity, since their significance is low, with uncertainties of 50% or higher. Also, photometric uncertainty have been displayed at high flux only. In order to visualize the contribution from each field, source counts have not been merged and have been overplotted. One should keep in mind that MIPS source counts will eventually go deeper and will be corrected for incompleteness.
The observed fields nicely complement each other in terms of area and depth. This allows us to probe a flux range of almost 2 orders of magnitude at 70 µm. One order of magnitude is covered at 160 µm. It is possible to check consistency and the cosmic variance in the com-mon flux density range. At 70 µm, in the range 25 to 100 mJy where three fields overlap in flux density, the differential counts are almost consistent within the er-ror bars. At 160 µm, in the range 100 to 300 mJy, the differential counts are consistent within the error bars. At both wavelengths, number counts in CDFS appear consistently lower than in Marano.
5. DISCUSSION
5.1. 70 µm
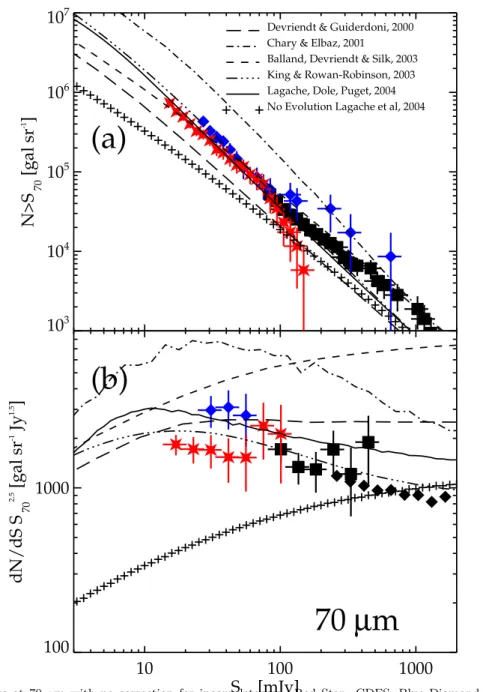
The MIPS 70µm counts show a great consistency with the IRAS 60 µm counts of Lonsdale et al. (1990) con-verted at 70µm usingν60S60=ν70S70.
A selection of recent models is shown in Figure 2, in-cluding a non-evolution scenario. The most striking re-sult is the strong excess of MIPS 70µm sources compared to the non-evolution model: a factor of 3 at around 20-30 mJy. Strong evolution had been reported previously at 60 and 90 µm, and these data provide unambiguous confirmation.
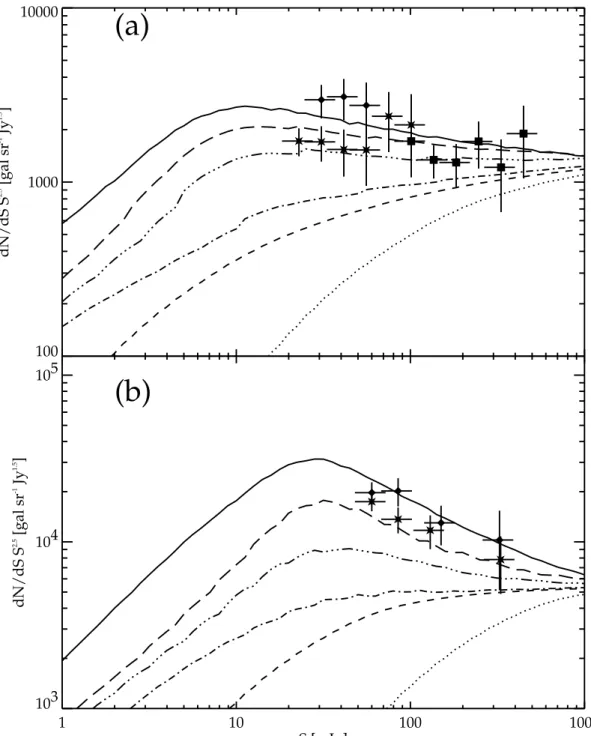
Two models lie close to the data: King & Rowan-Robinson (2003) and Lagache et al. (2003, 2004). These models, developed to fit observables mostly from IRAS, ISO and SCUBA surveys as well as the CIB spectral energy distribution (SED), are based on a strong evolution of luminous (and ultra-luminous) infrared galaxies (LIRG and ULIRG). The latter model predicts a peak in the redshift distributions of resolved sources at 70 µm near z ∼ 0.7 (Dole et al. 2003). Figure 4a shows the galaxy contribution to the differential counts, as a function of redshift, from the Lagache et al. (2004) model. Between ∼5 and ∼100 mJy, sources at 0.7≤z≤0.9 contribute the most to the counts. At brighter fluxes (reached by IRAS andISO), contributions from local galaxies are more important.
The source counts integrated at 70µm correspond to a brightness of 0.022 MJy/sr or 0.95 nW/m2/sr. The value of the CIB at this wavelength is not known accurately owing to contamination by zodiacal light. If we use the CIB value from the model of Lagache et al. (2004), the MIPS counts show that at 70µm about 23% of the 70µm CIB is already resolved.
5.2. 160 µm
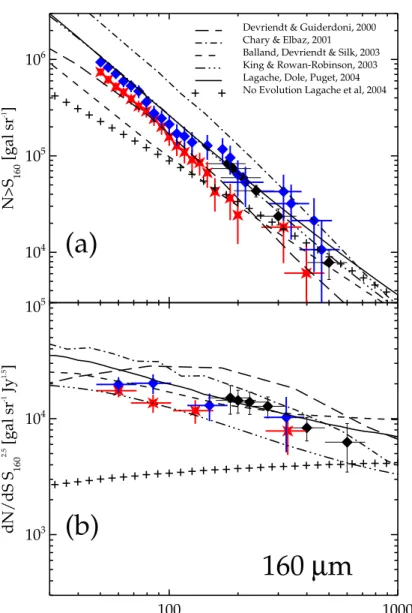
At 160 µm, the comparison with the ISO FIRBACK 170µm survey (Dole et al. 2001) shows that the counts are consistent and within the error bars in the whole common range, 180-300 mJy. Other ISO observations (Matsuhara et al. 2000; Kawara et al. 2004) agree as well.
Figure 3 overplots the same models as at 70µm. The evolution detected at 170 µm is confirmed at 160 µm, down to fainter levels. At about 100 mJy, an excess of sources by more than a factor of 2 is observed com-pared to a non-evolution scenario. Interestingly, as for 70µm, the observed evolution is better fitted by the mod-els of Lagache et al. (2004) and King & Rowan-Robinson (2003). The observed slope also agrees with Mould (2003).
We have constrained the bright end of galaxy num-ber counts at 170µm by using data from the ISOPHOT Serendipity Survey (ISOSS). ISOSS provides a total sky coverage of 15% and is virtually complete at a flux den-sity level of S170µm = 50 Jy. Based on all optically
identified galaxies detected by ISOSS (Krause 2003; Stickel et al. 2004) we have derived an integral number density ofn(S170µm>50 Jy) = 14±3 gal.sr−
1galaxies at high Galactic latitudes. This point is perfectly matched by the model of Lagache et al. (2003, 2004).
The most striking result of the models that fit the num-ber counts is the existence of two regimes in flux den-sity. In the ISOrange (fluxes above 200 mJy) most of the sources contributing to the counts are local; this is confirmed by observation (Patris et al. 2003). At fainter fluxes, between ∼10 and 200 mJy, the counts should be dominated by a population located at redshifts between 0.7 and 0.9.
The source counts integrated at 160 µm correspond to a brightness of 0.07 MJy/sr or 1.4 nW/m2/sr. The CIB value at this wavelength is 1 MJy/sr (Lagache et al. 2000); the MIPS counts show that at 160µm about 7% of the CIB is resolved. Since these counts are
prelimi-nary, are not corrected for incompleteness, and are sub-ject to cosmic variance, we anticipate that the actual value might be higher.
5.3. Concluding Remarks
The first MIPS far-infrared source counts, spanning about 2 orders of magnitude in flux density at 70 µm (and one at 160 µm), are consistent on the bright end with previous observations, and show on the faint end unambiguous evolution. Models predict that most of the sources lie at z ∼ 0.7 with a tail up to z ∼ 2 (Dole et al. 2003; Lagache et al. 2003, 2004). This work and companion papers about source counts at 24 µm (Papovich et al. 2004), about confusion at 24, 70 and 160µm (Dole et al. 2004), and about the interpretation of these new data from theSpitzercosmological surveys (Lagache et al. 2004), bring new light on the statistical properties of galaxies in an unexplored regime in flux density, and likely in a critical region of redshift space (up to redshifts z ∼ 2) in the FIR (Egami et al. 2004; Le Floc’h et al. 2004).
This work is based on observations made with the
Spitzer Space Telescope, which is operated by the Jet Propulsion Laboratory, California Institute of Technol-ogy under NASA contract 1407. Support for this work was provided by NASA through contract 960785 issued by JPL/Caltech. We warmly thank J. Cadien and J-L. Puget, and the IRS Team for providing us with the Bo¨otes data.
REFERENCES Balland, C, Devriendt, J. E. G, & Silk, J. 2003,MNRAS, 343:107.
Chary, R & Elbaz, D. 2001,ApJ, 556:562.
Devriendt, J. E. G & Guiderdoni, B. 2000,A&A, 363:851. Dole, H, Gispert, R, Lagache, et al. 2001,A&A, 372:364. Dole, H, Lagache, G, & Puget, J. L. 2003,ApJ, 585:617. Dole, H, Rieke, G. H, Lagache, G, et al. 2004,ApJS, this volume. Dole, H. ESA SP-511, 2003.
Efstathiou, A, Oliver, S, Rowan-Robinson, et al. 2000,MNRAS, 319:1169.
Egami, E. et al. 2004,ApJS, this volume.
Elbaz, D, Cesarsky, C. J, Fadda, D, et al. 1999,A&A, 351:L37. Elbaz, D, Cesarsky, C. J, Chanial, P, et al. Fadda, D, & Chary,
R. R. 2002,A&A, 384:848.
Genzel, R & Cesarsky, C. J. 2000,ARA&A, 38:761. Gispert, R, Lagache, G, & Puget, J. L. 2000,A&A, 360:1. Gordon, K. D, Rieke, G. H, Engelbracht, C. E, et al. 2004,PASP,
submitted.
Hacking, P. B & Soifer, B. T. 1991,ApJ, 367:L49. Hauser, M. G & Dwek, E. 2001,ARA&A, 37:249.
Hauser, M. G, Arendt, R. G, Kelsall, T, et al. 1998,ApJ, 508:25. Helou, G. & Beichman, C. A. ESA SP-314, 1990, 117
Jannuzi, B. T & Dey, A. In Weymann, R, etl. R, editors, ASP Conference Series v191, 1999, p111.
Juvela, M, Mattila, K, & Lemke, D. 2000,A&A, 360:813. Kawara, K, Sato, Y, Matsuhara, H, et al. 1998,A&A, 336:L9. Kawara, K, Matsuhara, H, Okuda, H, et al. 2004,A&A, 413:843. King, A. J & Rowan-Robinson, M. 2003,MNRAS, 339:260. Krause, O. 2003, PhD thesis
Lagache, G, Abergel, A, Boulanger, F, et al. 1999,A&A, 344:322. Lagache, G, Haffner, L. M, Reynolds, R. J, & Tufte, S. L. 2000,
A&A, 354:247.
Lagache, G, Dole, H, & Puget, J. L. 2003,MNRAS, 338:L555. Lagache, G, Dole, H, & Puget, J. L. et al. 2004,ApJS, this volume. Le Floc’h, E. et al. 2004,ApJS, this volume.
Linden-Vornle, M. J. D, Norgaard-Nielsen, H. U, Jorgensen, H. E, et al. 2000,A&A, 359:L51.
Lonsdale, C. J, Hacking, P. B, Conrow, T. P, & Rowan-Robinson, M. 1990,ApJ, 358:L60.
Lonsdale, C. J, Smith, H. E, Rowan-Robinson, et al. 2003,PASP, 115:L897.
Matsuhara H.,Kawara K., Sato Y. et al. 2000, A&A 361, 407 Mould, J. 2003,ApJ, 587:L93.
Papovich, C, Dole, H, Egami, E, et al. 2004, ApJS, this volume. Patris, J, Dennefeld, M, Lagache, G, & Dole, H. 2003, A&A,
412:349.
Puget, J. L, Abergel, A, Bernard, J. P, et al. 1996,A&A, 308:L5. Puget, J. L, Lagache, G, Clements, D. L, et al. 1999,A&A, 345:29. Rieke, G. H, Young, E. T, Engelbracht, C, et al. 2004,ApJS, this
volume.
Rodighiero, G, Lari, C, Franceschini, A, et al. 2003, MNRAS, 343:1155.
Rowan-Robinson, M, Walker, D, Chester, T, et al. J. 1986,
MNRAS, 219:273.
Soifer, B. T & Neugebauer, G. 1991,AJ, 101:354. Stetson, P. B. 1987,PASP, 99:191.
Stickel, M. et al. 2004, A&A, submitted,A&A
10
100
1000
S
70[mJy]
100
1000
dN/dS S
70 2.5[gal sr
-1Jy
1.5]
(b)
70
µ
m
10 100 100010
310
410
510
610
7N>S
70[gal sr
-1]
Devriendt & Guiderdoni, 2000 Chary & Elbaz, 2001
Balland, Devriendt & Silk, 2003 King & Rowan-Robinson, 2003 Lagache, Dole, Puget, 2004 No Evolution Lagache et al, 2004
(a)
Fig. 2.—Source Counts at 70µm with no correction for incompleteness. Red Star: CDFS; Blue Diamond: Marano; Black Square: Bo¨otes Field; Black Diamond: IRAS 60 µm counts from Lonsdale et al. (1990) converted at 70 µm. Top panel (a): Integral Source Counts. For clarity, photometric uncertainty is only shown forS70>100 mJy. Bottom panel (b): Differential Source Counts. Models are
also plotted: long dash: Devriendt & Guiderdoni (2000); dash-dot: Chary & Elbaz (2001); dash: Balland et al. (2003); dash-dot-dot-dot: King & Rowan-Robinson (2003); solid line: Lagache et al. (2004); plus: No Evolution Model.
100 1000 S 160 [mJy] 103 104 105 dN/dS S 160 2.5 [gal sr -1 Jy 1.5 ]
(b)
160
µ
m
100 1000 104 105 106 N>S 160 [gal sr -1 ]Devriendt & Guiderdoni, 2000 Chary & Elbaz, 2001 Balland, Devriendt & Silk, 2003 King & Rowan-Robinson, 2003 Lagache, Dole, Puget, 2004 No Evolution Lagache et al, 2004
(a)
Fig. 3.—Source counts at 160µm with no correction for incompleteness. Red Star: CDFS; Blue Diamond: Marano field; Black Diamond: ISO FIRBACK 170µm counts from Dole et al. (2001). Top panel (a): Integral Source counts. For clarity, photometric uncertainty is only shown forS160>200 mJy. Lower panel (b): Differential Source counts. Models are also plotted with the same symbols as Figure 2.
1 10 100 1000 S [mJy] 103 104 105 dN/dS S 2.5 [gal sr -1 Jy 1.5 ]
(b)
1 10 100 1000 100 1000 10000 dN/dS S 2.5 [gal sr -1 Jy 1.5 ](a)
Fig. 4.—Cumulative contributions to the Differential Source Counts at 70µm and 160 µm of galaxies, as a function of redshift, form the model of Lagache et al. (2004). Top panel (a): 70 µm. Bottom panel (b): 160 µm. Symbols are described in Figures 2 and 3. Galaxies contributing to the counts at Redshifts 0.1 (dot), 0.3 (dash), 0.7 (dot-dash), 0.9 (dot-dot-dot-dash) and 1.1 (long dash). The total contribution is the upper solid line.