ISSN: 2088-8708 1304
A Neuro-fuzzy Approach for Predicting Load Peak Profile
Abdellah Draidi, Djamel Labed
Laboratoire de genie électrique de Constantine, Departement of electrical engineering, University of Constantine 1, Algeria
Article Info ABSTRACT
Article history: Received Feb 13, 2015 Revised Jul 3, 2015 Accepted Jul 28, 2015
Load forecasting has many applications for power systems, including energy purchasing and generation, load switching, contract evaluation, and infrastructure development. Load forecasting is a complex mathematical process characterized by random data and a multitude of input variables.To solve load forecasting, two different approaches are used, the traditional and the intelligent one; intelligent systems have proved their efficiency in load forecasting domain. Adaptive neuro-fuzzy inference systems (ANFIS) are a combination of two intelligent techniques where we can get neural networks and fuzzy logic advantages simultaneously. In this paper, we will forecast night load peak of Algerian power system using multivariate input adaptive neuro-fuzzy inference system (ANFIS) introducing the effect of the temperature and type of the day as input variables.
Keyword: Load forecasting Neuro-fuzzy network Power systems Temperature
Type of the day Copyright © 2015 Institute of Advanced Engineering and Science.
All rights reserved.
Corresponding Author: Abdellah Draidi,
Laboratoire de genie électrique de Constantine, Departement of electrical engineering,
University of Constantine 1, Algeria. Email: draidi_abdellh@umc.edu.dz
1. INTRODUCTION
The Algerian economy is linked strongly to fossil energy market; as the prices of energy are fluctuating the necessity of developing new power consumption strategies rises, this could be achieved by optimizing the basic power system operations including: load flow, economic dispatch and load forecasting.
Short-term load forecasting is important for performing many power utility functions, including generator unit commitment, hydro-thermal coordination, short-term maintenance, fuel allocation, power interchange, transaction evaluation, as well as network analysis functions, security and load flow studies, contingency planning, load shedding, and load security strategies [1].
A variety of methods and ideas have been tried for load forecasting since many decades; varying from classical to artificial intelligence ones, those methods are discussed in the next title.
In load forecasting, the problematic resides in three aspects:
1) First, error, that means, to have a minimum difference between forecasted and real values; 2) second, execution time, especially with short term LF, where reducing simulation time is essential;
3) Third, external parameters affecting LF, such as weather variability and, in longer term, climate variability; the growth of population is one of those parameters alongside with the economic and social welfare of the population.
2. CONVENTIONAL AND ARTIFICIAL METHODS FOR LOAD FORECASTING 2.1.Traditional Approaches
2.1.1. Time Series Methods
These methods treat the load pattern as a time series signal with known seasonal, weekly and daily periodicities. These periodicities give a rough prediction of the load at the given season, day of the week and time of the day. The difference between the prediction and the actual load can be considered as a stochastic process (random signal). The techniques used for the analysis of this random signal are:
1) Kalman Filters Method; 2) Box Jenkins Method; 3) Regression Processes;
4) Spectral Expansion Technique. [2,3,4] 2.1.2. Regression Based methods
The general procedure for the regression approach is: 1) To select the proper and/or available weather variables; 2) Assume basic functional elements;
3) Find proper coefficients for the linear combination of the assumed basic functional elements. Since temperature is the most important information of all weather variables, it is used most commonly in the regression approach. However, additional variables such as humidity, wind velocity and cloud yields better results. The functional relationship between load and weather variables however is not stationary but depends on spatiotemporal elements.
2.2.Intelligent Systems
An intelligent system can be defined as a system that exhibits intelligence in capturing and processing information. Practically speaking, an intelligent system is the one, which employs artificial intelligence techniques to fulfill some or all of its computational requirements.
2.2.1. Artificial Neural Networks (ANN)
The ANN is capable to perform non-linear modeling and adaptation. It does not require functional relationship between load and weather variables in advance. The ANN can learnfrom experience, generalize from previous examples to newones, abstracts essential characteristics from input containing irrelevant data. The ANN gives more precise forecast as compared to conventional techniques [2].
2.2.2. Rule Based Expert Systems
An expert system is a computer program, which has the ability to act as a knowledge expert. This means this program can reason, explain and have its knowledge base expanded as new information becomes available to it. The load-forecast model can be built using the knowledge about the load forecast domain from an expert in the field. The knowledge engineer extracts this knowledge from the load frequency domain. This knowledge is represented as facts and rules using the first predicate logic to represent the facts and IF-THEN production rules. Some of the rules do not change over time, some changes very slowly; while others change continuously and hence they are updated time to time [5].
2.2.3. Fuzzy Systems
Fuzzy sets were introduced to represent and manipulate data and information that possesses non-statistical uncertainty. Fuzzy sets are a generalization of conventional set theory that was introduced as a new way to represent vagueness in the data. It introduces vagueness (with the aim of reducing complexity) by eliminating the sharp boundary between the members of the class from non members [6], [7]
In our paper, we will propose a hybrid method in the solution of load forecasting, which is a combination of neural networks and fuzzy logic, this method is called adaptive neurofuzzy inference systems (ANFIS) and it will be discussed later on the article. Our purpose is to reduce execution time and errors thus to have a faster and trustworthy forecast comparing with other methods used in the field.
3. ADAPTIVE NEURO-FUZZY INFERENCE SYSTEMS (ANFIS) 3.1.What is ANFIS?
Jang et al proposed ANFIS architecture in 1993 [8]. The acronym ANFIS derives its name from adaptive neuro-fuzzy inference system. Using a given input/output data set, ANFIS constructs a fuzzy inference system (FIS) whose membership function parameters are tuned (adjusted) using either a
backpropagation algorithm alone or in combination with a least squares type of method. This adjustment allows your fuzzy systems to learn from the data they are modeling. [9]
ANFIS is an adaptive network which allows the implementation of neural network topology, together with fuzzy logic [10], [11]. An ANFIS study compiles these two methods and utilizes the characteristics of both methods. Also, ANFIS gathers both the neural network and fuzzy logic, and is able to treat non linear and complex problems [12]. ANFIS is a class of adaptive multilayer feeding forward networks, which is functionally equivalent to a fuzzy inference system.
3.2.ANFIS Architecture
According to Jang and al [8], [13] the global structure of adaptive neuro-fuzzy systems is shown in Figure 1:
Figure 1. ANFIS system structure
Layer 1: Every node i in this layer is an adaptive node with a node function.
(1) is the membership grade of Ai and it specifies the degree to which the given input x (or y) satifies
the quantifier Ai .
or (2)
Where , , is the parameter set.
Layer 2: In this layer the output is the product of all the incoming signals:
, 1,2 (3) Each node output represents the firing strength of a rule.
Layer 3: The ith node calculates the ratio of the ith rule's firing strength to the sum of all rules' firing strengths:
, 1,2. (4) Outputs of this layer are called normalized firing strengthes.
Layer 4 Every node i in this layer is an adaptive node with a node function:
(5) {pi, qi, ri} is the parameter set of this node which are referred to as consequent parameters.
Layer 5: The nodes of this layer computes the overall output as the summation of all incoming singals:
∑ ∑∑ (6) 3.3.ANFIS Computational Complexity
Different layers characteristics are shown in Table 1:
Table 1. Layers characteristics
Layer # L-Type # Nodes # Param
L0 input n 0 L1 values (p•n) 3•(p•n)=|S1| L2 Rules pn 0 L3 normalize pn 0 L4 Lin.Funct pn (n+1)•pn=|S2| L5 sum 1 0
ANFIS uses two sets of parameters: S1 and S2:
1) S1 represents the fuzzy partitions used in the rules LHS
1 , , , , , , … , , , … , , , (7)
2) S2 represents the coefficients of the linear functions in the rules RHS
2 , , … , , … , , , … , (8)
ANFIS uses a two-pass learning cycle
1) Forward pass: S1 is fixed and S2 is computed using a Least Squared Error (LSE) algorithm (Off-line Learning).
2) Backward pass: S2 is fixed and S1 is computed using a gradient descent algorithm (usually Back-propagation) [14].
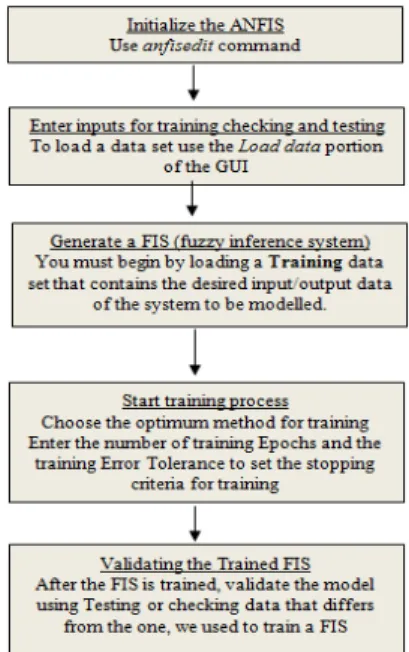
3.4.Basic Flow Diagram of Computations in ANFIS
The ANFIS Editor GUI (MATLAB) applies fuzzy inference techniques to data modeling; basic flow diagram of computations in ANFIS is given in Figure 2:
4. OVERVIEW ON THE ALGERIAN POWER SYSTEM LOAD PATTERN
The elaboration of the Algerian load forecasting is becoming increasingly difficult because of the uncertainties related to the factors used in its preparation, especially those linked to consumption habits changing. In Algeria, this change is due to an increasing sensitivity of the consumer to the temperature rise and consequently it is reflected throughout the changes on annual and daily load summer curves. The annual consumption peak, which historically has been reachedin the winter, moved to the summerin 2009, when the summer peak has exceeded the winter’s by 5.1% (Figure 3).
Figure 3. Historical evolution of maximum demand from 2000 to August 2011 [15]
The average specific consumption per low voltage customer has increased to 2623k Whin 2009. If the average consumption of Algerian homes has increased, it is interesting to note that this increase is driven mainly by south customers who represent just 10% of the total number of low voltage customers.
This peculiarity is explained by the massive use of air conditioning, given the special climate of south regions which is characterized by high temperatures during several months of the year (Figure 4). The average consumption of customers in the northern region is explained by population density. Over 52% of the low voltage customer is located north of the country.
Figure 4. Comparison between load curves of two days with maximum demand [16]
5. THE DATA SET
The data used for ANFIS learning, checking and testing is taken from:
1) SONELGAZ load curve history database [17] which contain daily load curves with day and night peaks.
2) Maximum temperature of In Saleh (region of Tamanraset) the hottest area in Algeria and minimum temperature of Setif the coldest area in Algeria, this gives us an average temperature of the whole country [18]
5.1.ANFIS Architecture
We have used for training
Inputs: [664x6] matrix, an example is given in Table 2.
Table 2. Sample of input matrix
Day Max Temp Min Temp Working day Friday Saturday Peak Generation
01/03/2010 31 6 1 0 0 6087 MW
13/05/2011 33 8 0 1 0 6045 MW
Figure 5 shows the ANFIS structure:
Figure 5. ANFIS architecture
1) Layer 1: contains the input matrix.
2) Layer 2: which calculates the membership value for premise parameters, here, we assign for membership functions for the first two inputs and two mf’s for the rest three inputs.
3) Layer 3: which calculate firing strength of the 128 rules. 4) Layer 4: which normalizes all firing strengths.
5) Layer 5: calculates the overall sum of the incoming signals, the output represents the load peak predicted by the model.
Figure 6 shows ANFIS output (peak generation forecasted represented by red crosses) versus input (real peak generation represented by blue circles). We can see from Figure 6 that ANFIS training is satisfactory, that means outputs are generally close to targets with some exceptions for some points.
5.2.Network Testing
We have used Marsh 2012 data to test the neural network; the result is shown in Figure 7.
Figure 7. Network testing using March 2012 data
6. CONCLUSION
We can deduce from results shown in Figure 6 and Figure 7 that our forecast using ANFIS was acceptable. To have more accurate and excellent forecasting we must use more input data set to have a good neural network training.
Our purpose is to implement artificial intelligence techniques in load forecasting especially for Algerian power grid. As weather and especially temperature represents the main parameter influencing Algerian consumption, the necessity of developing a model for peak forecasting rises. The other parameter taken into consideration is type of the day where we remarked three types of days; working days, Fridays that are real weekends and Saturdays that are for some Algerian a working days.
We have, successfully, introduced the effect of the temperature and type of the day as input matrix used in the process of training, so we have a fast and reliable load forecasting using ANFIS.
REFERENCES
[1] Abdel-Aal R. E, “Modeling, Forecasting Electric Daily Peak Loads Using Abductive Networks,” Elsevier, Oxford, united kingdom, Vol. 28, No. 2, pp. 133-141,2006.
[2] Chaturvedi D. K, Premdayal S. “Modified Neural and Neuro-fuzzy Approach for Short Term Load Forecasting,” 2nd International Conference on Power, Control and Embedded Systems, 2012.
[3] Mahalanabis A. K, Kothari D. P, Ahson S. I, “Computer Aided Power System Analysis and Control,” Tata McGraw Hill Publishing Company limited, NewDelhi, 1988.
[4] Box G. E, Jenkins G. M, “Time Series Analysis Forecasting and control,” Holden-Day, San Fransisco, 1976. [5] Moghram I, Rahman S, “Analysis and evaluation of five short-term load forecasting techniques,” IEEE
Transactionson Power Systems, Vol. 4, No. 4, pp. 1484-1491, 1989.
[6] Chen C. H. “Fuzzy logic and Neural Network Handbook,” Mc GrawHill computer Engg., 1996.
[7] Klis G. J, Folger T. A.“Fuzzy sets uncertainty and information. Prentice Hall of India private limited,” 1993. [8] Shing J, Jang R, “ANFIS: Adaptive Network-Based-Fuzzy Inference System,” IEEE transaction on systems, man
and cybernetics, Vol. 23, No. 3, 1993.
[9] “ANFIS and the ANFIS Editor GUI,” Matlab documentation center, MATLAB R2013a.
[10]Jang J. S. R, Sun C. T. “Neurofuzzy modeling and control,” Proc.IEEE83, Vol. 3, pp. 378–406, 1995. [11]Jang J. S. R, Sun C. T, Mizutani E, “Neurofuzzy and soft computing,” Prentice Hall, pp. 510-514, 1997. [12]Bunke H, Kandel A, “Neuro-fuzzy Pattern Recognition,” World Scientific Publishing, Singapore, 2000.
[13]Xu G, Wang Z, “Power System Load Flow Distribution Research based on Adaptive Neuro-Fuzzy Inference Systems,” IEEE, 2012.
[14]Bonissone P, “Adaptive Neural Fuzzy Inference Systems (ANFIS): Analysis and Applications,” 2002. [15]Equilibres, la lettre de la commission de régulation de l’électricité et du Gaz (CREG), No. 14, 2011. [16]Société nationale d’électricité et de gaz algérienne (SONELGAZ). Newsletter press, No. 09, 2012.
[17]Archive de courbes de charge quotidienne, Operateur de systeme electrique, http://www.ose.dz/courbes.php.

![Figure 4. Comparison between load curves of two days with maximum demand [16]](https://thumb-us.123doks.com/thumbv2/123dok_us/9934360.2486292/5.892.280.639.674.887/figure-comparison-load-curves-days-maximum-demand.webp)


