Zurich Open Repository and Archive University of Zurich Main Library Strickhofstrasse 39 CH-8057 Zurich www.zora.uzh.ch Year: 2018
How High Will It Be? Using Machine Learning Models to Predict Branch
Coverage in Automated Testing
Grano, Giovanni ; Titov, Timofey V ; Panichella, Sebastiano ; Gall, Harald
Abstract: Software testing is a crucial component in modern continuous integration development envi-ronment. Ideally, at every commit, all the system’s test cases should be executed and moreover, new test cases should be generated for the new code. This is especially true in the a Continuous Test Generation (CTG) environment, where the automatic generation of test cases is integrated into the continuous in-tegration pipeline. Furthermore, developers want to achieve a minimum level of coverage for every build of their systems. Since both executing all the test cases and generating new ones for all the classes at every commit is not feasible, they have to select which subset of classes has to be tested. In this context, knowing a priori the branch coverage that can be achieved with test data generation tools might gives some useful indications for answering such a question. In this paper, we take the first steps towards the definition of machine learning models to predict the branch coverage achieved by test data generation tools. We conduct a preliminary study considering well known code metrics as a features. Despite the simplicity of these features, our results show that using machine learning to predict branch coverage in automated testing is a viable and feasible option.
DOI: https://doi.org/10.1109/MALTESQUE.2018.8368454
Posted at the Zurich Open Repository and Archive, University of Zurich ZORA URL: https://doi.org/10.5167/uzh-150210
Conference or Workshop Item Published Version
Originally published at:
Grano, Giovanni; Titov, Timofey V; Panichella, Sebastiano; Gall, Harald (2018). How High Will It Be? Using Machine Learning Models to Predict Branch Coverage in Automated Testing. In: Workshop on Machine Learning Techniques for Software Quality Evaluation (MaLTeSQuE), Campobasso, Italy, 20 April 2018 - 20 April 2018, 19-24.
How High Will It Be?
Using Machine Learning Models to Predict Branch
Coverage in Automated Testing
Giovanni Grano
†, Timofey V. Titov
‡, Sebastiano Panichella
†, Harald C. Gall
† University of Zurich,Department of Informatics, Switzerland
†{lastname}@ifi.uzh.ch,‡[email protected]
Abstract—Software testing is a crucial component in modern continuous integration development environment. Ideally, at ev-ery commit, all the system’s test cases should be executed and moreover, new test cases should be generated for the new code. This is especially true in a Continuous Test Generation (CTG) environment, where the automatic generation of test cases is integrated into the continuous integration pipeline. Furthermore, developers want to achieve a minimum level of coverage for every build of their systems. Since both executing all the test cases and generating new ones for all the classes at every commit is not feasible, they have to select which subset of classes has to be tested. In this context, knowing a priori the branch coverage that can be achieved with test data generation tools might give some useful indications for answering such a question. In this paper, we take the first steps towards the definition of machine learning models to predict the branch coverage achieved by test data generation tools. We conduct a preliminary study considering well known code metrics as a features. Despite the simplicity of these features, our results show that using machine learning to predict branch coverage in automated testing is a viable and feasible option.
Index Terms—Machine Learning, Software Testing, Automated Software Testing
I. INTRODUCTION
Software testing is widely recognized as a crucial task in any software development process [8], estimated at being at least about half of the entire development cost [6], [21]. In last years, we witnessed a wider adoption ofcontinuous integration
(CI) practices, where new or changed code is integrated extremely frequently into the main codebase. Testing plays an important role in such a pipeline: in an ideal world, at every single commit of the day every system’s test case should be executed (regression testing). Moreover, additional test cases should be automatically generated for all the new code introduced into the main codebase [9]. This is especially true in a Continuous Test Generation (CTG) environment, where the generation of test cases comes directly integrated into the continuous integration cycle [9]. However, due to the time constraints between frequent commits, a complete regression testing is not feasible for large projects [40]. Furthermore, even
test suite augmentation [39], i.e., the automatic generation considering code changes and their effect on the previous codebase, is hardly doable due to the extensive amount of time needed to generate tests for just a single class.
In this context, since developers want to ensure a minimum level of branch coverage for every build, these computational constraints raise many different problems. For instance, they have to select and rank a subset of classes to test, or again, allocate a budget (i.e., the time) to devote for the generation per each class. Knowinga priorithe coverage achieved by test data generation tools might help answering such questions and smartly allocating the correspondent resources. As an example, in order to maximize the branch coverage on the entire system, we might want to prioritize the testing on the classes for which we can achieve a high coverage. Similarly, knowing that a critical component has a low predicted coverage, we might want to spend on it more budget with the aim to generate better (i.e., with higher coverage) tests.
In this paper we initially investigate the possibility to rely on
machine learning(ML) models to predict the branch coverage achieved by test data generation tools. To take the first steps into this direction, we consider two different aspects: (i) the features to use to represent the complexity of a class under test (CUT) and (ii) the better suited algorithm for the problem we aim to solve. Regarding the features to employ, we investigate well known code metrics such as the Chidamber and Kemerer (CK) ones [11]. Given the exploratory nature of this study, we select at first glance these metrics since their are (i) easy to compute and (ii) popular in software evolution and maintenance literature. About the latter aspect, to have a wider overview and select the best approach for the domain, we investigate 3 different ML algorithms coming from three distinct families. Our initial results report a discrete accuracy in the prediction of branch coverage during automated testing. In the light of these initial findings, we believe that (ii) the introduction of more advanced features, (i) a proper feature selection analysis and (iii) experimenting different algorithms, might further improve such preliminary results.
II. EMPIRICALSTUDYDESIGN
The goal of the empirical study is to take the first steps towards the definition of machine learning models able to predict the coverage achieved by test data generation tools on a givenclass under test(CUT). In particular, we focus on EvoSuite [17] and Randoop [29], two of the most well-known
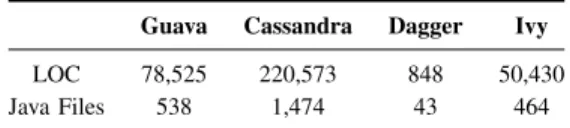
TABLE I
PROJECTS USED TO BUILD THEMLMODELS
Guava Cassandra Dagger Ivy LOC 78,525 220,573 848 50,430 Java Files 538 1,474 43 464
tool currently available. Formally, in this paper we investigate the following research questions:
RQ1. Which types of features can we leverage to train machine learning models to predict the branch coverage achieved by test data generation tools?
With the first research question, we aim to investigate which kind of features can we rely on in order to train machine learning models able to predict, with a certain degree of accuracy, the branch coverage that test data generation tools (EvoSuite and Randoop in our case) can achieve on given CUTs. Given the exploratory nature of this study, we chose to initially focus our investigation on (i) well established and (ii) simple to compute code metrics such as the Chidamber and Kemerer (CK) ones [11] (see Section II-B). Moreover, we trained and cross-validated three different machine learning approaches, coming from different families of algorithms, to have a first intuition about the goodness of the chosen features.
RQ2.To what extend can we predict the coverage achieved by test data generation tools?
Once established in RQ1 the best fitting algorithm for our
use case, we conduct an additional experiment with a further validation on a separate set composed by 3 open source system. We use a test set in oder to have a more fair estimation about how well the models have been trained. It is worth to notice that we trained and validated two separate models, one for EvoSuite and one for Randoop, to investigate eventual differences in the prediction performances between the two.
A. Context Selection
The context of this study is composed by 4 different open source projects: Apache Cassandra [16], Apache Ivy [3], Google Guava [18] and Google Dagger [19]. We selected those projects due to their different domain; moreover, the Apache-Commons is quite popular in software evolution and maintenance literature [5]. Apache Cassandra is a distributed database, Apache Ivy a build tool, Google Guava a set of core libraries while Google Dagger a dependency injector. Table I summarizes the Java classes and the LOC used from the above projects to train our ML models. With the same criteria, we further selected 3 different projects for the validation set used in RQ2: Joda-Time [24], Apache-Commons Math [14] and
Apache-Commons-Lang [13]. The first is a replacement for the Java date and time classes. The second one is a library of
TABLE II
PACKAGE-LEVEL FEATURES COMPUTED WITHJDEPEND
Name Description
TotalClasses The number of concrete and abstract classes (and inter-faces) in the package
Ca The number of other packages that depend upon classes within the package
Ce The number of other packages that the classes in the package depend upon
A The ratio of the number of abstract classes (and interfaces) in the analyzed package
I The ratio of afferent coupling (Ce) to total coupling (Ce+Ca), such thatI=Ce/Ce+Ca
D The perpendicular distance of a package from the idealized lineA+I= 1
mathematics and statistics operators, while the latter provides helper utilities for Java core classes.
B. Model Building
As explained, we train our models on a set of features designed primarily to capture the code complexity of CUTs. The first set of features come from JDEPEND[12] and captures information about the outer context layer of a CUT. Moreover, we rely on the well-established Chidamber and Kemerer (CK) and on Object-Oriented metrics (OO) such as depth of inheritance tree (DIT) and number of static invocations (NOSI) [11]. These metrics have been computed using an open source tool provided by Aniche [2]. To capture even more fine-grained details, we include the counts for 52 Java reserved keywords. Such a list includes words like synchronized, import or instanceof. Furthermore, we enclose in the model the budget allocated for the test case generation, i.e., the CPU time. We encode it like a categorical value and assuming the following values: 45, 90 and 180 seconds.
1) Package Level Features: Table II summarizes the package-level features computed with JDepend [2]. Originally, such features have been developed to represent an indication of the quality of a package. For instance, TotalClasses is a measure of the extensibility of a package. The features Ca
and Ce respectively are meant to capture the responsibility and independence of the package. In our application, both represent complexity indicators for the purpose of the coverage prediction. Another particular feature we took into account was the distance from the main sequence (D). It captures the closeness to an optimal package characteristic when the package isabstract and stable,i.e.,A= 1, I = 0or concrete and unstable,i.e.,A= 0, I= 1.
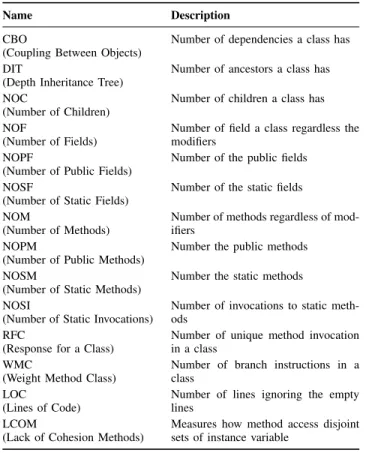
2) CK and OO Features: This set of features includes the widely adopted Chidamber and Kemerer (CK) metrics, such as WMC, DIT, NOT, CBO, RFC and LCOM [11]. It is worth to note that the CK tool [2] calculate these metrics directly from the source code using a parser. In addition, we included other specific Object Oriented features. Such a complete set, with the respective descriptions, can be observed in Table III.
TABLE III
CKANDOBJECT-ORIENTED FEATURE DESCRIPTIONS
Name Description
CBO
(Coupling Between Objects)
Number of dependencies a class has DIT
(Depth Inheritance Tree)
Number of ancestors a class has NOC
(Number of Children)
Number of children a class has NOF
(Number of Fields)
Number of field a class regardless the modifiers
NOPF
(Number of Public Fields)
Number of the public fields NOSF
(Number of Static Fields)
Number of the static fields NOM
(Number of Methods)
Number of methods regardless of mod-ifiers
NOPM
(Number of Public Methods)
Number the public methods NOSM
(Number of Static Methods)
Number the static methods NOSI
(Number of Static Invocations)
Number of invocations to static meth-ods
RFC
(Response for a Class)
Number of unique method invocation in a class
WMC
(Weight Method Class)
Number of branch instructions in a class
LOC
(Lines of Code)
Number of lines ignoring the empty lines
LCOM
(Lack of Cohesion Methods)
Measures how method access disjoint sets of instance variable
3) Java Reserved Keyword Features: In order to capture additional complexity in our model, we include the count of a set of reserved Java keywords (reported in our appendix [20]). Keywords have long been used in Information Retrieval as features [32]. However, to the best of our knowledge, they have not been used in previous research to capture complexity. Possibly, this is because these features are too fine-grained and do not allow the usage of complexity thresholds, like for instance the CK metrics [7]. It is also worth to underline that there is definitively an overlap for these keywords with some of the aforementioned metrics like, to cite an example, for the keywordsabstractorstatic. However, it is straightfor-ward to think about those keywords (e.g., synchronized, importandswitch) as code complexity indicators.
4) Feature Transformation: We log-transform the values of the used features to bring their magnitudes to comparable sizes. Then, we normalize them using z-score (or standard score) that indicates how many standard deviations a feature is from the mean; it is calculated with the formulaz= (X−µ)
σ whereX is the value of the feature,µis the population mean andσ is the standard deviation.
C. Model Training
In this section we present the 3 algorithms used in our empirical study. We consider Huber regression [22], Support Vector Regression [10] and Multi-layer Perceptron [28]. We relied on the implementation from the Python’s ScikitLearn
Library [31], being an open source framework widely used in both research and industry. To have a wider investigation, we picked them up from different algorithms’ families: a robust regression, a SVM and a neural network algorithm.
To train the models we run EvoSuite and Randoop on the test subject, using the achieved branch coverage to build a labelled dataset. The first step towards the algorithm selection was a grid search over a wide range of values for the involved parameters. To select them, we first defined a range for the hyper-parameters and then, for each set of them, we applied 3-fold cross validation. At the end, we selected the best combination on the average of the validation folds.
We measured the performances of the employed algorithms in term of Mean Absolute Error (MAE), formally defined as:
M AE=
Pn
i+1|yi−xi|
n
wherey is the predicted value,xare the observed values for the classiandnis the entire set of classes used in the training set. This value is easy to interpret since it is in the same unit of the target variable,i.e., branch coverage fraction.
In the following, we are going to briefly describe the algorithms we relied on for our evaluation. Moreover, we describe the choices for the correspondent hyper-parameters we used during the training.
Huber Regression [22] is a robust linear regression model designed to overcome some limitations of traditional paramet-ric and non-parametparamet-ric models. In particular, it is specifically tolerant to data containing outliers. Indeed, in case of outliers, least square estimation might be inefficient and biased. On the contrary, Huber Regression applies only linear loss to such observations, therefore softening the impact on the overall fit. The only parameter to optimize in this case is α, a regularization parameter that avoid the rescaling of the epsilon value when the y is under or over a certain factor [34]. We investigated the range of 2 to the power oflinspace(-30, 20, num = 15). It is worth to specify thatlinspace is a function that returns evenly spaces number over a specified interval. Therefore, in this particular case, we used 2 to the power of 15 linearly spaced values between -30 and 20. At the end, we found the bestα= 7,420for EvoSuite andα= 624.1 for Randoop.
Support Vector Regression (SVR) [10] is an application of Support Vector Machine algorithms, characterized by the usage of kernels and by the absence of local minima. The SVR implementation in Python’s Sciknit library we used is based on libcsv[10]. Amongst the various kernels, we chose aradial basis function kernel (rbf), which can be formally defined as exp(−γ||x−x′||2), where the parameterγis equal to 1/2σ2.
This approach basically learns non-linear patterns in the data by forming hyper-dimensional vectors from the data itself. Then, it evaluates how similar new observations are to the the ones seen during the training phase. The free parameters in this model are C and ǫ. C is a penalty parameter of the error term, while ǫ is the size within which no penalty is
associated in the training loss function with points predicted within a distance epsilon from the actual value [36]. Regarding C, just like Huber Regression, we used the range of 2 to the power of linspace(-30, 20, num = 15). On the other side, for the parameter ǫ, we considered the following initial parameters: 0.025, 0.05, 0.1, 0.2 and 0.4. At the end, the best hyper-parameters were, for both EvoSuite and Randoop, C= 4,416 andǫ= 0.025.
Multi-layer Perceptron (MLP) [35] is a particular class of feedforward neural network. Given a set for features X = x1, x2, ..., xm and a target y, it learns a non-linear function
f(·) : Rm → Ro where m is the dimension of the input and o is the one of the output. It uses backpropagation for training and it differs from a linear perceptron for its multiple layers (at least three layers of nodes) and for the the non-linear activation. We opted for the MLP algorithm since its different nature compared to two approaches mentioned above. Moreover, despite they are harder to tune, neural networks offer usually good performances and are particularly fitted for finding non-linear interactions between features [28]. It is easy to notice how such a characteristic is desirable for the kind of data in our domain. Also in this case we performed a grid search to look for the best hyper-parameters. For the MLP we had to setα(alpha),i.e., the regularization term parameter, as well the number of units in a layer and the number of layers in the network. We looked for α again in the range of 2 to the power of linspace(-30, 20, num = 15). About the number of units in a single layer, we investigated range of 0.5x,1x,2xand3xtimes the total number of features in out model (i.e., 73). About the number of layers, we took into account the values of 1, 3, 5 and 9. At the end, the best selected hyper-parameters were α= 0.3715and a neural network configuration of (5, 219), where the first value is the number of layer and the second one is the number of units per layer, for EvoSuite. On the other side, for Randoop we opted for α= 0.002629and a configuration of (9, 73).
III. RESULTS ANDDISCUSSIONS
In this section we report and sum up the results of the presented research questions, discussing the main findings.
A. RQ1 - Features for Coverage Prediction
Here the goal is to understand which features can be used to train a model able to predict the coverage achieved by automated tools. At first glance, being this an exploratory study, we experiment simple and well-known code metrics (see Section II-B). At the same time, we compare different algorithms,i.e., Huber Regression, Support Vector Regression and Multi-layer Perceptron (see Section II-C), in order to define the well-suited one.
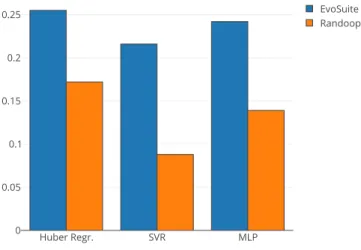
To have an intuition about the goodness of both the features and the approaches selected, we perform 10-cross fold vali-dation on the 4 project presented in II-A. Figure 1 shows a grouped bar plot reporting the correspondent MAEs, both for EvoSuite and Randoop, for the three algorithms we investigate. In a similar way, Table IV reports the same results, enriched
Fig. 1. Box Plot reporting the MAE of the 3 employed machine learning algorithms on the training data for the obtained best hyper-parameters
TABLE IV
MAES FOR THE10-CROSS FOLD VALIDATION ON THE TRAINING SET
Huber R. SVR MLP Tool’s average EvoSuite 0.255 0.216 0.242 0.238 Randoop 0.172 0.088 0.139 0.132 Algorithm’s average 0.213 0.152 0.191 0.185
with both the averages per tool and per algorithm. Generally, we observe that non-linear algorithms, i.e., SVR and MLP, have better results than Huber Regression. Indeed, this is a somehow expected result. The average of the MAE for the three algorithms trained with EvoSuite is about 0.238, while the same value for Randoop is about 0.132. We argue that such results are accurate enough for the initial level of investigation we carry out in this paper. Moreover, they confirm the viability for traditional code metrics to be used as a features to train a predictive model. We can also see that the Support Vector Regression is the approach that performs better both for EvoSuite (0.216) and Randoop (0.088).
Result 1. Despite their simplicity, traditional code metrics give discrete cross-validation result. SVR is the most ac-curate algorithm amongst the considered ones.
B. RQ2 - Predicting the Branch Coverage
For this RQ, we rely on the SVR algorithm we found to the best performing ones (from RQ1) to predict the branch
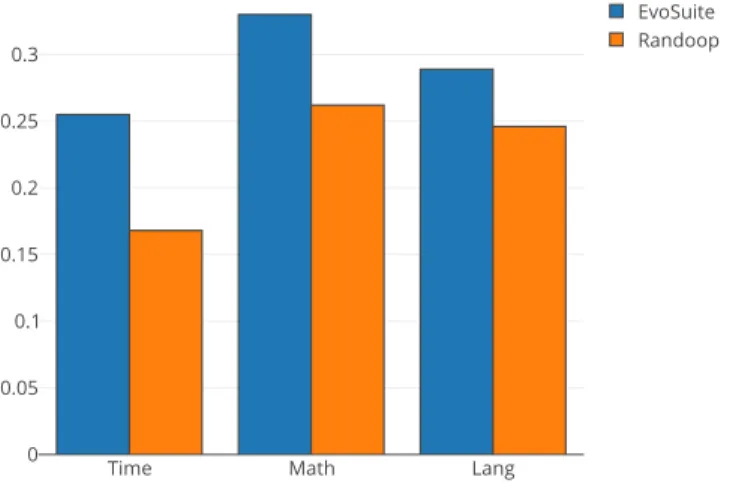
coverage on the validation set (see Section II-A). It is worth to notice that we reuse the same SVR model built for the previous RQ. Figure 2 shows, for all the 3 projects, the MAEs respectively for EvoSuite and Randoop. Similarly as we did for RQ1, to ease the results analysis, we report such data
in a tabular form, with the average per project and per tool. We observe that the results for the validation set are slightly worse (especially for Randoop) than the ones achieved with
Fig. 2. MAE of the Support Vector Regression (SVR) algorithm on the 3 projects used for the validation
TABLE V
MAES OFSVRFOR THE VALIDATION SET
Time Math Lang Tool’s average EvoSuite 0.255 0.330 0.289 0.291 Randoop 0.168 0.262 0.246 0.225 Algorithm’s average 0.211 0.296 0.267 0.258
the previous 10-cross fold validation. Indeed, the MAE for the SVR algorithm with the training set is of 0.216 and 0.088, for EvoSuite and Randoop respectively, while for the validation set we report average MAEs of about 0.291 (+34%) and 0.225 (+155%). Given such results, it is worth to notice that, the SVR model might have overfitted the training set. To address that, we plan to additionally investigate a reduction of the number of features or a further regularization tuning. In general, we observe a more accurate prediction for the Randoop tool. Both rely on a non-deterministic algorithms, i.e., a genetic (for Evosuite) and a random (for Randoop) algorithm. However, it is still not clear why the models we trained are more accurate on the latter. Such an investigation is on our future agenda.
Result 2. To some extent, we show that ML algorithms are a viable option to predict the coverage in automated testing. However, further effort addressed at improving the features and tuning the algorithms need to be done.
Results Reproducibility A Docker image with the source code used and the trained models is available here [20].
IV. THREATS TOVALIDITY
Construct Validity.To have a wide overview of the extend to which a machine learning model might predict the branch coverage achieved test data generation tools, we initially experimented 3 different algorithms such as Huber Regression [22], Support Vector Regression [10] and Vector Space Model
[28]. Future effort will go in the direction of enlarging the number of algorithms employed.
In our study we rely on two different test data generation tools: EvoSuite, based on genetic algorithms, and Randoop, which implements a random testing approach. Despite we rely on the most widely used tools in practice, we cannot ensure the applicability or our findings to different generation approaches such as AVM [25] or symbolic execution [1].
To capture the complexity of the CUTs, we use different kind of features, i.e., package level features, CK and OO features and Java reserved keywords. To calculate them we rely on theCK tool [2]. However, our results might be influenced by the accuracy of this tool. Moreover, some of the employed features might overlap, be redundant or even irrelevant. In our future agenda we plan to apply feature selection techniques to simplify the models, reduce the training times and improve the generalization of the results.
External Validity.About the threats to the generalizability of our findings, we train our models with a dataset of 4 different open source projects, having different size and scope. However, a larger training set might improve the generalizabil-ity of our results.
V. RELATEDWORK
The closer work to what we present in this paper is the one of Ferreret al.[15]. They proposed the Branch Coverage Expectation (BCE) metric as the difficulty for a computer to generate test cases. The definition of such a metric is based on a Markov model of the program. They relied on this model also to estimate the number of test cases needed to reach a certain coverage. Differently for our work, they showed traditional metrics to be not effecting in estimating of the coverage obtained with test data generation tools. Shaheen and du Bousquet investigated the correlation between the Depth of Inheritance Tree (DIT) and the cost of testing [37]. Analyzing 25 different applications, they showed that theDITA,i.e., the depth of inheritance tree of a class without considering its JDK’s ancestors, is too abstract to be a good predictor.
Different approaches have been proposed to transform and adapt programs in order to facilitate evolutionary testing [23]. McMinnet al.conducted a study transforming nestedifsuch that the second predicate can be evaluated regardless the first one have been satisfied or not [27]. They showed that the evolutionary algorithm was way more efficient in finding test data for the transformed versions of the program. Similarly, Baresel et al. applied a testability transformation approach to solve the problem of programs with loop-assigned flags [4]. Their empirical studies demonstrated that existing genetic techniques were more efficiently working of the modified versionx of the program.
In this study, we rely on EvoSuite [17] and Randoop [29]. In last years the automated generation of test cases has caught growing interest, by both researches and pratictioners [17], [30], [33]. Search-based approaches have been fruitfully exploited for such goal [26]. Indeed, current tools have been
shown to generate test cases with an high branch coverage and helpful to successfully detect bugs in real systems [38].
VI. CONCLUSIONS& FUTUREWORK
In a continuous integration environment, knowing a priori
the coverage achieved by test data generation tools might ease important decisions, like the subset (and the order) of classes to test, or the budget to allocate for the every of them. In this work, we take the first steps towards the definition of features and machine learning approaches able to predict the branch coverage achieved by test data generator tools. Due to the non deterministic nature of the algorithms employed for this purpose, such prediction remains a troublesome task. To have initial insights, we selected longer employed code metrics as a features, experimenting 3 algorithms of different nature. Our preliminary results show the viability of our vision. They represent the main input for our future work. Future efforts will both involve more sophisticated features, applying a features selection analysis to remove the redundant or irrelevant ones, and investigate different algorithms.
ACKNOWLEDGEMENTS
We acknowledge the Swiss National Science Founda-tion (SNSF) under project named “SURF-MobileAppsData” (Project no. 200021-166275) and the Swiss Group for Soft-ware Engineering (CHOOSE).
REFERENCES
[1] E. Albert, P. Arenas, M. G´omez-Zamalloa, and J. M. Rojas. Test case generation by symbolic execution: Basic concepts, a clp-based instance, and actor-based concurrency. In Advanced Lectures of the 14th International School on Formal Methods for Executable Software Models - Volume 8483, pages 263–309, New York, NY, USA, 2014. [2] M. Aniche. ck: extracts code metrics from java code by means of static
analysis. https://github.com/mauricioaniche/ck. [3] A. Ant. Apache ivy. http://ant.apache.org/ivy/.
[4] A. Baresel, D. Binkley, M. Harman, and B. Korel. Evolutionary testing in the presence of loop-assigned flags: A testability transformation approach. In Proceedings of the 2004 ACM SIGSOFT International Symposium on Software Testing and Analysis, ISSTA ’04, pages 108– 118, New York, NY, USA, 2004. ACM.
[5] G. Bavota, G. Canfora, M. D. Penta, R. Oliveto, and S. Panichella. The evolution of project inter-dependencies in a software ecosystem: The case of apache. InProceedings of the 2013 IEEE International Confer-ence on Software Maintenance, ICSM ’13, pages 280–289, Washington, DC, USA, 2013. IEEE Computer Society.
[6] B. Beizer. Software testing techniques. Van Nostrand Reinhold Co., 1990.
[7] S. Benlarbi, K. E. Emam, N. Goel, and S. Rai. Thresholds for object-oriented measures. InProceedings 11th International Symposium on Software Reliability Engineering. ISSRE 2000, pages 24–38, 2000. [8] A. Bertolino. Software testing research: Achievements, challenges,
dreams. In 2007 Future of Software Engineering, FOSE ’07, pages 85–103, Washington, DC, USA, 2007. IEEE Computer Society. [9] J. Campos, A. Arcuri, G. Fraser, and R. Abreu. Continuous test
gener-ation: Enhancing continuous integration with automated test generation. In Proceedings of the 29th ACM/IEEE International Conference on Automated Software Engineering, ASE ’14, pages 55–66, New York, NY, USA, 2014. ACM.
[10] C.-C. Chang and C.-J. Lin. Libsvm: A library for support vector machines.ACM Trans. Intell. Syst. Technol., 2(3):27:1–27:27, May 2011. [11] S. R. Chidamber and C. F. Kemerer. A metrics suite for object oriented
design. IEEE Trans. Softw. Eng., 20(6):476–493, June 1994.
[12] M. Clark. jdepend: A java package dependency analyzer that generates design quality metrics. https://github.com/clarkware/jdepend.
[13] A. Commons. Apache-commons lang. https://goo.gl/8KB6zE. [14] A. Commons. Apache-commons math. https://goo.gl/qW47nj. [15] J. Ferrer, F. Chicano, and E. Alba. Estimating software testing
complex-ity. Inf. Softw. Technol., 55(12):2125–2139, Dec. 2013. [16] A. S. Foundation. Apache cassandra. http://cassandra.apache.org. [17] G. Fraser and A. Arcuri. Evosuite: Automatic test suite generation for
object-oriented software. In Proceedings of the 19th ACM SIGSOFT Symposium and the 13th European Conference on Foundations of Software Engineering, ESEC/FSE ’11, pages 416–419, New York, NY, USA, 2011. ACM.
[18] Google. Guava. https://github.com/google/guava. [19] Google. Guava. https://github.com/google/dagger.
[20] G. Grano, T. V. Titov, S. Panichella, and H. C. Gall. Replication Package - How High Will It Be? Using Machine Learning Models to Predict Branch Coverage in Automated Testing, Feb. 2018. doi: https://doi.org/ 10.5281/zenodo.1182834.
[21] B. Hailpern and P. Santhanam. Software debugging, testing, and verification. IBM Syst. J., 41(1):4–12, Jan. 2002.
[22] F. Hampel, E. Ronchetti, P. Rousseeuw, and W. Stahel.Robust Statistics: The Approach Based on Influence Functions. Wiley Series in Probability and Statistics. Wiley, 2011.
[23] M. Harman, A. Baresel, D. Binkley, R. Hierons, L. Hu, B. Korel, P. McMinn, and M. Roper. Testability Transformation – Program Transformation to Improve Testability, pages 320–344. Springer Berlin Heidelberg, Berlin, Heidelberg, 2008.
[24] Joda-Time. Time. http://www.joda.org/joda-time/.
[25] K. Lakhotia, M. Harman, and H. Gross. Austin: An open source tool for search based software testing of c programs.Information and Software Technology, 55(1):112–125, 2013.
[26] P. McMinn. Search-based software test data generation: a survey. Software Testing, Verification and Reliability, 14(2):105–156, 2004. [27] P. McMinn, D. Binkley, and M. Harman. Empirical evaluation of a
nesting testability transformation for evolutionary testing. ACM Trans. Softw. Eng. Methodol., 18(3):11:1–11:27, June 2009.
[28] A. B. Nassif, D. Ho, and L. F. Capretz. Towards an early software estimation using log-linear regression and a multilayer perceptron model. J. Syst. Softw., 86(1):144–160, Jan. 2013.
[29] C. Pacheco and M. D. Ernst. Randoop: feedback-directed random testing for Java. InOOPSLA 2007 Companion, Montreal, Canada. ACM, Oct. 2007.
[30] A. Panichella, F. M. Kifetew, and P. Tonella. Reformulating branch coverage as a many-objective optimization problem. In ICST, pages 1–10. IEEE Computer Society, 2015.
[31] F. Pedregosa, G. Varoquaux, A. Gramfort, V. Michel, B. Thirion, O. Grisel, M. Blondel, P. Prettenhofer, R. Weiss, V. Dubourg, J. Vander-plas, A. Passos, D. Cournapeau, M. Brucher, M. Perrot, and E. Duch-esnay. Scikit-learn: Machine learning in Python. Journal of Machine Learning Research, 12:2825–2830, 2011.
[32] M. Sanderson and W. B. Croft. The history of information retrieval research. Proceedings of the IEEE, 100(Centennial-Issue):1444–1451, 2012.
[33] S. Scalabrino, G. Grano, D. D. Nucci, R. Oliveto, and A. D. Lucia. Search-based testing of procedural programs: Iterative single-target or multi-target approach? In SSBSE, volume 9962 ofLecture Notes in Computer Science, pages 64–79, 2016.
[34] Scikit-learn. Huber regressor. https://goo.gl/8LM7EL. [35] Scikit-learn. Multi-layer perceptron. https://goo.gl/VwZqZN. [36] Scikit-learn. Support vector regression. https://goo.gl/fiFBMu. [37] M. R. Shaheen and L. d. Bousquet. Is Depth of Inheritance Tree a
Good Cost Prediction for Branch Coverage Testing? In 2009 First International Conference on Advances in System Testing and Validation Lifecycle (VALID), pages 42–47. IEEE, 2009.
[38] S. Shamshiri, R. Just, J. M. Rojas, G. Fraser, P. McMinn, and A. Arcuri. Do automatically generated unit tests find real faults? an empirical study of effectiveness and challenges (t). In Proceedings of the 2015 30th IEEE/ACM International Conference on Automated Software Engineering (ASE), ASE ’15, pages 201–211, Washington, DC, USA, 2015. IEEE Computer Society.
[39] Z. Xu. Directed test suite augmentation. InProceedings of the 33rd International Conference on Software Engineering, ICSE ’11, pages 1110–1113, New York, NY, USA, 2011. ACM.
[40] S. Yoo and M. Harman. Regression testing minimization, selection and prioritization: A survey. Softw. Test. Verif. Reliab., 22(2):67–120, Mar. 2012.