www.cscanada.org DOI:10.3968/10068
Data Mining to Understand Customer Behaviour in Usage of Mobile
Applications Services
CHEN Haoxiang
[a],*; CHEN Qianling
[a]; CHEN Qianyi
[b][a]School of Business Administration, South China University of
Technology, Guangzhou, China.
[b]Department of Mass Cultural, Daliang Cultural Center, Foshan, China.
*Corresponding author.
Received 9 September 2017; accepted 3 November 2017 Published online 16 December 2017
Abstract
Customer usage data produced by mobile applications and mobile phones contain valuable knowledge about users and market. Such knowledge can help companies to conduct customer acquisition. Using customer personal data exacted from both mobile applications and telecoms operator, this study tries to investigate the features of the valuable potential customer by using the integrated data mining methods. The findings will help the developer to identify the value of different groups and target worthy potential customers. Such knowledge will also enable
developers to offer personalized promotions and marketing
information to potential customers. The mobile application using behaviour and mobile-service performance data also helps the developer of the mobile application and telecoms operator to utilize each other’s resource to extend their customer base. The approach balances complexity with ease of use and thus facilitates the developer to make use of user usage behaviour data to improve marketing decisions.
Key words:
Value co-creation; Mobile application; Mobile services; Marketing decisions; Service innovationChen, H. X., Chen, Q. L., & Chen, Q. Y. (2017). Data Mining to
Understand Customer Behaviour in Usage of Mobile Applications Services. Management Science and Engineering,11(4), 10-19. Available from: URL: http://www.cscanada.net/index.php/mse/article/view/10068 DOI: http://dx.doi.org/10.3968/10068
INTRODUCTION
Due to the wide spread of smartphones and mobile devices, billions of people are now connected to internet
and contribute to a large amount of personal data (Economist, 2014; Manyika et al., 2011). Such data contains rich information like user behaviors, preference, life style, social image and self-image. These kinds of information are critical resources for companies to obtain customer knowledge without asking customers explicitly, and hence can enable developers to segment customers and discover opportunities to improve products and services, conduct customization, and make innovations more quickly and accurately (Chen et al., 2012; Davenport et al., 2012; Wong, 2012). As indicated by existing literature, companies who apply data-driven decision
making are 5% more productive and 6% more profitable
than their competitors (McAfee & Brynjolfsson, 2012). Customers are always co-creators of marketing (Vargo & Lusch, 2004) and value co-creation with customers has become a new source of service capability and customization capability which are important in new product design (Prahalad & Ramaswamy, 2004). By partaking adequate information about customer
needs, a firm is more likely to gain an advantage over its
rivals because such information facilitates it to discover market trends, notice customer demand change, reduce searching costs, increase innovation efficiency, and design customized products or services more quickly and accurately (Pine et al., 1995; Kambil et al., 1996; Cook & Scott, 2008). In the mobile internet industry, data-driven decision is becoming a critical tool for mobile application developers to better understand customer needs and make responsive innovation to customers’ requirements and demand changes (George et al., 2014). However, extracting value from such huge amount of data remains fascinating
but elusive as large amount of data is difficult to manage
and analyze (Ross et al., 2013; Goes, 2014). Hence, most researches still rest on qualitative classification and simple prediction on recruiting new customers, such as the identity of the profitable customers, their needs, and how to attract them (HeikkilaJukka, 1998; Peter &
Donkers, 2001; Carrie et al., 2003; Chen et al., 2011). Few studies have to dig into the particular characteristics of profitable customers. Analyzing the characteristics of profitable customers is the most important and potential part of customer analysis and needs data of customer characteristics and customer behaviors which should be collected from both the mobile service provider and mobile application developers (Tichindelean, 2013).
To fill this gap, we proposes this study to investigate
the high value customer acquisition of mobile application service by analyzing one-month’s customer behavior data from one particular application (March, 2014, 38 million records) using three data mining methods (ANN (artificial neural network), RFM (Recency, Frequency and Monetary) and Two-Step clustering). The telecommunication data (base-fee and data-service fee) was provided by the biggest mobile service provider in China and the user behavior data was from the developer of this mobile application software. Different from previous research which primarily focus on the role of customer involvement and customer communication in value co-creation (Jaakkola & Alexander, 2014), this study extends the value co-creation literature by treating customer usage data as the process of value co-creation
with customers (Hoyer et al., 2010). The findings of this
study can also help developers better identify and serve potential users.
This study is organised as follows: In Section 2, an approach is proposed for analysing data for the development of new users. This approach is then applied to the data extracted from mobile application software and mobile services in Section 3. Theoretical contributions and implications are discussed in Section 4. Section 5 summaries this study and highlights limitations and future research directions.
1. ADDING THE VALUE CO-CREATION
LENS
According to service-dominant(S-D) logic, value becomes a joint function of the actions of providers(s) and the consumer(s) and is therefore always co-created (Prahalad & Ramaswamy, 2000, 2004a, b; Vargo & Lusch, 2008a). Value co-creation refers to a function of interaction (Christian & Voima 2013). The definition of interaction we use here is the interacting parties are involved in each other’s practices in a situation (Echeverri & Skålen ,2011, Grönroos & Ravald, 2011). In service science, value co-creation occurs through “the integration of existing resources with those available from a variety of service systems that can contribute to system well-being as determined by the system’s environmental context” (Vargo et al., 2008, p.150; Baron & Harris, 2008). Service logic emphasizes value is co-created only in some cases
- if the firm adopts provider service logic and establishes
interactions between the supplier and the customer. Taken together, the different approaches, including S-D logic, service science, and service logic and so on offer diverse perspectives on the value-co-creation concept (Hannu & Kannan, 2013). Dismantling value co-creation into its constituent parts provides us with fundamental understand that help to comprehend the concept of value co-creation. The “value” in value co-creation is clarifying what kind of value for whom. Value is the customer
value, firm value, or both (Hannu & Kannan, 2013). The
“Co” in “value co-creation” defines who are involved in the process and what resources are being deployed in the creation (Ibid.). The “creation” in value co-creation refers to the mechanism through which the
resources provided by different actors are integrated into
value co-creation process (Hannu & Kannan, 2013). In
relationships between firms and customers, co-production,
co-design, co-development and co-marketing (Frow et al., 2010; Sheth & Uslay, 2007; Hannu & Kannan, 2013) are examples of mechanisms. With the emergence of smartphones during the last few years, apps have become the key interaction and service provision mechanism between the service provider and the customer (Dube, 2014).
Most of the existing work on value co-creation has been conducted in the traditional industries. In this article, we shift the focus to the Mobile Internet context. In this context, customers download apps onto their smartphones and thus the app consumes the device’s memory, whereas web sites are hosted on servers. Apps can function without internet connectivity, a feature that is not available for traditional web sites. Apps provide services and have an impact through their service experiences on the everyday lives of their users (Dube, 2015). Customers’ use experiences in a smartphone apps context can be collected anytime easier than traditional goods and services. All the data collected from the app enable the service provider to understand the features of the users. During the value co-creation process, customers become a payer, a competence provider, a co-producer or a co-marketer of the product (Storbacka & Lehtinen 2001; Sampson and Spring 2012; Nambisan 2002.). The interactions between the customer and the firm in the value co-creation process are either
direct or indirect and different types of interactions lead to
different forms of value co-creation (Christian & Voima 2013). Direct interactions are joint processes where two or more actors’ actions merge into one collaborative, dialogical process. The actors here can be human actors or intelligent systems and products (Christian, 2014). Indirect interactions are interactions where one actor, such as a customer, interacts with a standardized system or product. No merged collaborative, dialogical process occurs, and therefore, the other actor, such as a provider of such resources, cannot actively influence customers’ value creation (Christian, 2014). Direct interactions with intelligent resources (people, intelligent systems) enable
value co-creation while indirect interactions do not. The app is an intelligent system such as the voice assistant we research here which works like your assistant in your smartphone. Whatever you want to search or control your smartphone, you can tell this intelligent system. For example, you can tell the voice assistant app how you want it to do so that it can satisfy you demand or the voice assistant will guide you to tell it how it can do better. All your service experience can be recorded and give the service provider some ideas about how to make the voice assistant better. The service provider improves the app and then updates the version of the app to give you a better service. The app acts as the value co-creation platform for the service provider and the customer.
In order to obtain value co-creation opportunities, supplier may “teaching” the customer how to co-create
value (Adrian, Storbacka, & Pennie 2008). As it is difficult
to know in what situation and mental state of the customer
is during the interactions created by the firm, the risk for
value destruction may exist and increase (Christian &
Voima, 2013). The ability of the firm to interact with the
customer unconsciously through the resources provided is vital. In previous researches, value co-creation involves costs of time, resources, physical and psychological
effort to learn and participate in the co-creation process to customers so customers compare the benefits of engaging
in the co-creation process (Hoyer et al., 2010). However, the outcomes of value co-creation can help the firm to
reduce the cost and increase the effectiveness of products
or services and to build better potential relationship with
customers (Hoyer et al., 2010). The amount of information which is generated by the customer is an important aspect of the customers’ ability to create value (Normann, 2001). Surveys, in-depth interviews, and focus groups are the
more common market research techniques that firms use
to generate customer information in the value co-creation process, nevertheless, in the Mobile Internet context, value can be co-created through the data of user experience collected from the value co-creation platform. Nowadays, the behaviour of the user can be track much easier than before in the big data context and the preference of the user can be found by the data mining technologies. The usage data of the customer can be treated as the track of the process of value co-creation with customers and the service provider can interact with the customer who does not know it. Data collected and analysed in the value co-creation process on app can help the service provider to identify the customer demand change in time and the customers just need to enjoy themselves in the service during the value co-creation process.
2. RESEARCH METHODOLOGY
The data analytical approach is developed using three data mining techniques: RFM (recency, frequency,
monetary) analysis, two-step cluster analysis, and artificial
neural network (ANN). They are well used methods for marketing support (Mahmood et al., 2013). The proposed procedure is presented in Figure 1 and its details are discussed in the subsequent sections.
Figure 1
2.1 RFM Analysis
RFM analysis is a marketing technique that quantifies customer value by examining how recently a customer has purchased (recency), how often the customer purchases (frequency), and how much the customer spends (monetary) (Hughes, 1996). It is an effective process to group or segment existing customers for analysing their behaviours and predicting their attitudes toward customization.
In RFM analysis, customers are sorted by the length
of the time period between the last use and a given date in ascending order (recency), by the number of using times(frequency) in descending order, and by the amount of value creation in a given time period (monetary) in descending order. Numerical value of 1 to 9 will be assigned to users in terms of recency, frequency and momentary based on the ranks. In particular, the top one-ninth will be given 9, the next one-one-ninth will be given 8, and till the bottom one-ninth will be assigned 1. The RFM
score can then be defined as
��� �core � recency × weight� + frequency × weight� + monetary × weight�
.
(1)Different weights should be assigned to RFM variables
depending on the characteristics of the industry. Some researchers assigned particular weight to each RFM variables. Tsai and Chiu (2004) pointed out that the sum of the weight of each RFM measure should be equal to 1. Liu and Shih (2005a, 2005b) utilized analytic hierarchy process to determine the relative weights of RFM variables. Other researchers assigned a weight to each RFM variables based on past experience. In this study, we assigned the weight to RFM variables based on the ANN
(Artificial neural networks ) sensitive analysis and the sum
of the weight are equal to 1. A high RFM score indicates that a user has high value.
2.2 Artificial Neural Network
Artificial neural networks attempt to model the architecture of biological neural systems. Biological neural networks are made of simple, tightly interconnected
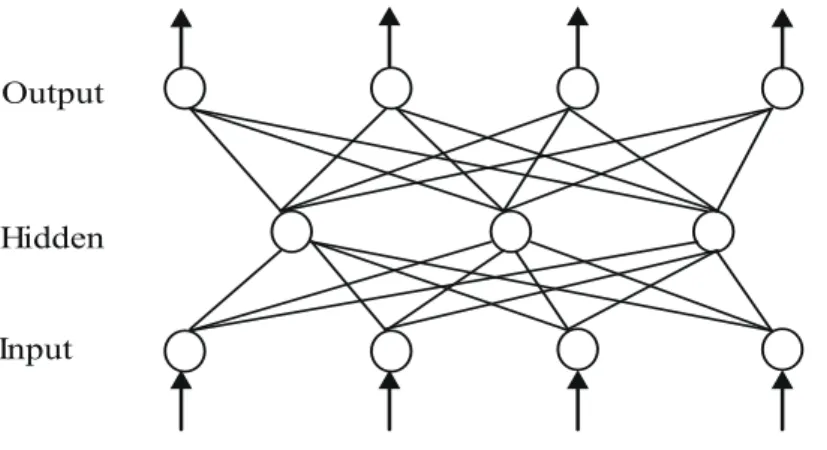
processing elements called neurons. The “axons” form several connections with other neurons (Venugopal, & Baets, 1994). ANNs use nonlinear mathematical equations (nodes) to successively develop meaningful relationships between input and output variables through a learning process (Linder, Geier, & Kolliker, 2004). Nodes connect into artificial neural networks. The simplest network is a group of nodes arranged in a layer. A group of single layers are cascading to be a multiplayer network (Ibid.). Figure 2 shows a three-layer neutral network: an input layer (receive the signals), an output layer and a hidden layer between them. The nodes of different layers are densely interconnected by directed links. The signals spread simultaneously through the network, layer by layer. The number of hidden layer can be selected randomly, but
too many nodes in the middle layer may affect the ability
to generalize the input data.
Input layer Hidden layer Output layer Figure 2 A Three-Layer Network
A sensitive analysis on the ANN can help us to better understand of the relative importance of each input on the output.
2.3 Two-Step Clustering Analysis
Two-Step clustering analysis is one of the techniques used in separating a large group into sub-groups by minimizing the similarity among the observed objects in the same
cluster and maximizing the differences among the clusters
(Michailidou et al. 2009).This clustering method was
developed by Chiu et al. (2001) and designed to handle very large data sets. Compare with the widely used clustering algorithms, such as k-means clustering and agglomerative hierarchical techniques, two-step clustering analysis can deal with quantitative and qualitative variables simultaneously (Bacher, 2000). Moreover, it can determine the number of clusters automatically. As its name suggested, two-step clustering analysis has two procedures termed “pre-clustering” and “clustering”. The “pre-clustering” procedure is pre-clustering cases into
sub-clusters base on a sequential clustering approach described by Theodoridis and Koutroumbas (1999). In this procedure, all cases are scanned and the current case should be merged with the previously formed clusters or be assigned to a new cluster according to the distance criterion. In the second step, the clustering procedure, it is using the standard agglomerative hierarchical clustering algorithm to group the sub-clusters into the desired number of clusters. The desired number of clusters is calculated by the Schwarz Bayesian Criterion or the Akaike Information Criterion in the first step and is
refined by finding the largest increase in the hierarchical
clustering stage distance between the two closest clusters (Satish & Bharadhwaj, 2010).
According to Chiu et al. (2001) the distance between clusters i and j, d(i,j), is defined as the decrease in log likelihood due to the merging of the two clusters:
�(�� �� � ��+ ��� ������ ��� ���(∑����� �����(����+ ������ + ∑����� ����) E �ik=-∑ Nvkl Nv Lk l=1 log(NNvklv ) . (2) where �(�� �� � ��+ ��� ������ ��� ���(∑����� �����(����+ ����� � + ∑����� ����) E�ik=-∑ Nvkl Nv Lk l=1 log(NNvklv ) , (3) �(�� �� � ��+ ��� ������ ��� ���(∑����� �����(����+ ������ + ∑����� ����) E �ik=-∑ Nvkl Nv Lk l=1 log(NNvklv ) . (4)
In the above equations, the KA is the number of
quantitative variables while KB is the number of qualitative
variables, Nv and Nvkl is the number of cases in cluster v
and the number of cases in clusterv which belongs to the
lth category of the Kth qualitative variable respectively, is
the estimated variance of the Kth quantitative variable and
is the estimated variance of the Kth quantitative variable
for cases in the vth cluster. <i, j> is representing the cluster
formed by combing cluster i and j. Those clusters with the smallest distance d(i,j) are merged in each step.
3. ANALYSE AND RESULTS
The proposed approach is used to analyse the transaction data extracted from mobile application software (APP) to elicit knowledge about customers. The developer of APP is a leading provider of intelligent speech and language technologies and related software, chips, and speech information services in China. Moreover, one of the shareholders is a leading telecom operator, who wants to take an advanced status in the Voice Portal. APP, which was launched in December, 2012, is a key product of the developer. It is available on both Android and IOS operating systems and had more than 1 million customers in 2016. Similar to Apple’s Siri, this APP is a voice assistant. It has more than 30 functions that enable customers to operate smartphones using voice demands, such as making phone calls, sending messages, buying lotteries, subscribing for ring-back tones, playing music, downloading applications, reading novels and news, and searching for various kinds of information, including
weather conditions, mobile phone usage, restaurant, and airline schedule.
If a customer is on-line, APP automatically sends data to the server in the developer when the customer
makes a request or uses a function. If a customer is
off-line, APP records the customer’s operations and sends the data to the server when the customer is connected to the Internet. On average, 1 to 2 GB data is sent to the server every hour and the developer can collect 30 GB customer behaviour data every day. The data is stored in nine logs in the database, which include operational data about what functions are used, when, and by whom. Such data enables the developer to analyse users’ preferences and identify the relationships among the functions. We extract one month’s data (March, 2014) from the database, which includes 38 million records, to conduct the following analyses.
As we mentioned above, one of the investors of the APP is a leading telecom operator. We extract the corresponding month’s mobile service data about the APP users come from Guangdong Province which has the largest number of the APP users from the database of this telecom operator. The mobile service data include the cost plans, the basic fee, the voice fee, the data service fee, the mobile phone type, the calling regions, the data
traffic. Such data enables the developer to analyse users’
status and identify the most worthy potential users to be developed in the future. We extract 1.1 million records from the database to conduct the following analyses. 3.1 Evaluate the Importance Weight of Each RFM Variables
As we mentioned above, the APP is the collaborative product between the developer and the telecom operator. The developer can utilize the advantages of its resources from the telecom operator to extend its customer base while the telecom operator can occupy the market opportunity of the voice portal. Exploring the interaction of APP using behaviour and the mobile-service performance can tell us the mutual promotion between APP developer and the telecom operator. ANN analysis is applied to do this exploring. First, we set frequency,
recency and monetary as the input in the artificial neural
network while the base-fee of the mobile service and the data-service-fee of the mobile service were set as the output in the network. This artificial neutral network is presented in Figure 3. SPSS Modeler is used to conduct the ANN analysis. In this artificial neutral network, the estimated accuracy is 97.843% and the hidden layer is the one consists of 20 neurons. We conducted the sensitivity analysis in this artificial neutral network to explore the degree of the input affects the output. The result is showed in Figure 4. Figure 4 is the ranking results of the
input impact the output. In this artificial neutral network,
frequency is the most important input variable for the output.
Figure 3
First Artificial Neural Network
Figure 4
Sensitive Analysis of the First Artificial Neural Network
3.2 Identify the Most Worthy Potential Users
Customers use APP in different ways. Some may spend a lot
time on APP and use many functions frequently. The other may only use some functions occasionally. Understanding the value distribution of the users can help the developer
to provide customized or personalized services to different
groups of customers. We use RFM analysis to classify customers and identify the value distribution. In the analysis, recency is operationalized as the length of a time period between the last use and 1st April 2014. Frequency
is measured by how often a customer uses this APP from 1st to 30th March 2014. Monetary of each function is
measured by two dimensions: profit opportunities and impacts on customer loyalty. An expert group which includes employees from product development, marketing and data analysis departments in the developer is asked to evaluate each function of APP using the 5-point Likert-type
scale (0=“strongly unimportant”; 4=“strongly important”) on these two dimensions. The average score of the two dimensions is used to measure the monetary value of each function (). For each customer, we calculate how many times he/she uses each function in the month (). Monetary for a customer is then operationalized as, where p is the number of functions used by the customer. The sensitivity analysis of ANN is used to evaluate the relative importance (i.e., weight) of recency, frequency and monetary for APP. The results are weight_R=0.2712, weight_F=0.3975, and
weight_M=0.3313. SPSS Modeler is used to conduct
the RFM analysis. According to the RFM score, the top
20% (6.7≤the RFM score≤8.7) are selected as first level customers, and the next 20% (4.2≤the RFM score≤6.7)
are selected as second level customers, and till the bottom 20% are selected as fifth level customers. The results are reported in Figure 5.
Figure 5
RFM Score Distribution
Two-Step clustering analysis is applied to separate customers into groups base on their mobile service indexes, called-numbers and data-used. The numbers of called the user made and the amount of data the user used are two major indexes in the communication industry and these indexes can reflect whether the user
is communication-orientated or data-usage-orientated. SPSS Modeler is used to conduct the two-step clustering analysis. We transform the data on the communication usage and data service usage into the suitable form, which is then visualized using SPSS Modeler. The result of the clustering analysis is presented in Figure 6.
Figure 6
The Result of Two-Step Clustering Analysis
We find that the APP user from Guangdong Province
can be divided into three groups, communication-orientated and more data-usage (cluster-3), data-usage-orientated and less communication (cluster-2), less communication and data-usage (cluster-1). Both the called-numbers and data-used indexes are significant in the user of segmenting. The percentage of cluster-2 approximates that of cluster-3 and both of them are accounted for the most of the users. The feature of cluster-2 is distinct, the users are data sensitive. Cluster-3 consist of valuable user of the telecom operator, this kind of user are called by others frequently and use more data
service. According to the features of the APP users in the mobile services, next, we will analyze which cluster will be the most worthy one to be developed when the developer of the APP wants to develop the potential user.
We calculated the value density of the three mobile
services clusters in the five-level APP users we mentioned
above to identify which mobile services cluster is the most worthy one for the APP developer to develop the potential users. We compare the APP operational use to a mine which consists of gold, silver and other mineral resources. Now we need to explore it. These three mobile services clusters like different sections in the mine. A company
invests to explore the mine but its fund is limited. The company needs to make a decision that which section will be the most worthy to be exploring. Firstly, we calculated the mean RFM score of the five-level APP users, the result is presented in Table 1. Secondly,
according to the distribution of the five-level customers
in three mobile services clusters, we can calculate the total value of every mobile services cluster and then their value density. The result of the value density is showed in Figure 7.
Table 1
The Mean RFM Score of the Five-Level APP Customers
Users level First- level Second- level Third- level Fourth- level Fifth- level
Mean RFM score 7.794031 5.602317 4.023197 2.854658 1.733866
As it presents in Figure 7, compare to the other two clusters, cluster-3, whose users are communication-orientated and more data-usage shows the high value density. Cluster-2, which consists of data-usage-orientated and less communication users, presents the most value density. Cluster-1 is the lowest mobile-service value for the telecom operator and its APP value density is the lowest.
Figure 7
The Value Density
DISCUSSION
Providing a new perspective on the roles of customers and how to learn and implement customer knowledge to gain competitive advantage, this study contributes to the innovation and customization literature. Customers may
play different roles in innovation, such as the buyer, user,
co-producer, and co-creator (Sampson & Spring, 2012; Nambisan, 2002). Here the customer is the co-operator. The APP is the collaborative product between the developer and the telecom operator. The developer of the APP can utilize the advantages of its resources from the telecom operator to develop the worthy potential users. Communication-orientated and more data-usage users might be co-operator of the APP developer. Managers are suggested to involve the communication-orientated and more data-usage users directly as active collaborators in the design, and delivery of products and services.
Customer oriented innovation requires companies to learn and elicit knowledge from high value customers which can be used to anticipate and respond to customers’ evolving needs and wants and to set up innovation strategy (Menor & Roth 2008; Papastathopoulou & Hultink 2012). However, knowledge about customer behaviour is very complex and changes rapidly. In addition, a company can only involve limited number of customers and hence not every worthy user who possesses high levels of product and market knowledge can contribute to user-development projects. Customer participation also increases project uncertainties and risks, and the company needs to invest in building and maintaining customer relationships (Nambisan, 2002). Analytical approaches
we proposed here provide a new cost-efficient method to
generate market intelligence about customer behaviour and to develop a clear understanding of both the present and future user development strategy without direct user involvement. Companies can co-create value with the customers who are informed. Through analysing user behaviour data, companies can learn sticky knowledge from, and understand the needs of, all worthy users without the costs of establishing ties with them or building relationships to foster their willingness to contribute potential user development idea.
The combination of the user behavior of the APP and their mobile service feature enables companies to obtain information from users without asking and to infer knowledge based on past observations and transactions. Fact-based decision making and analytical approaches also help companies to discover the associations among user behaviour of using the APP and their mobile service preference and to predict the feature of the most worthy potential user. Hence, companies can make tailored recommendations or marketing promotions to develop the worthy potential users. Interaction between the APP usage behaviour and the mobile service can help both corporations to utilize the resource of each and increase the user value.
CONCLUSION
This study investigates the value density of different groups of users and identifies the most worthy potential users of the APP through analysing the data extracted
from mobile application software and the telecom operator database. The results show that the combination of the APP usage behaviour data and the mobile service data enables the developer to learn user value distribution and value density of exciting users, such as what is the distribution of different user value, which user cluster from the telecom operator is the most valuable. Such knowledge of user features can be used to design
customized and innovative services. We also find that the
APP usage behaviour and their mobile service feature have a great impact on each other. The frequency of
the user uses the APP effect he/she spend on the mobile
service significantly. Moreover, the data the user uses the mobile service effect the times he/she using the APP. Through identifying worthy potential users and the interaction between the APP usage and the mobile service, the approach ensures that the generated association rules are not trivial results that already known by anyone who is familiar with the business, or inexplicable results that have no explanation and do not suggest a course of actions (Berry & Linoff, 2004). It can produce valuable knowledge that helps the developer to improve the user base and customer value by putting resource on the worthy potential customer. The telecom operator can help the APP develop to do the marketing promotion to increase the APP using times so that to increase the mobile service value.
Although this study makes significant contributions to the literature, it still has limitations that open up avenues for future studies. First, this study focuses on analysing structured data. Future study could investigate how to combine unstructured data, such as text, with structured data to understand customer behaviour and make customization and innovation decisions. Second, statistical data is utilizing in this study. Future study could explore the time-series data to analyze the dynamics of the user behaviour. Last but not least, the implementation of user-behaviour data is not only a technical issue but also a managerial challenge (McAfee & Brynjolfsson, 2012). Future study could investigate what are the organizational, culture and talent challenges, and how to tackle them to
capitalise on the opportunities offered by user-behaviour data analysis technologies and maximize their benefits.
FURTHER RESEARCH AND LIMITATIONS
Despite the potential contributions of our study, several limitations can be identified, which open up future research directions. The data we utilise in our study is the combination of the user behaviour of the APP and their mobile service feature in a month, however, user behaviour may be affected by some factors such as the location, the time and their feeling. We can leverage data resource strength to get other kinds of data to analyse the
user behaviour and find out different features of the three
clusters we mentioned above. Different kinds of factor
we used to do the cluster analysis and artificial neutral network analysis may cause different results. In this study, we choose the factor base-fee and data-service fee, which are revenue factors of the telecom operator, as the output of the artificial neutral network because we want to identify the feature of the most worthy user. Could
we use other factors as the output of the artificial neutral
network? The period of the RFM analysis in this study is a month refers to the existing research about RFM. How long of the period in RFM analysis will be appropriate for the mobile application service product? In this study, we choose two-step clustering analysis to do the clustering analysis, what about other clustering analysis methods? Is different clustering methods lead to different results of the value density? We find out the most worthy user in this study and they are data-usage-orientated and less communication users. What is the preference of the most worthy user? What about redesigning the service to satisfy worthy user’s requirement? Identifying the preference of
the most worthy user and find out the suitable marketing
strategy to increase the potential customer base is also a research direction of the future study. Our research contributes to the value co-creation theory and service
innovation, whether or not the findings of this study will
apply to the general mobile application service operation department develop potential worthy user is something that needs to be investigated in future research.
REFERENCES
Aarikka-Stenroos, L., & Jaakkola, E. (2012). Value co-creation in knowledge intensive business services: A dyadic perspective on the joint problem solving process. Industrial Marketing Management, 41, 15-26.
Bacher, J. (2000). A probabilistic clustering model for variables of mixed type. Qual Quan, 34, 223-235.
Baron, S., & Harris, K. (2008). Consumers as resource integrators. Journal of Marketing Management, 24(1), 113-30.
Berry, M., & Linoff, G. S. (2004). Data mining techniques for
marketing, sales, and customer relationship management. Indianapolis, Indiana: Wiley Publishing.
Carbonell, P., Rodriguez-Escudero, A. I., & Pujari, D. (2009). Customer involvement in new service development: An examination of antecedents and outcomes. Journal of Product Innovation Management, 26(5), 536-50.
Chen, H. R., Chiang, H. L., & Storey, V. C. (2012). Business intelligence and analytics: From big data to big impact. MIS Quarterly, 36(4), 1165-1188.
Christian, G., & Voima, P. (2013). Critical service logic: Making sense of value creation and co-creation. Journal of the Academic of Marketing Science, 41, 133-150.
Christian, G., & Gummerus, J. (2014). The service revolution and its marketing implications: Service logic vs service-dominant logic. Managing Service Quality, 24(3), 206- 229.
Davenport, T. H., Barth, P., & Bean, R. (2012). How “big
data” is different. MIT Sloan Management Review, 54(1),
43-6.
Dube, A. (2014). Becoming happy with “angry” birds: Customers’ phenomenological service experience of virtual games. In Kandampully, J. (Ed.), Customer experience management: Enhancing experience and value through service management (pp.363-368). Kendall Hunt, Dubuque, IA.
Dube, A., & Helkkula, A. (2015). Service experiences beyond the direct use: Indirect customer use experiences of smartphone apps. Journal of Service Management, 26(2), 224-248.
Echeverri, P., & Skålen, P. (2011). Co-creation and co-destruction–a practice theory based study of interactive value formation. Marketing Theory, 11(3), 351-373.
Frow, P., Payne, A., & Storbacka, K. (2010). Co-creation: A framework for collaborative engagement. Paper Presented at the 18th International Colloquium in Relationship Marketing, Reading, MA, 27-30 September.
Fuchs,V. R. (1968). The service economy. New York: National Bureau of Economic Research.
George, G., Haas, M., & Pentland, A. (2014). Big data and management. Academy of Management Journal, 57(2), 321-6.
Goes, P. B. (2014). Big data and IS research. MIS Quarterly, 38(3), 3-8.
Hughes, A. M. (1996). The complete database marketer: second generation strategies and techniques for tapping the power of your customer database. Chicago: Irwin.
Linder, R., Geier, J., & Kolliker, M. (2004). Artificial neural
networks, classification trees and regression: Which method
for which customer base? Journal of Database Marketing & Customer Strategy Management, 11(4), 344-356.
Mahmood, G., Afzalian, M., Gheitasi, S., & Gheitasi,, S. (2013). Simulation of customer behaviour using artificial neural network techniques. International Journal of Information, Business and Management, 5(2), 59-68.
McAfee, A., & Brynjolfsson, E. (2012). Big data: The management revolution. Harvard Business Review, 90(10), 60-68.
Menor, L. J., & Roth, A. (2008). New service development competence and performance: An empirical investigation in retail banking. Production and Operations Management, 17(3), 267-84.
Menor, L. J., Tatikonda, M., & Sampson, S. E. (2002). New service development: areas for exploitation and exploration. Journal of Operations Management, 20(2), 135-57.
Michailidou, C., Maheras. P., Arseni-Papadimititriou, A., Kolyva-Machera, F., & Anagnostopoulou, C. (2009). A study of weather types at Athens and Thessaloniki and their relationship to circulation types for the cold-wet period, part I: Two-step cluster analysis. Theoretical and Applied Climatology, 97, 163-177.
Nambisan, S. (2002). Designing virtual customer environment for new product development: Toward a theory. Academy of Management Review, 27(3), 392-413.
Normann, R. (2001). Reframing business: When the map changes the landscape. Chichester, England: Wiley.
Papastathopoulou, P., & Hultink, E. J. (2012). New service development: An analysis of 27 years of research. Journal of Product Innovation Management, 29(5), 705-14.
Payne, A. F., Storbacka, K., & Frow, P. (2008). Managing the co-creation of value. J. of the Academic of Marketing Science, 36, 83-96.
Prahalad, C. K., & Ramaswamy, V. (2000). Co-opting customer competence. Harvard Business Review, 78(1), 79-87. Prahalad, C. K., & Ramaswamy, V. (2004a). Co-creating unique
value with customers. Strategy & Leadership, 32(3), 4-9. Prahalad, C. K., & Ramaswamy, V. (2004b). Co-creation
experiences: The next practice in value creation. Journal of Interactive Marketing, 18(3), 5-14.
Ross, J. W., Beath, C. M., & Quaadgras, A. (2013). You may not need big data after all. Harvard Business Review, 92(9), 58-68.
Saarijärvi, H., Kannan, P. K., & Kuusela, H. (2013). Value co-creation: Theoretical approaches and practical implications. European Business Review, 25(1), 6-19.
Sampson, S. E., & Spring, M. (2012). Customer roles in service supply chains and opportunities for innovation. Journal of Supply Chain Management, 48(4), 30-50.
Satish, S. M., & Bharadhwaj, S. (2010). Information search behaviour among new car buyers: A two-step cluster analysis. IIMB Management Review, 22, 5-15.
Sheth, J. N., & Uslay, C. (2007). Implications of the revised definition of marketing: From exchange to value creation. Journal of Public Policy & Marketing, 26( 2), 302-7. Storbacka, K., & Lehtinen, J. R. (2001). Customer relationship
management: Creating competitive advantage through win– win relationship strategies. Singapore: McGraw-Hill. Vargo, S. L., & Lusch, R. F. (2004). Evolving to a new dominant
logic for marketing. Journal of Marketing, 24(1), 1-17. Vargo, S.L., & Lusch, R.F. (2008a). Service-dominant logic:
Continuing the evolution. Journal of the Academy of Marketing Science, 36(2), 1-10.
Vargo, S. L., Maglio, P. P., & Akaka, M. A. (2008). On value and value co-creation: A service systems and service logic perspective. European Management Journal, 26(3), 145-52. Venugopal, V., & Baets, W. (1994). Neural network & their
applications in marketing management. Journal of Systems Management, 45(9), 16-21.
Wayne, D. H., Chandy, R., Dorotic, M., Krafft, M., & Singh, S. S.
(2010). Consumer co-creation in new product development. Journal of Service Research, 13(3), 283-296.
Wong, D. (2012). Data is the next frontier, analytics the new tool: Five trends in big data and analytics, and their implications for innovation and organisations. The Big Innovation Centre.