SFB 649 Discussion Paper 2013-027
Bank Lending
Relationships and the
Use of
Performance-Sensitive
Debt
Tim R. Adam*
Daniel Streitz*
* Humboldt-Universität zu Berlin, Germany
This research was supported by the Deutsche
Forschungsgemeinschaft through the SFB 649 "Economic Risk". http://sfb649.wiwi.hu-berlin.de ISSN 1860-5664 SFB 649, Humboldt-Universität zu Berlin
SFB
6
4
9
E
C
O
N
O
M
I
C
R
I
S
K
B
E
R
L
I
N
Bank Lending Relationships and the Use of
Performance-Sensitive Debt
TIM R. ADAM and DANIEL STREITZ
∗Abstract
We show that performance-sensitive debt (PSD) is used to reduce hold-up problems in repeated lending relationships. Using a large sample of bank loans, we find a more frequent use of PSD if hold-up is more likely, e.g. if a long-term lending relationship exists and the borrower has fewer outside financing alternatives. The use of PSD is less likely in syndicated relationship loans, as hold-up is less important in this market. Finally, we find a substitution effect between the use of PSD and the tightness of financial covenants, which is consistent with PSD reducing hold-up problems caused by the use of covenants.
Keywords: Performance-Sensitive Debt, Relationship Lending, Hold-Up, Covenants
JEL-Classification: G21, G31, G32
∗Tim R. Adam and Daniel Streitz are from the Institute of Corporate Finance at Humboldt
Uni-versity Berlin. The authors wish to thank Darwin Choi, Hans Christensen, Rüdiger Fahlenbrach,
Gustavo Manso, Mark Seasholes and Sascha Steffen, as well as seminar participants at HKUST and ESTM (Berlin) for helpful comments and suggestions. The authors would also like to thank Paolo Biz-zozero for excellent research assistance. The authors gratefully acknowledge support from the Deutsche Forschungsgemeinschaft through the Collaborative Research Centers SFB 649 ”Economic Risk” and SFB/TR15 ”Governance and the Efficiency of Economic Systems”. Contact information: Tim Adam, Tel.: +49(0)30 2093 5641, e-mail: [email protected]; Daniel Streitz, Tel.: +49(0)30 2093 5624, e-mail: [email protected].
Bank Lending Relationships and the Use of
Performance-Sensitive Debt
Abstract
We show that performance-sensitive debt (PSD) is used to reduce hold-up problems in repeated lending relationships. Using a large sample of bank loans, we find a more frequent use of PSD if hold-up is more likely, e.g. if a long-term lending relationship exists and the borrower has fewer outside financing alternatives. The use of PSD is less likely in syndicated relationship loans, as hold-up is less important in this market. Finally, we find a substitution effect between the use of PSD and the tightness of financial covenants, which is consistent with PSD reducing hold-up problems caused by the use of covenants.
Keywords: Performance-Sensitive Debt, Relationship Lending, Hold-Up, Covenants
Since the late 1990s, many bank loans have contained performance pricing provisions
which imply that the coupon paid rises as the firm’s financial performance deteriorates and
falls if it improves. Financial performance is measured using either the borrower’s credit
rating or a financial ratio such as a leverage ratio. The theoretical literature has linked
performance-sensitive debt (PSD) to debt renegotiation costs, asset substitution and
signaling considerations. Asquith et al. (2005) argue that PSD reduces debt renegotiation
costs due to adverse selection, moral hazard, or unanticipated changes in the borrower’s
credit risk. Koziol and Lawrenz (2010) show that PSD can mitigate risk-shifting incentives
in the presence of moral hazard,1 while Manso et al. (2010) demonstrate that PSD can
be used as a signaling device for a firm’s credit quality in a setting with adverse selection.
While these theories clearly explain some of the variation in the use of PSD, it
re-mains a puzzle as to why PSD is rare in public but common in private debt markets.2 Furthermore, even rated firms often issue PSD based on a financial ratio rather than the
borrower’s credit rating. Since a rating should, in most cases, better reflect a borrower’s
credit risk than a single financial ratio, the motivation for using PSD based on a financial
ratio must go beyond pure credit risk considerations.
We explore a new explanation for the use of PSD which is consistent with PSD being
common in the private debt market but uncommon in the public bond market, and which
explains why firms use PSD based on financial ratios instead of credit ratings: PSD is
1 In contrast, Bhanot and Mello (2006) argue that PSD is an inefficient method to reduce incentives for
asset substitution.
2 Using keyword searches on both Bloomberg and EDGAR Pro, we are able to identify only 115 public
bond issues from 74 distinct companies between 1989 and 2012. In contrast, about 50% of loans reported by LPC Dealscan contain performance pricing provisions.
used to mitigate hold-up problems in long-term lending relationships. Sharpe (1990) and
Rajan (1992) show that one cost of relationship lending is the potential for hold-up by the
lender. This is because the lender invests in the acquisition of borrower-specific private
information. The resulting information advantage of the lender makes it difficult for the
borrower to switch to another, less well informed lender due to adverse selection. This is
especially the case for opaque borrowers, which have fewer financing alternatives. If the
borrower is "locked in", the bank can exploit the situation by charging higher interest
rates or by denying interest rate reductions when the borrower’s performance improves.
Schmidt (2006) argues that the use of covenants, which is common in private debt
con-tracts, further exacerbates the hold-up problem because covenants shift bargaining power
from borrowers to lenders. Von Thadden (1995) shows that a solution to this hold-up
problem is to pre-specify contract terms ex ante, thereby limiting the discretion of the
lender. Indeed, PSD contracts limit the discretion of the lender because they pre-specify
the loan contract terms should a borrower’s performance deteriorate or improve. In this
case, the lender cannot demand undue interest rate increases (above what is justified by
borrower risk alone) if the borrower’s performance deteriorates and a covenant is
vio-lated, or deny interest rate reductions if the borrower’s performance improves. Because
covenants are based on financial ratios rather than a firm’s credit rating, it is necessary
to issue PSD based on a financial ratio in order to reduce hold-up induced by covenants.3
Our paper is the first to analyze explicitly the link between the hold-up problem in
3 A performance pricing provision can also be valuable for a lender who is trying to attract high quality
repeated lending relationships and the use of PSD contracts. Using a large sample of
private debt contracts issued by non-financial U.S. borrowers between 1990 and 2009,
we show that accounting-based PSD contracts, i.e. PSD based on a financial ratio, are
about 35% more likely to be used in repeated lending relationships after we control for
endogeneity of the lending relationship. As proposed by Bharath et al. (2011), we use the
spherical distance between the borrower’s and the lender’s headquarters as an instrument
for relationship strength. In contrast, we find no significant correlations between the use of
rating-based PSD and the presence of a repeated lending relationship. We further analyze
whether the use of PSD varies systematically across different types of borrowers. Santos
and Winton (2008) argue that the costs of relationship lending are higher for companies
which do not have access to other financing sources (e.g. bond market access). In line
with this argument, we find that accounting-based PSD contracts are more common in
relationship lending arrangements with smaller firms, firms that are not included in the
S&P 500 Index and firms that do not have a long-term issuer credit rating at the time
of the loan origination. If a loan is syndicated, performance pricing provisions are less
likely, which is consistent with hold-up being of less importance in syndicated loan deals.
The hold-up problem is especially severe in the presence of covenants. Consistent with
the argument by Schmidt (2006), we find a positive association between the presence of
covenants and the use of PSD.4 Furthermore, a majority of PSD have covenants on the
same performance measure as the one used in the performance-pricing provision, with
covenant thresholds typically set directly at the end of the pricing grid. However, if
performance pricing provisions are used to mitigate the hold-up problem, then there
should be a substitution effect between the pricing grid of rate-increasing PSD5 and
covenant tightness: covenants should be less tight compared to covenants of debt without
PSD.6This is what we find. Debt-to-EBITDA covenants, the most common covenant type in our loan sample, are less tight in PSD contracts that also use Debt-to-EBITDA as a
measure of the borrower’s performance compared with debt without PSD. Consistent with
the substitution hypothesis, this effect exists only for interest-increasing PSD contracts.7
Finally, we examine the evolution of the borrower’s credit rating 1-2 years following
the issue of PSD, to examine the possibility that PSD is used to signal credit quality, as
proposed by Manso et al. (2010). We find that borrowers credit ratings tend to improve
over 1-2 years following the issue of rating-based but not accounting-based PSD. These
results are consistent with the hypothesis that rating-based PSD is used to signal credit
quality, while accounting-based PSD is used to address potential hold-up problems in
repeated lending relationships.8
We make two contributions to the literature. Firstly, we offer a new explanation for
using PSD, namely that PSD reduces potential hold-up problems in repeated lending
relationships. In contrast, Manso et al. (2010) argue that borrowers use PSD to signal
5 PSD that allows for interest rate increases only.
6 Small deteriorations in a borrower’s performance, which would otherwise trigger a technical default now
automatically lead to interest rate increases as determined by the pricing grid. Thus, a substitution effect should exist for interest-increasing PSD contracts only.
7 Consistent with the substitution argument, Nikolaev (2011) shows that PSD contracts are less likely
to be renegotiated than regular debt.
8 Performance-pricing provisions in public debt are exclusively based on the issuer’s credit rating. Since
hold-up is of no concern in public bond markets, this result further supports our conclusion that accounting-based PSD and rating-based PSD is used for different purposes.
their credit quality, while Koziol and Lawrenz (2010) argue that PSD reduces moral
hazard. The study that is closest to our own is Asquith et al. (2005). These authors argue
that the use of PSD reduces debt renegotiation costs, which can arise in the presence of
adverse selection, moral hazard and unexpected changes in the borrower’s credit risk.
They find that interest-decreasing PSD is used if loan prepayment is more likely and
renegotiation costs are higher (as in syndicated loans). Interest-increasing PSD is used
if there is a greater probability that the debt will be downgraded. In contrast, we argue
that accounting-based PSD reduces a borrower’s switching costs to a new lender, which
are large if hold-up is likely. Consistent with this hypothesis, we find that the use of
accounting-based PSD is more likely if the firm borrows from a relationship lender and
if the firm has few borrowing alternatives outside the relationship. Furthermore, the use
of accounting-based PSD is less likely if a loan is syndicated, while the renegotiation cost
hypothesis would predict the opposite. The use of rating-based PSD, on the other hand,
appears to be consistent with theories based on adverse selection.
Secondly, our results provide indirect evidence that hold-up in repeated lending
rela-tionships can be of significant concern, and that borrowers and lenders take appropriate
actions to prevent it. Several authors find evidence which is consistent with the presence
of hold-up. Saunders and Steffen (2011) find that private firms pay higher loan spreads
when borrowing from a relationship bank, while public firms benefit from lower spreads.
Hale and Santos (2009) show that banks adjust their loan interest rates downwards after
bank-dependent borrowers rise more during recessions than loan spreads of borrowers
who have access to public debt markets. Freudenberg et al. (2011) show that contract
terms deteriorate more for borrowers that switch lenders after having violated a covenant
in the previous loan compared to borrowers that stay with the same lender. Mattes
et al. (2012) find that capital-constrained (European) banks charge borrowers with high
switching costs higher loan spreads than well-capitalized banks. This effect prevails only
during recessions. Degryse and Cayseele (2000) find evidence for a deterioration of
con-tract terms over the lending relationship for a sample of European firms.9 As argued by
Boot (2000), acquiring multiple bank relationships can be one potential solution for this
problem.10 However, Ongena and Smith (2000) show that this may reduce the availability of credit, because increased competition reduces the value of information acquisition and
hence the incentive to lend to "young" firms.11 We extend this literature by linking the
use of PSD to the hold-up problem in repeated lending relationships.
The remainder of the paper proceeds as follows. Section I presents our hypotheses.
Section II describes the sample selection process, outlines the construction of variables,
9 There is also considerable evidence of the benefits of lending relationships. Petersen and Rajan (1994)
find that the duration of a bank-firm relationship does not influence the contracted loan rate, but Berger and Udell (1995) document that rates on lines of credit and collateral requirements decrease with the duration of the bank-firm relationship. Bharath et al. (2011) find that repeated borrowing from the same lender translates into a 10-17 bps lowering of loan spreads, and that relationships are especially valuable when borrower transparency is low. See Boot and Thakor (2000), Elsas and Krahnen (1998), Freudenberg et al. (2011), Berlin and Mester (1998), Bharath et al. (2007), Bharath et al. (2011), and Schenone (2010) for further empirical evidence on the benefits of lending relationships.
10Houston and James (1996) find that firms with a single bank relationship use less bank debt, as growth
opportunities are higher. Farinha and Santos (2002) find that firms with higher growth opportunities or greater bank dependence are more likely to switch to multiple bank relationships. All of the above-mentioned evidence is consistent with the notion that multiple bank relationships reduce the hold-up problems.
11The availability of funds to young firms without a track record is one potential benefit of relationship
lending as shown by Petersen and Rajan (1995). Banks can "subsidize" borrowers in earlier periods in return for higher rents in future periods if they have an information monopoly.
and presents some descriptive findings. Section III contains the main empirical analysis,
which demonstrates a link between relationship lending and the use of performance pricing
provisions. Section IV explores alternative explanations, and Section V concludes.
I.
Hypothesis Development
Sharpe (1990) and Rajan (1992) show that a long-term lending relationship creates an
information asymmetry between the relationship lender and other potential lenders, which
can be costly for the borrower. Adverse selection can make it difficult for the borrower to
switch to another lender. The relationship lender can take advantage of its information
monopoly and extract some rents from the borrower. This is especially the case in the
event of covenant violations, because in these situations, much bargaining power rests with
the lender. Von Thadden (1995) argues that one way of reducing this hold-up problem
is to limit the discretion of the lender by using pre-specified contract terms. PSD can
be regarded as such a pre-specification of contract terms. PSD contracts specify higher
(lower) interest payments if the borrower’s performance deteriorates (improves) in the
future. Using PSD, the relationship lender could not deny interest rate reductions should
a borrower’s performance subsequently improve. Similarly, the relationship lender could
not unduly increase the interest rate in case of a covenant violation. A PSD contract thus
limits the discretion of the lender. Since hold-up is more likely in repeated relationship
Hypothesis 1. Relationship loans are more likely to include performance-pricing provi-sions than non-relationship loans.
Covenant violations in particular expose borrowers to the possibility of hold-up. To
protect against hold-up in these situations, borrowers would need to pre-specify the terms
that apply if the firm were to violate a covenant. Covenants on a firm’s leverage ratio
are frequent, while covenants on a firm’s credit rating are virtually non-existent. We
therefore expect Hypothesis 1 to hold primarily for PSD based on the same performance
measures as used in debt covenants, i.e. accounting-based PSD.
Santos and Winton (2008) argue that the severity of the hold-up problem can vary
systematically across different types of borrowers. For example, the degree to which
a borrower is "locked in" in a lending relationship depends on the availability of other
financing sources, such as public bond market access, and the opaqueness of the borrower.
This gives rise to a second hypothesis:
Hypothesis 2. Firms with fewer outside financing alternatives that borrow from a rela-tionship lender are more likely to use performance-sensitive debt.
One can differentiate between purely interest-increasing and purely interest-decreasing
PSD. Interest-increasing pricing grids allow for rate increases only, while interest-decreasing
pricing grids allow for rate decreases only. There is no obvious connection between
interest-decreasing PSD and covenants. However, if PSD is used to pre-specify the
substitution effect between the use of interest-increasing PSD and the threshold at which
a covenant ultimately kicks in. We therefore test the following hypothesis.
Hypothesis 3. Interest-increasing performance-sensitive loans have less tight covenants on the same performance measure, which is also used in the pricing grid.
Manso et al. (2010) argue that PSD is used to signal a firm’s credit quality, which
should apply primarily to rating-based PSD. For the signal to be credible, issuers’ credit
rating should improve on average following the issuance of rating-based PSD. Manso
et al. (2010) show that this is indeed the case. If accounting-based PSD are motivated by
hold-up considerations, then there is reason to observe systematic improvements in credit
quality following the issuance of accounting-based PSD. We therefore test the following
hypothesis.
Hypothesis 4. Issuer credit ratings improve following the issue of rating-based PSD, but do not change systematically following the issue of accounting-based PSD.
II.
Data Description
We obtain our loan sample from the Thomson Reuters Loan Pricing Corporation Dealscan
(LPC’s Dealscan) database, which contains detailed information on corporate loan
is-sues. We restrict our sample to loans issued by U.S. non-financial borrowers between
1990 and 2009. Following Tchistyi et al. (2011), we further restrict our sample to loans
can consist of several different tranches, each with potentially different contract
charac-teristics. Since we perform our analysis with loan-level data, we either calculate sums
or value-weighted averages over all loan tranches, where the weights are determined by
the relative tranche amounts. We obtain information on loan characteristics such as
maturity, the loan amount (scaled by total assets), number of covenants, as well as the
loan purpose and loan type. In addition, we record whether a loan is secured or not.
We then merge our loan data with borrower-specific information obtained from Standard
and Poor’s Compustat North America database, such as firm size, market-to-book etc.,
from the last available fiscal quarter before the loan issue.12 The Appendix contains the
definitions of all variables used in our analysis.
A.
Performance-Sensitive Debt Contracts
Dealscan reports whenever performance pricing provisions are included in a loan contract.
The most common performance measure used in PSD contracts is the Debt-to-EBITDA
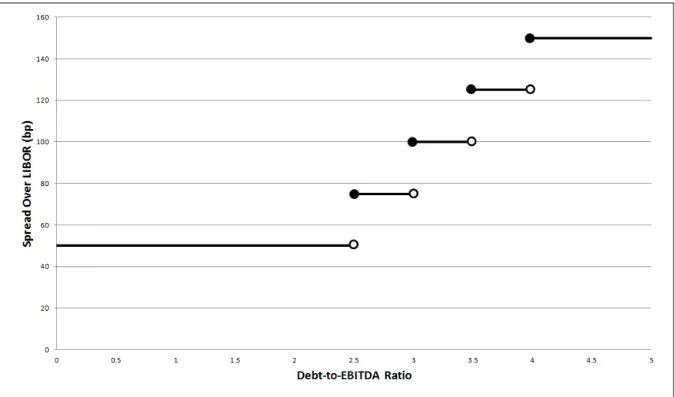
ratio (∼ 44% of all PSD loans issued by U.S. borrowers) followed by the issuer’s senior debt rating (∼27%). Dealscan also reports the exact pricing grid, i.e. the function which links the coupon payments to the performance measure. Figure 1 shows the pricing
grid of a loan issued by Urban Outfitters Inc. in September 2007. The spread paid
by Urban Outfitters increases with its Debt-to-EBITDA ratio (accounting-based PSD).
Urban Outfitter’s Debt-to-EBITDA ratio at the time of the issue was 4, meaning that
12We use Michael Robert’s Dealscan-Compustat Linking Database to merge Dealscan with Compustat
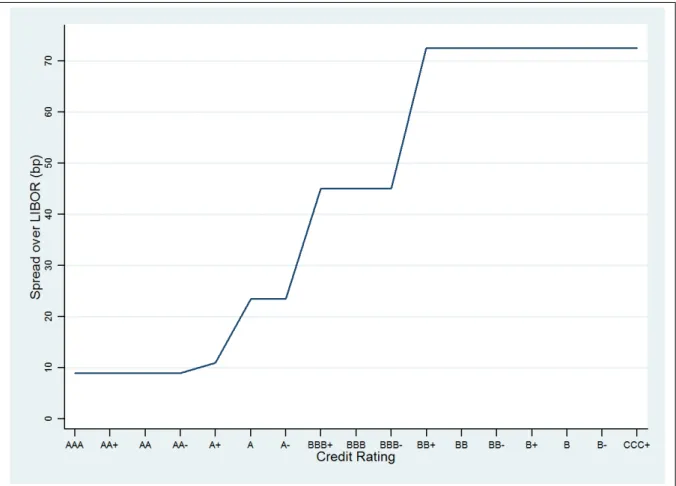
this loan is an example of a rate-increasing contract. Figure 2 shows the pricing grid of a
loan issued by IBM in March 2004. In this contract, the loan spread changes with IBM’s
senior debt rating (rating-based PSD). Since IBM’s senior debt rating at the time of the
issue was A+, this loan is an example of a rate-increasing and rate-decreasing contract.
[Figures 1 & 2 here]
B.
Measuring Relationship Strength
We follow Bharath et al. (2011) and construct three proxies for the strength of the lending
relationship between borrower and lender. To construct these proxies, we first need to
identify the lead lender(s) for each loan contract. As in Sufi (2007), we classify a lender
as the lead lender if the variable "Lead Arranger Credit" (provided by LPC’s Dealscan)
takes on the value "Yes", or if the lender is the only lender specified in the loan contract.
Next, we search the borrowing record of the borrower over the past five years. The first
proxy for the strength of the lending relationship, Rel(Dummy), is a dummy variable
which equals one if the firm borrowed from the same lead lender in the previous five
years and zero otherwise.13 If there are multiple lead lenders in a loan, we calculate the
proxy separately for each lender and assign the highest value to the loan. The second
13Note that Dealscan often classifies borrowers at the subsidiary level. E.g. General Electric Capital
Canada and General Electric Capital Corp of Puerto Rico are two distinct borrowers in Dealscan. By using the Michael Robert’s Dealscan-Compustat Linking Database, all wholly-owned subsidiaries are effectively aggregated under the ultimate parent. We also manually aggregate the lenders under the ultimate parent. (E.g. Lehman Brothers Inc [Frankfurt] and Lehman Brothers Asia are two distinct lenders in Dealscan). This procedure is important to ensure that, e.g. a switch from Lehman Brothers Inc [Frankfurt] to Lehman Brothers Asia is not classified as an actual lender switch. Not aggregating the borrowers and lenders under the ultimate parent, however, does not affect our results qualitatively.
proxy,Rel(Number), measures the relative number of loans obtained from the relationship
lender. For bank m lending to borroweri, it is calculated as follows.
Rel(N umber)m =
Number of loans by bank m to borrower i in the last 5 years Total number of loans by borrower i in the last 5 years
Again, the highest value is assigned to a loan if there are multiple lead lenders. The
third proxy, Rel(Amount), measures the relative loan amounts obtained from the
rela-tionship lender. For bank m lending to borroweri, it is calculated as follows.
Rel(Amount)m =
Amount of loans by bank m to borrower i in the last 5 years ($) Total amount of loans by borrower i in the last 5 years ($)
Again, the highest value is assigned to a loan if there are multiple lead lenders.
C.
Measuring the Tightness of Covenants
As noted by Demiroglu and James (2010), covenant slack, i.e. the difference between the
covenant variable at the initiation of the loan agreement and the covenant threshold, is an
intuitive measure for covenant tightness. However, the degree of tightness also depends
on the volatility of the covenant variable and is thus firm-specific. We therefore follow
covenant variable at the initiation of the loan agreement and the covenant threshold,
normalized by the standard deviation of the covenant variable over the previous twelve
quarters.14
Since in practice, leverage and liquidity ratios are defined in various ways we restrict
our analysis to covenants on the Debt-to-EBITDA ratio, which, as Demiroglu and James
(2010) note, has the most consistent definition (see also Dichev and Skinner (2002)).
D.
Descriptive Statistics
Table 1 presents descriptive statistics for our sample consisting of 17,902 loans issued by
4,769 distinct borrowers between 1990 and 2009. Following Bharath et al. (2011), the
data are winsorized at the 1% and 99% levels to remove outliers. Panel A reports loan
characteristics which are consistent with prior studies (e.g. Sufi (2007)). For example, the
mean/median deal amounts in our sample are $415/$175 million, which is large given the
mean/median book value of assets of $4,034/$783 million and an average leverage ratio
of 25%. The average all-in-drawn spread is 161 basis points, and the average maturity is
3.5 years. 77% of loans are credit lines. Loan contracts on average include 1.6 covenants,
ranging from 0 to 8. Consistent with Manso et al. (2010), roughly 50% of loans include a
14The tightness of covenants can also be measured by a covenant intensity index that ranges from zero
to six, with higher values indicating stricter covenants as proposed by Bradley and Roberts (2004). The index is constructed by summing indicator variables on dividend restrictions, equity sweep, asset sweep, debt sweep, securitization and a binary variable that equals one if the contract includes two or more financial covenants. Murfin (2011) further considers covariation between the different covenant variables when measuring contract strictness. We do not use these indices in our context because we are interested in the tightness of a particular covenant, i.e. the covenant on the same ratio, which is used in the loan pricing grid.
performance-pricing provision. Panel B reports borrower characteristics. Most loans are
issued by borrowers that have a credit rating around the investment grade threshold. In
47% of cases, borrowers do not have a credit rating at all. Panel C reports descriptive
statistics on the three relationship lending proxies. A lending relationship exists in 59%
of all loan contracts. On average, 35% of the total capital raised over the course of 5
years was raised from the same lead lender.
[Table 1 here]
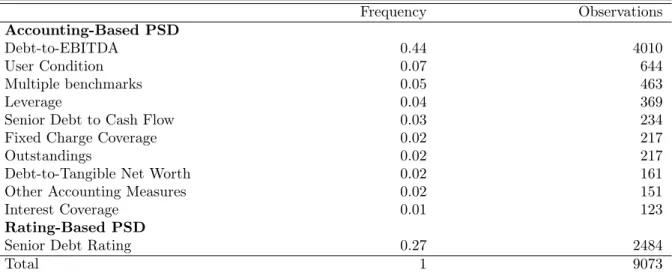
Table 2 shows the various performance measures used in PSD contracts. The most
common performance measure is the Debt-to-EBITDA ratio (44%), followed by the senior
debt rating (27%). The remaining performance measures are various leverage ratios. In at
least 5% of cases, multiple performance measures are used. We define PSD as
accounting-based PSD whenever an accounting ratio is used as a measure of firm performance.
Rating-based PSD comprise all PSD contracts, which use the borrower’s credit rating as
a performance measure.
III.
Results
A.
Lending Relationships and the Use of Performance-Sensitive
Debt
We begin by analyzing the interaction between lending relationships and the choice
be-tween PSD and straight debt. As noted in Section II, we distinguish bebe-tween
accounting-based and rating-accounting-based PSD. We therefore estimate a multinomial logistic regression.
P SDit=α+αInd+αt+αRat+β∗Rel(M)it+γ∗Xit+it (1)
The dependent variable, P SD, is a discrete variable, which equals one if the loan
contract contains a performance pricing provision on an accounting measure, two if the
loan contract includes a performance pricing provision on the borrower’s credit rating,
and zero in the case of straight debt (control group). Rel(M)represents one of our three
measures of relationship strength, andX are control variables to control for heterogeneity
in borrower and loan characteristics. We follow Manso et al. (2010) and use firm size,
measured by the log of total assets, the market-to-book ratio of assets, leverage, the loan
amount (scaled by total assets), the deal maturity, indicator variables for credit lines
and secured loans, and the number of covenants as control variables. We also include
industry fixed effects and dummy variables for each rating level. We cluster the standard
errors at the firm level to account for non-independent observations within firms. Table
3 reports the regression results.
[Table 3 here]
Consistent with Hypothesis 1, we find that relationship strength is positively and
sig-nificantly correlated with the use of accounting-based PSD, while relationship strength
appears to be uncorrelated with the use of rating-based PSD. Consistent with the existing
literature on PSD (e.g. Tchistyi et al. (2011)), larger borrowers, larger loan amounts and
credit lines are more likely to include a performance pricing provision. Loan maturity
is positively correlated with the use of accounting-based PSD, which is consistent with
our hypothesis that performance pricing provisions are used in contracts with a higher
renegotiation likelihood. Loan contracts are more likely to be renegotiated if the
matu-rity is longer. We further find that secured loans are less likely to include a rating-based
performance pricing provision, but more likely to include an accounting-based
perfor-mance pricing provision. These initial results show that it is the accounting-based PSD
contracts which may be motivated by hold-up due to lending relationships, while
rating-based PSD are more likely to be motivated by other considerations such as signaling or
asset-substitution. In the following analysis, we therefore exclude rating-based PSD and
return to the issue of signaling in Section IV.
The decision to form and stay in a lending relationship is clearly an endogenous choice
(2010), Bharath et al. (2011), Coval and Moskowitz (2001), Dass and Massa (2011),
De-gryse and Ongena (2005), Norden and Weber (2010), and Petersen and Rajan (2002).
We follow this literature and use the geographic distance between the borrower and the
lead lender as an instrument for relationship strength. This instrument is likely to be
correlated with the decision to form a lending relationship but unlikely to be correlated
with the decision to include a performance pricing provision in the loan contract. Lenders
that are physically closer to a borrower are more likely to have better information about
a borrower, and are hence more likely to become a relationship lender. We match the
location of the borrowers’ and lenders’ headquarters, provided by Dealscan, to the
Max-Mind World Cities Database to obtain information on the longitude and latitude.15 We are always able to identify the lender and the borrower location in MaxMind if the
infor-mation on the location is provided by Dealscan. We treat observations as missing if the
exact location of the lender or the borrower is not specified in Dealscan, which reduces the
sample by 2,001 observations. We calculate the distance in miles between the borrower
and the lead lender for each deal.16 We follow Petersen and Rajan (2002) and address
skewness in the distance measure by using ln(1 +Distance)in the regressions.
Table 4 reports the results of the IV-estimation using linear probability models in
computing 2SLS estimates and correcting the standard errors for heteroskedasticity.17
15The MaxMind database contains geographical information for about 3 million places in 234 countries
and is publicly available at http://www.maxmind.com/app/worldcities.
16We use the same estimation formula as in Dass and Massa (2011). We assign the minimum distance
to the deal in case of multiple lead lenders. See the appendix for further details.
17Angrist and Pischke (2009) argue that this procedure yields consistent estimates. Several studies find
that linear probability models produce results similar to partial effects from more precise models (see e.g. Angrist and Pischke (2009) and Katz et al. (2001)). However, our results are not sensitive to the question of whether we use linear probability models or bivariate probit models as advocated by
Consistent with Bharath et al. (2011), we find that ln(1 + Distance) is significantly
negatively correlated to all three proxies for lending relationship strength, confirming the
validity of the inclusion restriction. The results of the second stage regressions confirm
our previous results that PSD contracts are more likely to be used in the presence of
bank lending relationships. In fact, PSD contracts are about 35% more likely to be
used in repeated lending relationships after we control for the endogeneity of the lending
relationship, which is statistically and economically very significant.18
[Table 4 here]
Our results so far show that relationship lending is positively correlated with the use
of PSD, which is consistent with our hypothesis that PSD reduces a potential hold-up
problem in repeated lending relationships. However, the severity of the hold-up problem
is likely to vary systematically across different types of borrowers. To obtain further
identification, we consider cross-sectional differences in the strength of this correlation.
For example, the severity of the hold-up problem is likely to depend on the opacity of
the borrower as well as its alternative financing options. Following Bharath et al. (2011),
we use firm size as well as a dummy variable which equals one if the borrower does not
have a S&P rating (and zero otherwise) as proxies for firm opacity. Another proxy for
Heckman (1978).
18As in other studies that use instruments in relationship lending settings, the economic significance
strongly increases in the IV-estimation. For example, Bharath et al. (2011) use IV regressions to examine the impact of lending relationships on loan spreads and find that the effect is more than 5 times stronger when using the distance between borrower and lender as an instrument for relationship lending. Berger et al. (2005) use IV regressions to examine the relationship between bank size and the exclusivity of bank-borrower relationships. Instrumenting bank size, they show a large increase in economic importance of bank size when compared to the OLS estimates.
opacity is membership in the S&P 500 Index due to higher media and analyst coverage of
these companies. Larger firms and rated firms are more likely to have multiple financing
alternatives, and are thus less "locked in" in a bank lending relationship. We also use
a dummy variable which equals one if a loan is syndicated, because firms borrowing
from a syndicate should suffer less from hold-up problems. Another concern is that our
results may be driven by a small number of lenders because, as Ross (2010) points out,
the market for syndicated loans is dominated by three large banks.19 To address this concern, we follow Bharath et al. (2011) and include a dummy variable which equals one
for loans made by one of the top 3 banks and zero otherwise.
To test for the cross-sectional variation in the severity of the hold-up problem induced
by lending relationships, we estimate the following logit model.
P SDit=α+αInd+αt+αRat+β1∗Rel(M)it+β2∗BorrowerOpacityit
+β3∗Rel(Dummy)it∗BorrowerOpacityit+γ∗Xit+it
(2)
The dependent variable, P SD, is a dummy variable which equals one if a loan
con-tract includes a performance pricing provision and zero otherwise. Rel(Dummy) is the
indicator variable for the presence of a lending relationship. BorrowerOpacityrepresents
the above-mentioned proxies for borrower opacity. We include interaction variables of
re-lationship strength andBorrowerOpacity to examine the cross-sectional variation of the
PSD-sensitivity. Due to the high correlation of the interaction variables, we include one
at a time in the regressions. The results are reported in Table 5.
[Table 5 here]
The coefficients of all interaction variables of borrower opacity are negative and
sta-tistically significant, which is consistent with our hypothesis that opacity, and thus fewer
alternative financing options, increases the severity of hold-up, and hence increases the
likelihood of using PSD. In particular, the negative coefficient on Rel(Dummy)*ln(Assets)
shows that PSD is less frequently used in relationship lending arrangements if the
com-pany is large and hence less opaque. The negative coefficient on Rel(Dummy)*Rated
implies that companies which repeatedly borrow from the same lender but do not have
a credit rating are more likely to use PSD. Similar conclusions can be drawn from the
regression in Column 3, which uses membership in the S&P 500 Index as a proxy for
borrower opacity. Overall, our results support the hypothesis that the hold-up problem
and thus the benefit of using PSD contracts is larger for more opaque borrowers.
A potential concern is that our loan sample is drawn from the LPC’s Dealscan
database, which contains large and predominantly – albeit not exclusively – syndicated
loans. In general, firms in this sample should suffer less from hold-up problems than
smaller firms. However, as noted by Santos and Winton (2008), using Dealscan should, if
anything, create a bias against finding evidence of opportunistic bank behavior.
are less severe for syndicated loans, performance pricing provisions should be used less
fre-quently in syndicated loans. The results reported in Table 5 confirm this hypothesis. The
coefficient on Rel(Dummy)*Syndication is negative and statistically highly significant.20
This result is in contrast to the renegotiation cost hypothesis proposed by Asquith
et al. (2005). According to this hypothesis, the use of PSD should be more likely in
syndicated loans because renegotiation costs are higher if a loan is syndicated. However,
we find the opposite to be the case.
Another concern is that the market for syndication is dominated by three large banks.
We follow Bharath et al. (2011) and address this issue by including a dummy variable
in our main regression which equals one if a loan is made by one of the top 3 banks
and zero otherwise. Performance-sensitive debt should be less frequently used if the
lending relationship is with one of the top 3 banks, because the top 3 banks are mostly
transaction-oriented, so that hold-up problems are less severe in relationships with these
lenders. The results reported in Table 5 confirm this hypothesis. The coefficient on
Rel(Dummy)*Top-3 Bank is significantly negative. Rel(Dummy) remains positive and
highly significant.21
20Our results are robust to excluding all syndicated loans from the sample and focusing exclusively on
single-lender loans. The effect forRel(Dummy)remains positive and highly significant at the 1% level
with a marginal effect of 8%. These results are available from the authors upon request.
21We also find that our results hold if we exclude all loans made by the top 3 banks from our sample.
B.
Performance-Sensitive Debt and Covenants
In this section, we investigate whether there is a substitution effect between the use
of performance pricing grids and the tightness of financial covenants. In particular,
Hypothesis 3 states that PSD contracts should have less tight covenants because the
pricing grid pre-specifies the consequences of small changes in a borrower’s performance,
while only larger changes in a borrower’s performance trigger a renegotiation due to
covenant violations.
[Table 6 here]
Table 6 compares the frequency of covenant usage in PSD and straight debt contracts.
Consistent with covenants increasing the likelihood of hold-up, we find that covenants
are more commonly used in PSD contracts than in straight-debt contracts. Over 50%
of PSD contracts include a covenant on Debt-to-EBITDA, while only 11% of non-PSD
contracts include such a covenant. This fraction is even higher for debt which contains
Debt-to-EBITDA pricing provisions: 86% of such PSD contracts also have a covenant on
Debt-to-EBITDA (not reported).
[Table 7 here]
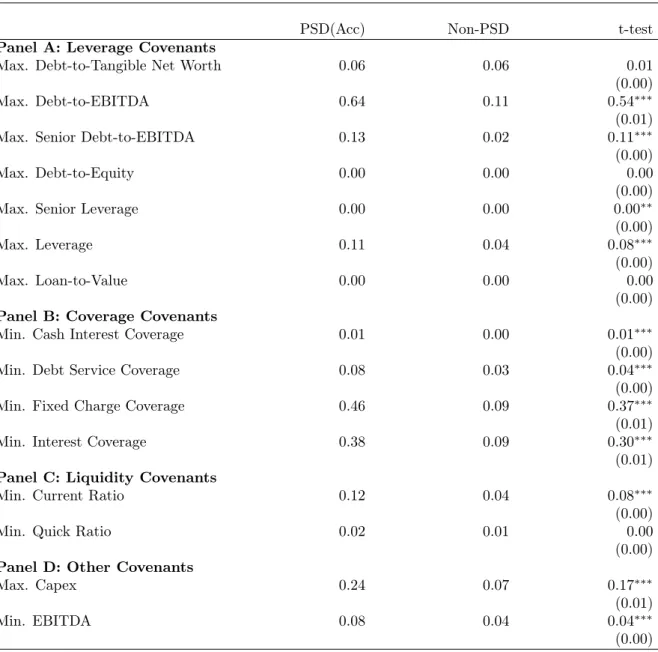
Table 7 compares the covenant threshold levels used in PSD and non-PSD contracts.
thresholds than non-PSD contracts. For example, the median Debt-to-EBITDA covenant
level for PSD contracts is 3.5, with 3.75 for non-PSD contracts. This appears not to
be supportive of Hypothesis 3. However, PSD and non-PSD are not unconditionally
comparable, since borrower characteristics differ. A multivariate analysis is called for.
Furthermore, we now need to distinguish between increasing and
interest-decreasing PSD, because only interest-increasing PSD contracts should have an effect
on covenant tightness. Interest-decreasing performance pricing provisions matter only if
a borrowers performance improves. To ensure that covenants and a loan’s performance
pricing grid are based in the same variable, we restrict our analysis to covenants on the
Debt-to-EBITDA ratio, which is the most frequently used performance measure in our
sample.
Following Demiroglu and James (2010), we calculate the covenant tightness as the
absolute difference between the Debt-to-EBITDA ratio at the initiation of the loan
agree-ment and the Debt-to-EBITDA covenant threshold, normalized by the standard deviation
of the borrower’s Debt-to-EBITDA ratio over the previous twelve quarters. A lower ratio
indicates a tighter covenant.22 We then estimate the following regression by OLS.
T ightnessit =α+αInd+αt+αRat+β1∗IncreasingP SDit
+β2∗M ixedP SDit+β3∗DecreasingP SDit+γ∗Xit+it
(3)
22We lose observations because we require 12 quarters before the loan issue with non missing observations
The dependent variable,T ightness, is the tightness of the Debt-to-EBITDA covenant
as defined above. X represents loan and borrower characteristics. As before, we control
for time, industry and rating fixed effects. IncreasingP SD is a dummy variable which
equals one if the loan contains a pricing grid on Debt-to-EBITDA that only allows for
interest rate increases. DecreasingP SD is a dummy variable which equals one if the loan
contains a pricing grid on Debt-to-EBITDA that allows for interest rate decreases only,
andM ixedP SD is a dummy variable which equals one if the loan contains a pricing grid
on Debt-to-EBITDA that allows for both interest rate increases and decreases.
[Table 8 here]
As shown in Table 8, we find that interest-increasing PSD contracts have significantly
less tight Debt-to-EBITDA covenants than straight debt. This is consistent with our
hy-pothesis that performance-pricing affects covenant tightness: small changes in the credit
risk of the borrower are regulated by performance-pricing provisions and not by tight
covenants. We further find that more highly levered borrowers and loans with a larger
number of covenants have tighter Debt-to-EBITDA covenants. Borrowers with more
growth opportunities have less tight covenants.23
23The accuracy and coverage of covenants reported in the Dealscan database has improved over time.
However, our results are not sensitive to this issue and remain virtually unchanged if we restrict the sample to loans issued after 2000. These results are available upon request.
IV.
Robustness: Hold-up vs. Signaling
Manso et al. (2010) show that PSD can be used as a signaling device to signal a firm’s
credit quality. Only borrowers who expect their credit ratings not to deteriorate are
willing to enter into contracts that stipulate interest rate increases should the firm’s
credit rating decline. To test whether signaling explains the use of rating-based PSD,
Manso et al. (2010) analyze the post-issue credit rating development for firms that issue
PSD vs. firms that issue straight debt. We replicate their analysis, but further distinguish
between accounting-based and rating-based PSD, because the signaling hypothesis should
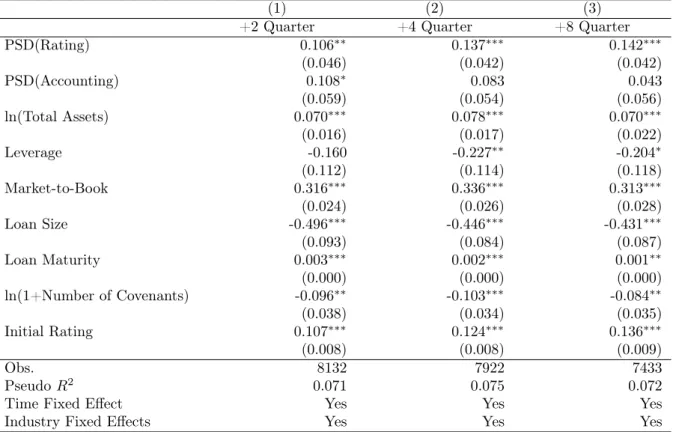
predominantly apply to rating-based PSD, while the hold-up hypothesis predominantly
applies to accounting-based PSD. In particular, we reestimate the following ordered probit
regression.
∆Ratingit =α+αInd+αt+β1 ∗P SD(Rat)it
+β2∗P SD(Acc)it+γ∗Xit+it
(4)
Following Manso et al. (2010), ∆Ratingi is a discrete variable that takes on one of
three values: 1 if the borrower’s credit rating improved in the first k quarters after the
loan issue, -1 if the borrower’s credit rating declined in the first k quarters after the loan
issue, and 0 if the borrower’s credit rating remained unchanged (k=2, 4, 8). P SD(Rat)
credit rating, whileP SD(Acc)i is a dummy variable which equals one if the loan contains
a pricing grid on an accounting measure. The regression results are reported in Table 9.
[Table 9 here]
Consistent with the results reported by Manso et al. (2010), we find that firms are
more likely to experience a rating improvement up to two years after issuing a
rating-based PSD relative to borrowers who issued regular debt. However, our results show that
this does not hold for accounting-based PSD. Accounting-based PSD contracts are thus
unlikely to be motivated by signaling considerations.
V.
Conclusion
Von Thadden (1995) argues that pre-specifying loan contract terms can be an efficient
way to mitigate hold-up problems in long-term lending relationships. An example is
performance-sensitive debt (PSD), which pre-specifies loan contract terms in events that
would otherwise trigger debt renegotiation. In this paper, we test the hypothesis that
accounting-based PSD is used to reduce potential hold-up problems in bank lending
relationships.
Consistent with this hypothesis, we find that accounting-based PSD contracts are
more likely to be used in relationship lending arrangements. This is especially the case
greater potential for hold-up. Furthermore, syndication appears to reduce the need for
accounting-based PSD because hold-up is less likely in syndicated debt deals.
We also find a substitution effect between the pricing grid and the tightness of
covenants. The Debt-to-EBITDA covenants of PSD contracts are less tight than the
covenants of non-PSD contracts. This substitution effect is consistent with the
recom-mendation by Von Thadden (1995) to pre-specify contract terms to mitigate hold-up.
In contrast to accounting-based PSD, the use of rating-based PSD is not correlated
with relationship strength. Furthermore, while the issue of rating-based PSD is
fol-lowed by rating improvements on average, this is not the case for accounting-based PSD.
These results indicate that hold-up is an important determinant in the decision to issue
References
Agarwal, S. and R. Hauswald (2010). Distance and private information in lending. Review
of Financial Studies 23, 2757–2788.
Angrist, J. D. and J.-S. Pischke (2009). Mostly Harmless Econometrics: An Empiricists
Companion. Princeton University Press.
Asquith, P., A. Beatty, and J. Weber (2005). Performance pricing in bank debt contracts.
Journal of Accounting and Economics 40, 101–128.
Berger, A. N., N. H. Miller, M. A. Petersen, R. G. Rajan, and J. C. Stein (2005). Does
function follow organizational form? evidence from the lending practices of large and
small banks. Journal of Financial Economics 72, 237–69.
Berger, A. N. and G. F. Udell (1995). Relationship lending and lines of credit in small
firm finance. The Journal of Business 68, 351–381.
Berlin, M. and L. J. Mester (1998). On the profitability and cost of relationship lending.
Journal of Banking & Finance 22, 873–897.
Bhanot, K. and A. S. Mello (2006). Should corporate debt include a rating trigger?
Journal of Financial Economics 79, 69–98.
Bharath, S., S. Dahiyab, A. Saunders, and A. Srinivasan (2007). So what do i get? the
Bharath, S. T., S. Dahiya, A. Saunders, and A. Srinivasan (2011). Lending relationships
and loan contract terms. The Review of Financial Studies 24, 1142–1203.
Boot, A. W. A. (2000). Relationship banking: What do we know? Journal of Financial
Intermediation 9, 7–25.
Boot, A. W. A. and A. V. Thakor (2000). Can relationship banking survive competition?
The Journal of Finance 55, 679–713.
Bradley, M. and M. R. Roberts (2004). The structure and pricing of corporate debt
covenants. Working Paper.
Chava, S. and M. R. Roberts (2008). How does financing impact investment? the role of
debt covenants. Journal of Finance 63, 2085 – 2121.
Coval, J. D. and T. J. Moskowitz (2001). The geography of investment: Informed trading
and asset prices. Journal of Political Economy 109, 811–841.
Dass, N. and M. Massa (2011). The impact of a strong bank-firm relationship on the
borrowing firm. Review of Financial Studies 24, 1204–1260.
Degryse, H. and P. V. Cayseele (2000). Relationship lending within a bank-based system:
Evidence from european small business data. Journal of Financial Intermediation 9,
90–109.
Degryse, H. and S. Ongena (2005). Distance, lending relationships, and competition. The
Demiroglu, C. and C. M. James (2010). The information content of bank loan covenants.
Review of Financial Studies 23, 3700–3737.
Dichev, I. D. and D. J. Skinner (2002). Large-sample evidence on the debt covenant
hypothesis. Journal of Accounting Research 40, 1091–1123.
Elsas, R. and J. P. Krahnen (1998). Is relationship lending special? evidence from
credit-file data in germany. Journal of Banking & Finance 22, 1283Ű1316.
Farinha, L. A. and J. A. C. Santos (2002). Switching from single to multiple bank lending
relationships: Determinants and implications. Journal of Financial Intermediation 11,
124–151.
Freudenberg, F., B. Imbierowicz, A. Saunders, and S. Steffen (2011). Covenant violations,
loan contracting, and default risk of bank borrowers. Working Paper.
Hale, G. and J. A. C. Santos (2009). Do banks price their informational monopoly?
Journal of Financial Economics 93, 185–206.
Heckman, J. J. (1978). Dummy endogenous variables in a simultaneous equation system.
Econometria 46, 931–959.
Houston, J. F. and C. M. James (1996). Bank information monopolies and the mix of
private and public debt claims. The Journal of Finance 51, 1863–1899.
Katz, L. F., J. R. Kling, and J. B. Liebman (2001). Moving to opportunity in boston:
Early results of a randomized mobility experiment. The Quarterly Journal of
Koziol, C. and J. Lawrenz (2010). Optimal design of rating-trigger step-up bonds: Agency
conflicts versus asymmetric information. Journal of Corporate Finance 16, 182–204.
Manso, G., B. Strulovici, and A. Tchistyi (2010). Performance-sensitive debt. Review of
Financial Studies 23, 1819–1854.
Mattes, J. A., S. Steffen, and M. Wahrenburg (2012). Do information rents in loan spreads
persist over the business cycles? Journal of Financial Services Research, 1–21.
Murfin, J. (2011). The supply-side determinants of loan contract strictness. The Journal
of Finance, forthcoming.
Nikolaev, V. V. (2011). Scope for renegotiation and debt contract design. Working Paper.
Norden, L. and M. Weber (2010). Credit line usage, checking account activity, and default
risk of bank borrowers. Review of Financial Studies 23, 3665–3699.
Ongena, S. and D. C. Smith (2000). What determines the number of bankrelationships?
cross-country evidence. Journal of Financial Intermediation 9, 26–56.
Petersen, M. and R. Rajan (1995). The effect of credit market competition on lending
relationships. Journal of Quarterly Economics 110, 406–443.
Petersen, M. A. and R. G. Rajan (1994). The benefits of lending relationships: Evidence
from small business data. The Journal of Finance 49, 3–37.
Petersen, M. A. and R. G. Rajan (2002). Does distance still matter? the information
Rajan, R. G. (1992). Insiders and outsiders: The choice between informed and
arm’s-length debt. The Journal of Finance 47, 1367–1400.
Ross, D. G. (2010). The ”dominant bank effect:” how high lender reputation affects
the information content and terms of bank loans. Review of Financial Studies 23,
2730–2756.
Santos, J. A. C. and A. Winton (2008). Bank loans, bonds, and information monopolies
across the business cycle. The Journal of Finance 63, 1315–1359.
Saunders, A. and S. Steffen (2011). The costs of being private: Evidence from the loan
market. Review of Financial Studies 24, 4091–4122.
Schenone, C. (2010). Lending relationships and information rents: Do banks exploit their
information advantages? Review of Financial Studies 23, 1149–1199.
Schmidt, K. M. (2006). The economics of covenants as a means of efficient creditor
protection. European Business Organization Law Review 7, 89–94.
Sharpe, S. A. (1990). Asymmetric information, bank lending and implicit contracts: A
stylized model ofcustomer relationships. The Journal of Finance 45, 1069–1087.
Sufi, A. (2007). Information asymmetry and financing arrangements: Evidence from
syndicated loans. The Journal of Finance 62, 629–668.
Tchistyi, A., D. Yermack, and H. Yun (2011). Negative hedging: Performance-sensitive
debt and ceos’ equity incentives. Journal of Financial and Quantitative Analysis 46,
Von Thadden, E.-L. (1995). Long-term contracts, short-term investment and monitoring.
A
App
endix
A.
V
ariable
Definit
ions
T able A.I: V ariable Definitions V ariable Name Definition (Compustat Ite m #) Source L o an char acteristics PSD (Rating) A dumm y v ariable whic h equals one if the loan includes a p erformance pricing pro vi-sion based on the firm’s credit rating. Dealscan PSD (A ccoun ting) A dumm y v ariable whic h equals one if the loan includes a p erformance pricing pro vi-sion based on an accoun ting measure. Dealscan Increasing PSD A dumm y v ariable whic h equals one if the pricing grid allo ws for in terest rate increases only . Dealscan Mixed PSD A dumm y v ariable w hic h equals one if the pricing grid allo ws for b oth in terest rate increases and in terest rate decreases. Dealscan Decreasing PSD A dumm y v ar ia b le whic h equals one if the pricing grid allo ws for in terest rate decreases only . Dealscan Loan Amoun t T otal loan amoun t of all loan tranc hes in million USD. Dealscan Con tin ued on next pageT able A.I – con tin ued from p re vious page V ariable Name Definition (Compustat Ite m #) Source Loan Size Deal amoun t divided b y total assets (#44). Dealscan & Comp ustat Loan All-in-dra w n Spread Initial all in dra wn spread o v er LIBOR. Dealscan Loan Maturit y Time to maturit y in Mon ths. Dealsc an Credit Line A dumm y v ariable whic h equals one if the typ e of at least one of the loan tr an ches is sp ecified as e ither "Rev olv er/Line >= 1 Y r." or "Rev olv er/Line < 1 Y r.". Dealscan Secured A dumm y v ariable whic h equals one if the loan is secured. Dealscan Num b er of Co v enan ts The total n um b er of c o v enan ts included in the loan con tract. Dealscan Co v en a n t Tigh tness (Debt-to-EBITD A -Debt-to-EBITD A-Co v e nan t-Threshold) divided b y the standard deviation of Debt-to-EBITD A o v er the previous tw elv e quarters. Dealscan Purp ose: General A dumm y v ar iable wh ic h equals one if the loan purp ose is sp ecified as "corp orate purp ose". Dealscan Purp ose: Refinance A dumm y v ariable whic h equals one if the loan purp ose is sp ecified as "debt repa y-men t". Dealscan Purp ose: T ak eo v er A dumm y v ariable whic h equals one if the lo an purp ose is sp ecified as "tak eo v er" of "acquisition". Dealscan Con tin ued on next page
T able A.I – con tin ued from p re vious page V ariable Name Definition (Compustat Ite m #) Source Purp ose: W orking Capital A dumm y v ariable whic h equals one if the loan p ur p ose is sp ecified as "w orking capital". Dealscan T op-3 Bank A dumm y v ariable whic h e q u a ls one if either J.P . Morgan Chase, Bank of America, or Citigroup is the lead arranger of a loan. Dealscan Syndication A d umm y v ariable whic h equals one if the loan is syndicated. Dealscan Distance The spherical distance b et w een the b orro w er’s headquarter and the lender’s headquar-ter in miles. The distance b et w een bank i and b orro w er j is calculated as follo ws: di,j = ar c cos ( deg latl on ) ∗ r , where: Dealscan & MaxMind r = the radius of Earth in miles, and deg latl on = cos ( lat i ) ∗ cos ( lon i ) ∗ cos ( lat j ) ∗ cos ( lon j ) + cos ( lat i ) ∗ sin ( lon i ) ∗ cos ( lat j ) ∗ sin ( lon j ) + sin ( lat i ) ∗ sin ( lat j ) lat and lon refer to the latitude and longitude in radians (con v erted from degrees b y m ultiplying with π /180). Borr ower ch ar acteristics T otal Assets T otal b o ok v alue of assets (#44) in million USD. Compustat Lev erage Long-term debt (#51) divided b y total assets (#44). Compustat Con tin ued on next page
T able A.I – con tin ued from p re vious page V ariable Name Definition (Compustat Ite m #) Source Mark et-to-Bo ok Mark et v alue of the firm (#14 * # 61 + #44 -#59) divided b y the b o ok v alue of assets (#44). Compustat S&P 500 C o n stituen t A dumm y v ariable whic h equals one if the b orro w er w as a constituen t compan y of the S&P 500 Inde x at the time of the loan issue . Compustat Rating AAA ... C(or b elo w) A dumm y v ariable whic h equals one if the b orro w er has a S&P rating of AAA ... C (or b elo w) a t the time of the loan issue. Compustat Debt-to-EBITD A (#51 + #45) divided b y the sum of #21 o v er th e previous 4 quarters. Compustat R elationship L ending Pr oxies Rel(Dumm y) A dumm y v ariable whic h equals one if the firm b orro w ed from at least one of the lead lenders in the fiv e y ears b efore the presen t loan. Dealscan Rel(Num b er) The n um b er of loans from the same lead bank(s) o v er the total n um b e r of loans issued in the last fiv e y ear s b efore the presen t loan. Dealscan Rel(Amoun t) The dollar v alue of loans from the same lead bank(s) o v er the total dollar v alue of all loans issued in the last fiv e y ears b efore the presen t loa n . Dealscan
B.
Figures and Tables
Figure 1: Accounting-Based PSD
This figure shows the pricing grid of a loan issued by Urban Outfitters Inc in 2007. The spread is contingent on the issuer’s Debt-to-EBITDA ratio. The Debt-to-EBITDA ratio at the time of loan issue was 4. The initial spread paid was LIBOR + 150bp.
Figure 2: Rating-Based PSD
This figure shows the pricing grid of a loan issued by IBM in March 2004. The loan spread is a function of IBM’s S&P senior debt rating. IBM’s senior debt rating at the time of loan issue was A+. The initial spread paid was LIBOR + 12bp.
T able 1: Summary Statistics This table rep orts summary statistics for a sample of 17,902 loans issued b y 4,769 non-financial firms b et w een 1990 and 2009. All v ariables are defined in the App endix, T able A.I. Mean Median Std Min Max N P anel A: Loan Characteristics PSD(Rating) 0.15 0.00 0.36 0.00 1.00 17902 PSD(A ccoun ting) 0.35 0.00 0.48 0.00 1.00 17902 Loan Amoun t (mill. USD) 4 14.54 175.00 670.92 5.00 4000.00 17902 Loan All-in-dra wn Spread (bp) 160.89 141.05 115.93 17.50 600.00 17902 Loan Maturit y (mon ths) 43.28 41.00 22.37 5.00 104.20 17902 Credit Line 0.77 1.00 0.42 0.00 1.00 17902 Num b er of Co v enan ts 1.59 1.00 1.59 0.00 8.00 17902 Secured 0.46 0.00 0.50 0.00 1.00 17902 Purp ose: General 0.32 0.00 0.47 0.00 1.00 17902 Purp ose: Refinance 0.21 0.00 0.40 0.00 1.00 17902 Purp ose: T ak eo v er 0.15 0.00 0.36 0.00 1.00 17902 Purp ose: W orking Capital 0.21 0.00 0.41 0.00 1.00 17902 P anel B: Borro w er Characteristics T otal Assets (mio USD) 4034.37 783.30 8624.08 16.71 50832.00 17902 Lev erage 0.25 0.24 0.20 0.00 1.08 17 902 Mark et-to-Bo ok 1.75 1.43 1.01 0.70 6.76 17902 S&P 500 C onstituen t 0.21 0.00 0.41 0.00 1.00 17902 Rating AAA 0.00 0.00 0.06 0.00 1.00 17902 Rating AA 0.02 0.00 0.12 0.00 1.00 17902 Rating A 0.09 0.00 0.29 0.00 1.00 17902 Rating BBB 0.15 0.00 0.36 0.00 1.00 17902 Rating BB 0.13 0.00 0.33 0.00 1.00 17902 Rating B 0.08 0.00 0.27 0.00 1.00 17 902 Rating C (or b elo w) 0.01 0.00 0.10 0.00 1.00 17902 Rated 0.47 1.00 0.00 0.00 1.00 17902 P anel C: Relationship Lending Pro xies Rel(Dumm y) 0.59 1.00 0.49 0.00 1.00 17902 Rel(Num b er) 0.35 0.25 0.38 0.00 1.00 17902 Rel(Amoun t) 0.37 0.25 0.40 0.00 1.00 17902
Table 2: PSD Contract Types
This table reports the types and frequencies of performance-pricing provisions used in our sample of PSD loans. Frequency Observations Accounting-Based PSD Debt-to-EBITDA 0.44 4010 User Condition 0.07 644 Multiple benchmarks 0.05 463 Leverage 0.04 369
Senior Debt to Cash Flow 0.03 234
Fixed Charge Coverage 0.02 217
Outstandings 0.02 217
Debt-to-Tangible Net Worth 0.02 161
Other Accounting Measures 0.02 151
Interest Coverage 0.01 123
Rating-Based PSD
Senior Debt Rating 0.27 2484
T able 3: Lending Relationship s and the Use of P erformance-Sensitiv e Debt This table rep orts the marginal e ffects of m ultinominal logit regressions to ev aluate the lik eliho o ds of using rating based or acc o u n ting based PSD. The dep enden t v ariable equals one if the loan includes a p e rformanc e pricing pro vision based on the credit rating of the b orro w er, tw o if the loan includes a p erformance pricing pro vision based on an accoun ting measure and zero for non p erformance-sensitiv e loan con tracts. Marginal effects for eac h co v ariate are constructed as the difference in predicted probabilities for a particular outcome computed at their mean v alues holding all other co v ariates c o n stan t. All items are define d in the App endix T able A.I. Standard erro rs are heterosk edasticit y robust and clustered at the firm lev el to accoun t for non-ind ep enden t observ ations within firms. *,**,*** Indicate statistical significanc e at the 10%, 5%, 1% lev e l. (1) (2) (3) PSD(Rating) PSD(A ccoun ting) PSD(Rating) PSD(A ccoun ting) PSD(Rating) PSD(A ccoun ting) Rel(Dumm y) 0.004 0.045 ∗∗∗ (0.003) (0.009) Rel(Num b er) 0.009 ∗ 0.091 ∗∗∗ (0.004) (0.012) Rel(Amoun t) 0.006 0.090 ∗∗∗ (0.004) (0.012) Lev erage -0 .0 21 -0.015 -0.020 -0.013 -0.020 -0.014 (0.014) (0.028) (0.01 4) (0.028) (0.014) (0.028) ln(T otal Assets) 0.025 ∗∗∗ 0.030 ∗∗∗ 0.026 ∗∗∗ 0.032 ∗∗∗ 0.025 ∗∗∗ 0.031 ∗∗∗ (0.002) (0.005) (0.00 2) (0.005) (0.002) (0.005) Mark et-to-Bo ok 0.005 ∗∗ 0.002 0.005 ∗∗ 0.002 0.005 ∗∗ 0.002 (0.002) (0.004) (0.00 2) (0.004) (0.002) (0.004) Loan Size 0.040 ∗∗∗ 0.103 ∗∗∗ 0.040 ∗∗∗ 0.103 ∗∗∗ 0.040 ∗∗∗ 0.102 ∗∗∗ (0.007) (0.017) (0.00 7) (0.017) (0.007) (0.017) Loan Maturit y -0.000 0.003 ∗∗∗ -0.000 0.003 ∗∗∗ -0.000 0.003 ∗∗∗ (0.000) (0.000) (0.00 0) (0.000) (0.000) (0.000) Credit Line 0.015 ∗∗∗ 0.192 ∗∗∗ 0.015 ∗∗∗ 0.190 ∗∗∗ 0.015 ∗∗∗ 0.191 ∗∗∗ (0.003) (0.010) (0.00 3) (0.010) (0.003) (0.010) ln(1+Num b er of Co v enan ts) 0.12 5 ∗∗∗ 0.351 ∗∗∗ 0.125 ∗∗∗ 0.353 ∗∗∗ 0.125 ∗∗∗ 0.352 ∗∗∗ (0.007) (0.013) (0.00 7) (0.013) (0.007) (0.013) Secured -0.067 ∗∗∗ 0.031 ∗∗∗ -0.066 ∗∗∗ 0.035 ∗∗∗ -0.067 ∗∗∗ 0.035 ∗∗∗ (0.006) (0.011) (0.0 06) (0.011) (0.006) (0.011) Obs. 17902 17902 17902 17902 17902 17902 A dj. R 2 0.465 0.465 0.467 0.467 0.467 0.467 Time Fixed Effects Y es Y es Y es Y es Y es Y es Industry Fixed Effects Y es Y es Y es Y es Y es Y es Loan Purp ose Fixed Effects Y es Y es Y es Y es Y es Y es Credit Rating Fixed Effects Y es Y es Y e s Y es Y es Y es
T able 4: IV-Estimation: Lending Rela ti o n ships and the Use of A ccoun ting-Based PSD This table rep orts the res ults of instrumen tal v ariable (IV) estimations, using ln(1+Distanc e) as an instrumen t for lending relationships. The sample consists of straigh t loa n s and accoun ting based p erformance sensitiv e loans. The dep enden t v ariables in th e first stage regressions (Columns (1a)-(3 a)) are R el(Dummy) , R el(Numb er) , and R el(A mount) resp ectiv ely . The dep enden t v ariable in the second stage regression (Columns (1b)-(3b)) is a dumm y , whic h equals one if the loan con tract includes an accoun ting based p erformance pricing pro vision and zero otherwise. All other v ariables are defined in the App endix T able A. I. Standard errors a re heterosk edasticit y robust and clustered at the firm lev el to accoun t for n o n -ind ep enden t observ ations within firms. *,**,*** Indicate statistical signific ance at the 10%, 5%, 1% lev el. (1a) (2a) (3a) (1b) (2b) (3b) First Stage Regressions Second Stage Regressions Rel(Dumm y) Rel(Num b er) Rel(Amoun t) PSD(A ccoun tin g ) PS D(A ccoun ting) PSD(A ccoun ting) ln(1+Distance) -0.009 ∗∗∗ -0.011 ∗∗∗ -0.011 ∗∗∗ (0.002) (0.001) (0.001) Rel(Dumm y) 0.361 ∗∗ (0.175) Rel(Num b er) 0.311 ∗∗ (0.144) Rel(Amoun t) 0.312 ∗∗ (0.145) ln(T otal Assets) 0.080 ∗∗∗ 0.021 ∗∗∗ 0.027 ∗∗∗ 0.005 0.028 ∗∗∗ 0.026 ∗∗∗ (0.003) (0.003) (0.003) (0.014) (0.004) (0.004) Lev erage 0.228 ∗∗∗ 0.096 ∗∗∗ 0.105 ∗∗∗ -0.102 ∗∗ -0.049 ∗∗ -0.052 ∗∗ (0.023) (0.018) (0.019) (0.044) (0.023) (0.024) Mark et-to-Bo ok 0.003 0.006 ∗ 0.005 0.000 -0.000 -0.000 (0.004) (0.003) (0.003) (0.003) (0.003) (0.003) Loan Size 0.112 ∗∗∗ 0.065 ∗∗∗ 0.086 ∗∗∗ 0.065 ∗∗∗ 0.085 ∗∗∗ 0.078 ∗∗∗ (0.015) (0.012) (0.013) (0.023) (0.015) (0.017) Loan Maturit y -0.001 ∗∗∗ -0.000 ∗∗∗ -0.000 ∗∗∗ 0.002 ∗∗∗ 0.002 ∗∗∗ 0.002 ∗∗∗ (0.000) (0.000) (0.000) (0.000) (0.000) (0.000) Credit Line -0.00 8 0.021 ∗∗ 0.021 ∗∗ 0.121 ∗∗∗ 0.111 ∗∗∗ 0.111 ∗∗∗ (0.010) (0.008) (0.008) (0.008) (0.009) (0.009) ln(1+Num b er of Co v enan ts) 0.001 0.001 0.004 0.363 ∗∗∗ 0.363 ∗∗∗ 0.362 ∗∗∗ (0.007) (0.006) (0.006) (0.007) (0.006) (0.006) Secured -0.041 ∗∗∗ -0.051 ∗∗∗ -0.056 ∗∗∗ 0.032 ∗∗∗ 0.033 ∗∗∗ 0.034 ∗∗∗ (0.010) (0.008) (0.008) (0.011) (0.011) (0.011) Obs. 13160 13160 13160 13160 13160 13160 A dj. R 2 0.13 0.04 0.05 0.39 0.45 0.45 Time Fixed Effect Y es Y es Y es Y es Y es Y es Industry Fixed Effects Y es Y es Y es Y es Y es Y es Loan Purp ose Fixed Effects Y es Y es Y es Y es Y es Y es Credit Rating Fixed Effects Y es Y es Y es Y es Y es Y es
T able 5: The Use of PSD and Borro w er Opacit y This ta b le rep orts the marginal effects of logistic regressions , relating the use of accoun ting base d PSD to measures of b orro w er opaqueness. The dep enden t v ariable is a d umm y v ar iabl e, whic h equals one if a loan includes an accoun ting based p e rformance pricing pro visi o n and zero otherwise. Marginal effects for eac h co v ariate are c onstructed as the difference in predicted probabilities for a particular outcome computed at their mean v alues holding all other co v ariates constan t. All items a re defined in the App endix T able A.I. Standard errors are heterosk edas ticit y robust and clustered at the firm lev el to accoun t for non-indep enden t observ ations within fi rm s. *,**,*** Indic ate statistic a l significanc e at the 10%, 5%, 1 % lev el. (1) (2) (3) (4) (5) Rel(Dumm y)*ln(T otal Assets ) -0.045 ∗∗∗ (0.006) Rel(Dumm y)*Rated -0.104 ∗∗∗ (0.019) Rel(Dumm y)*S&P 500 Constituen t -0.062 ∗ (0.038) Rel(Dumm y)*Syndication -0.102 ∗∗∗ (0.037) Rel(Dumm y)*T op-3 Bank -0.120 ∗∗∗ (0.018) Rel(Dumm y) 0.302 ∗∗∗ 0.086 ∗∗∗ 0.048 ∗∗∗ 0.134 ∗∗∗ 0.078 ∗∗∗ (0.037) (0.013) (0.010) (0.034) (0.012) ln(T otal Assets) 0.075 ∗∗∗ 0.036 ∗∗∗ 0.059 ∗∗∗ 0.037 ∗∗∗ 0.049 ∗∗∗ (0.006) (0.005) (0.005) (0.005) (0.005) Rated -0.049 ∗∗ (0.020) S&P 500 C onstituen t -0.069 ∗∗ (0.035) Syndication 0.186 ∗∗∗ (0.016) T op-3 Bank 0.112 ∗∗∗ (0.016) Obs. 15161 15161 15161 15161 15161 A dj. R 2 0.438 0.424 0 .4 35 0.439 0.435 Borro w er Characteristics Y es Y es Y es Y es Y es Loan Characteristics Y es Y es Y es Y es Y es Time Fixed Effects Y es Y es Y es Y es Y es Industry Fixed Effects Y es Y es Y es Y es Y es Loan Purp ose Fixed Effects Y es Y es Y es Y es Y es Credit Rating Fixed Effects Y es No Y es Y es Y es
Table 6: The Use of Covenants in PSD vs. Non-PSD Contracts
This table reports the frequencies of covenants types used in accounting-based PSD and non-PSD con-tracts between 1990 and 2009. The last column reports differences in the frequencies and two-sample t-tests.
PSD(Acc) Non-PSD t-test
Panel A: Leverage Covenants
Max. Debt-to-Tangible Net Worth 0.06 0.06 0.01
(0.00)
Max. Debt-to-EBITDA 0.64 0.11 0.54∗∗∗
(0.01)
Max. Senior Debt-to-EBITDA 0.13 0.02 0.11∗∗∗
(0.00)
Max. Debt-to-Equity 0.00 0.00 0.00