Elizabeth J. Akers
Matthew M. Chingos
Are College Students
Borrowing
Blindly?
lo
ans
students
colleg
e
es
timat
e
borr
owing
university
higher
education
debt
costs
awareness
burden
fr
eshmen
finances
affordability
enr
ollment
repayment
Executive Summary
I
mproving the college search process by makingcollege costs more transparent to potential students and their families is a primary focus of recent higher education policy efforts. But the importance of this information does not end at the university gates. In order to make prudent decisions about what to study, how many courses to take, and what kinds of jobs to pursue, college students should continue to bear in mind the cost of their education and the loan payments they will eventually have to make as they progress through school. But do they? Our analysis, drawing on data from two sources that link student survey responses to administrative records on cost and borrowing, suggests that a significant share of undergraduate students do not understand how much they are paying for college or how much debt they are taking on.
We find that only a bare majority of respondents (52 percent) at a selective public university were able to correctly identify (within a $5,000 range) what they paid for their first year of college. The remaining students underestimate (25 percent), overestimate (17 percent), or say they don’t know (seven percent). Using nationally representative data, we find that about half of all first-year students in the U.S. seriously underestimate how much student debt they have, and less than one-third provide an accurate estimate within a reasonable margin of error. The remaining quarter of students
overestimate their level of federal debt. Lastly, we find that among students with federal loans, 28 percent
reported having no federal debt and 14 percent said they didn’t have any student debt at all.
Students who do not have a good idea of their level of borrowing may make expensive mistakes that they will later come to regret. They are also likely to be surprised or even fearful when their first loan payments come due, which may impose an emotional burden on borrowers. More broadly, it may perpetuate popular narratives about crushing student loan burdens, which could discourage promising students from pursuing a college education.
Elizabeth J. Akers is a fellow in the Brown Center on Education Policy at the Brookings Institution.
Matthew M. Chingos is a senior fellow in the Brown Center on Education Policy at the Brookings Institution.
Introduction
Americans are losing confidence in the quality and affordability of higher education. In a recent Gallup poll, 58 percent of Americans said they thought the quality of the nation’s higher education system had stagnated or declined, and nearly three-quarters thought that higher education was not affordable for everyone who needs it. At the same time, a postsecondary credential is viewed nearly universally as important (Gallup 2013).
Concerns about affordability stem from both actual increases in how much the average American pays for college, as well as perceptions created by changes in the way that college is priced. The majority of students attend public colleges, where tuition, fees, room, and board have increased by about $4,600 over the last decade at four-year institutions (after adjusting for inflation). However, some of that increase has been offset by increases in financial aid, leading to an increase in what the average student actually pays of about $2,700 (Baum and Ma 2014). College is more expensive, but not to the extent it appears at first glance.
This divergence is even more pronounced at private, four-year colleges and universities. The average list price at these schools has increased by nearly $8,000, but the average price paid by students has barely changed at all (Baum and Ma 2014). In general, this means that students from affluent families, who actually pay the list price, are paying significantly more, while their lower-income counterparts are paying less, on average. This is a trend that dates back to at least the early 1990s.
This shift in how college is priced has raised serious concerns that many students who would pay less than full price for college may not understand the difference between sticker price and net price, and may fail to apply to many colleges as a result. A recent non-representative survey of college-bound high school seniors found that about 60 percent of students from low- and middle-income families
said they ruled out colleges based on list price alone, without considering the possibility of receiving financial aid (College Board 2012).
These concerns have prompted policy efforts to make college costs more transparent to potential students and their families. The 2008 reauthorization of the Higher Education Act required colleges to make available on their websites “net price calculators” that enable anyone to get an estimate of how much they will actually pay given their financial circumstances, and to report average net price for different income groups. But many of these calculators have been criticized as difficult to find and too complicated to use, and the average net
price data have important limitations.1 Furthermore,
many families may not even know to look for a net price calculator in the first place.
Research and policy discussions about the importance of information on price and quality in higher education focus on the college search process, when prospective students are deciding whether and where to go to college. But the importance of this information does not end at the university gates. College students need to continue to bear in mind the cost of their education, and the loan payments they will have to make after graduation, as they plan for their futures. This knowledge is critical as they make important decisions such as what field to major in, how much to work while in school, how many credits to take each semester, and what kinds of jobs to pursue after graduation.
Students paying a hefty price tag for college may be particularly inclined to finish quickly and major in a field likely to lead to gainful employment after graduation. Previous research indicates that public and private colleges with comparable student bodies have similar six-year graduation rates, but that privates have significantly higher four-year graduation rates (Bowen et al. 2009). The faster time-to-degree at the privates may stem in part from the higher prices charged by these institutions, a hypothesis which is supported by evidence that out-of-state students at public universities graduate more quickly than their in-state counterparts (Bowen et al. 2009).
College students need
to continue to bear in
mind the cost of their
education, and the
loan payments they
will have to make after
graduation, as they
plan for their futures.
The question of whether students understand how much they are paying for college and how much debt they are taking on has largely been ignored, likely because the answer seems obvious. The process of applying to college, filling out a financial aid application, and deciding where to enroll is complicated, but prior to enrollment, tuition bills must be paid and promissory notes for student loans must be signed. Those who make it through the college search process thus appear to be in a good position to understand what their education is costing them and their families and how much debt they are taking on each year.
It is clear that individuals would be better off if they made decisions with correct information about their college costs and borrowing in mind, but improved understanding of costs and borrowing could also have benefits for the broader market for higher education. Lack of knowledge about costs and borrowing may lead students to be insensitive to price when they decide to enroll or stay enrolled in college. That insensitivity means that institutions aren’t held accountable for charging a price that is in line with the value they provide, and can ultimately lead to untamed tuition inflation. The only prior study of this question, to our knowledge, linked survey and administrative data on student debt from a large public university and found that many students underestimate how much they owe (Andruska et al.
2014).2 Specifically, the researchers found that about
13 percent of respondents to their survey reported that they did not have a loan, when in fact they did, and almost 10 percent underestimated the amount they borrowed by more than $10,000. These results are based on a relatively small sample of voluntary survey respondents, and did not examine whether students knew how much they were paying for college, but nonetheless suggest that many students
do not understand how much they owe.3
We find equally surprising results using two datasets that link student survey responses with administrative records. Data from a large public university in the northeastern U.S. enable us to
compare student reports of college costs and debt to how much they actually paid and borrowed. A nationally representative data set enables us to examine the same relationship, but for borrowing only, at colleges and universities across the nation. In both cases, we find surprising new evidence that many students have a limited understanding of college costs and student debt. We find that a bare majority of respondents (52 percent) at a selective public university were able to correctly identify (within a $5,000 bin) the cost of their education and living expenses when asked at the end of their first year of enrollment. Using nationally representative data, we find that about half of all students seriously underestimate how much student debt they have, and less than one-third provide an accurate estimate within a reasonable margin of error. Lastly, we find that among students with federal student loans, 28 percent don’t know they have any federal debt and 14 percent don’t know they have any student debt at all.
Data
The first data source we consider comes from a survey of students at a selective four-year public university in the northeastern U.S. The survey was administered in the spring of 2014 to the cohort of first-time, full-time freshman who had applied for financial aid. Student athletes and participants in the university’s Educational Opportunity Program for disadvantaged students were not part of the study population due to their unique financial and academic circumstances.
Students were offered a $10 incentive to complete the survey. About 40 percent of eligible students (599 out of 1,503) completed the survey. The two survey questions used in this study are:
Please answer these questions to the best of your knowledge. There is no need to look up this information if you don’t know it; just provide your best guess if you’re not certain.
We find surprising
new evidence that
many students have a
limited understanding
of college costs and
1) Approximately how much did your first year of college cost you and/or your family (including room and board)? Less than $5,000; $5,000-$9,999; $10,000-$14,999; $15,000-$19,999; $20,000-$24,999; $25,000-$29,999; $30,000-$34,999; $35,000 or more; Don’t know
2) How much student loan debt do you have to date? None ($0); $1-$3,999; $4,000-$5,999; $6,000-$9,999; $10,000-$14,999; $15,000-$19,999; $20,000 or more; Don’t know
The survey responses were merged with
administrative data covering students’ demographic characteristics, pre-college academic preparation, and financial aid eligibility and receipt. Most importantly, these records contain information on how much students and their families paid for college (including room and board) after taking into account grants and scholarships (i.e., net cost) and how much students borrowed to pay for their first year of college (including both federal and private loans). The survey population includes primarily traditional-age students with relatively strong SAT/ACT scores (about 300 points higher, on average, than for all public, four-year institutions), as shown in Table A1. These students come from more affluent families, as evidenced by a higher average expected family contribution (the federal measure of ability to pay for college), and are less likely to be from underrepresented minority groups. They also face a somewhat higher net price than the average student at a public four-year college, and those who take on debt borrow less on average. Table A1 also shows that survey respondents and non-respondents have broadly similar characteristics, net price, and borrowing.
The second data source we use is the most recent version of the National Postsecondary Student Aid Study (NPSAS), which was administered to a nationally representative sample of college students during the spring of the 2011-12 school year. We limit
the analysis to first-year, full-time, undergraduate students at degree-granting institutions who had federal loans according to a data match with the National Student Loan Data System (NSLDS). The NSLDS serves as the source of administrative records on federal borrowing, which we compare to self-reported data based on two survey questions:
1) What is the total amount of money you borrowed in student loans for the 2011-2012 school year only (July 1, 2011-June 30, 2012)? Please include all federal, private, state, and school loans. Do not include parent PLUS loans, grants or scholarships, or any money borrowed from family or friends in your answer. (If you are unsure of the amount, please provide your best guess.) 2) How much did you borrow in private or
alternative loans for the 2011-2012 school year? Do not include any money borrowed in federal loans or any money borrowed from family or friends in your answer. (If you are unsure of the amount of your private loans, please provide your best guess.)
We calculate students’ self-reported federal borrowing for the 2011-12 school year, which is equivalent to their cumulative borrowing because they are first-time undergraduate students, by subtracting their reported private borrowing from
Findings
The survey and administrative data from the selective public university diverge significantly, as shown in Figure 1. A bare majority of respondents (52 percent) chose the $5,000-wide range of prices corresponding to what they actually paid for their first year of college. One-quarter underestimated price, 17 percent overestimated, and seven percent said they didn’t know. If we identify as correct responses that fall within $1,000 of the right answer (e.g., a student who paid $9,500 but selected the $10,000-$14,999 response), the percent correct only increases to 55 percent.
Students who took out loans to attend college appear to know even less about how much they borrowed than about net price. Only a minority (38 percent) answered correctly, with 19 percent guessing too low, 28 percent guessing too high, and 16 percent saying they didn’t know. Crediting responses within $1,000 of the truth increases the share answering correctly from 38 to 52 percent.
We are able to take a much more fine-grained look at student knowledge of debt, but not cost, using the NPSAS data. We first recreate the survey responses from the selective public university, which asked students to choose a dollar range rather than provide a precise estimate. We find that if NPSAS respondents used these categories, 34 percent would have selected the right answer overall, and 46 percent would have gotten the right answer within $1,000 (Table A2). These numbers are strikingly close to the single-institution results of 38 and 52 percent. However, the students in the NPSAS data were much more likely to underestimate their debt level (46 percent) than students at the public university (19 percent).
The NPSAS data indicate that the disconnect between perceptions and reality of debt we found at the selective public university are not an aberration, but rather typical of first-year college students in the U.S. The NPSAS allows us to take a much more detailed look at this question because it is a large, nationally representative sample of students who provided exact estimates of their borrowing linked to
Percent of Respondents
Figure 1. Survey Respondent Estimates Relative to Actual Values
Responds “I don’t know” Underestimates Correctly Estimates Overestimates
Net tuition, fees, room, and board
Amount of debt
7% 25% 52% 17%
16% 19% 38% 28%
the federal database containing information on how much debt they actually had. We might not expect students to be able to report their debt level with perfect accuracy, but we might expect them to come close.
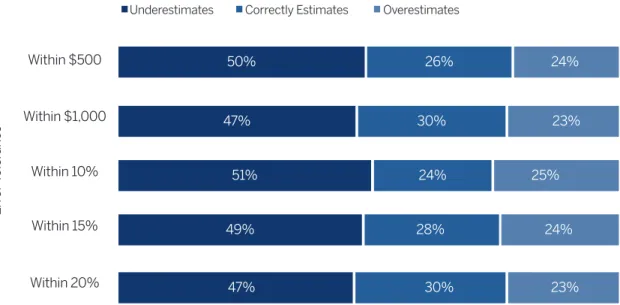
About half of students underestimate how much debt they have, regardless of how much margin for error we allow—$500, $1000, or 10 to 20 percent of their actual debt (Figure 2). Less than one-third provide an accurate estimate within any of those margins of error, and the remaining one-quarter overestimate their debt level. Nearly half of students underestimate their debt by more than $1,000 or by more than 20 percent. These results are particularly surprising given that we have limited the data to first-year undergraduate students, who are unlikely to have student debt from prior years and thus should not be confused by previously accumulated debt. A substantial number of students have a woefully inaccurate perception of their level of borrowing. Figure 3 shows the percentage of students in
$1,000-wide ranges of under- or over-estimated debt levels. The middle bar shows that 10 percent provide exactly the right answer, and the next bar to the right shows that seven percent of students overestimated their debt level by $1-$1,000. Significant numbers of students are way off the mark, with one-quarter underestimating their debt by at least $5,000 and another 11 percent overestimating by the same amount.
Figure 3 shows that the largest number of students underestimated their federal debt level by between $5,000 and $6,000. This is because $5,500 is one of the most common debt levels for first-year students (it is the loan limit for many first-year borrowers), and many students with federal debt report that they do not have any federal debt. Of the students who misreported in this range, 96 percent reported that they had no debt. This was also true for the $9,000-$10,000 range ($9,500 is another common debt level), with nearly all misreports in this range coming from students who incorrectly said they did not have any debt.
Figure 2. NPSAS Respondent Estimates Relative to Actual Values
Underestimates Correctly Estimates Overestimates
50% 26% 24% 47% 30% 23% 51% 24% 25% 49% 28% 24% 47% 30% 23% Percent of Respondents Within $500 Within $1,000 Within 10% Within 15% Within 20% Err or T oler anc e
Borrowers who are not aware they have any federal debt are surprisingly common. The NPSAS data indicate that 28 percent of first-year college students with federal debt reported that they did not have any federal debt. This may be partly the result of confusion about federal vs. other kinds of debt. Among students with federal debt, 14 percent reported having no debt at all. In other words, more than one-quarter of students do not understand that they have a loan from the federal government, and about half of these students appear to be genuinely unaware of the fact that they have borrowed for their education at all.
We conclude by examining how knowledge of student debt varies along a number of dimensions in the NPSAS data. Table 1 shows that community college students are most likely to correctly estimate
their debt level (within 10 percent).5 Students at
for-profit colleges are the least likely to estimate the correct amount, but are also the least likely to underestimate and the most likely to overestimate. Students at the for-profits are also the least likely to be confused about whether they have federal debt, or any debt at all. This evidence runs counter to the popular narrative about for-profit colleges preying on
Figure 3. Frequency of Differences between Student Estimates
of Federal Debt and Actual Values
25% 20% 15% 10% 5% 0%
Source: Authors’ calculations using NPSAS.
(-) $1 0,001 + (-) $9 ,001 –$1 0,000 (-) $8 ,001 –$9 ,000 (-) $ 7,001 –$8 ,000 (-) $6 ,001 –$ 7,000 (-) $5 ,001 –$6 ,000 (-) $4 ,001 –$5 ,000 (-) $3 ,001 –$4 ,000 (-) $2, 001 –$3 ,000 (-) $1 ,001 –$2, 000 0 $1 –$1, 000 $1 ,001 –$2, 000 $2, 001 –$3 ,000 $3 ,001 –$4 ,000 $4 ,001 –$5 ,000 $5 ,001 –$6 ,000 $6 ,001 –$ 7,000 $ 7,001 –$8 ,000 $8 ,001 –$9 ,000 $9 ,001 –$1 0,000 $1 0,001 +
Difference Betwen Self-Reported and Actual Debt
Per cent o f R espondent s Correct Estimates Underestimates Overestimates (-) $1 –$1, 000
Borrowers who are
not aware they have
any federal debt are
surprisingly common.
... Twenty-eight pecent
of first-year college
students with federal
debt reported that
they did not have any
federal debt. ... Among
students with federal
debt, 14 percent
reported having no
debt at all.
unwitting students who do not understand that they are signing up for significant debt loads.
We do not find any consistent, strong relationships between knowledge of debt and student gender or race/ethnicity. However, we do find that older students are more knowledgeable about their debt than younger students, and that there is a modest positive relationship between SAT scores and knowledge of debt. The relationship between knowledge of debt and age is concentrated at two-year colleges (Table A3). We find very similar results by whether the student is considered independent or dependent for financial aid purposes (not shown), which is not surprising, given that all students over age 24 are considered independent.
Finally, we do not find a strong relationship between expected family contribution, a measure of family wealth, and accuracy of debt level estimates, but we do find that students with higher expected contributions are more likely to be unaware that they have federal debt (or any debt). This may be because these students’ parents made the decision for them to take out loans, perhaps with the informal understanding that the parents would later pay it back (note that students can usually obtain loans on more favorable terms than their parents). In some cases, the lack of knowledge about cost and debt may stem from parents proactively managing their children’s decisions about education. This scenario may not seem particularly problematic at first blush, but one could imagine a number of bad outcomes resulting, such as the student feeling surprised, or even victimized, by their debt.
Table 1. Accuracy of Debt Estimates, by Subgroup, Students with Federal Loans
Percent of Borrowers: Percent Reporting:
Under-Estimating by 10%+ Correct Within by 10% Over-Estimating by 10%+ No Federal Loans No Student Loans All 51% 24% 25% 28% 14% Sector Public 2-year 49% 29% 22% 27% 14% Public 4-year 54% 24% 22% 31% 14%
Private nonprofit 4-year 50% 23% 27% 28% 16%
For-profit 41% 19% 40% 18% 6% Gender Female 51% 24% 25% 27% 14% Male 50% 24% 25% 29% 15% Race/ethnicity Asian 50% 26% 25% 21% 14%
Black or African American 52% 23% 25% 26% 12%
Hispanic or Latino 47% 29% 25% 25% 11% Other 56% 22% 22% 36% 16% White 50% 24% 26% 29% 14% Age Under 24 53% 23% 24% 31% 15% 24 and over 40% 29% 32% 16% 7% SAT Score
Did not take 41% 28% 31% 20% 8%
Bottom quartile 58% 21% 21% 33% 16%
2nd quartile 55% 22% 23% 31% 14%
3rd quartile 49% 25% 26% 28% 15%
Top quartile 48% 27% 25% 28% 15%
Expected Family Contribution
Zero 49% 24% 27% 24% 12%
Positive, bottom third 48% 27% 25% 25% 14%
Positive, middle third 53% 23% 24% 30% 14%
Postive, top third 54% 24% 22% 38% 17%
Conclusions
It is clear from the analysis presented here that enrolled college students do not have a firm grasp on their financial positions, including both the price they are paying for matriculation and the debt they are accruing. Without this information, it’s unlikely that students will be able to make savvy decisions regarding enrollment, major selection, persistence, and employment. Without knowledge of their financial circumstances, a student with a large sum of debt might be unprepared to compete for the jobs that would pay generously enough to allow them to repay their debt without having to enter an income-based repayment program.
Many students look back on their educational experiences with some regret about the financial circumstances. Some wish they had not gone to college in the first place, while others wish they had borrowed less or earned a different degree. The lack of literacy about the personal finances of college
going is almost certainly leading some students into decisions that they later come to regret. The problem with the lack of financial savvy among enrolled college students is that the consequences of their decisions come as a surprise to them once it’s too late. The consequences of confusion about debt may be most severe after college. It is possible, even likely, that this lack of knowledge will cause students to be surprised when their financial circumstances become apparent, perhaps when their first loan payment comes due. This surprise, or even fear, may impose an emotional burden on borrowers. More broadly, it may contribute to popular narratives about crushing student loan burdens, which are inconsistent with the reality that these burdens remain manageable for most borrowers (Akers and Chingos 2014). The potential cost of perpetuating these narratives is discouraging students from using debt to make investments in themselves that they could not otherwise afford.
Acknowledgments
We thank Katharine Lindquist for exceptional research assistance, staff at the anonymous public university for providing data used in this report, and Sandy Baum and Russ Whitehurst for helpful discussions. Support for this publication was generously provided by Lumina Foundation.
Endnotes
1 See Levine (2014) for a discussion of this issue.
2 Brown et al. (2011) address a similar question using macro-level analysis. They find that the aggregate level of student loan debt implied by a household survey is approximately 75 percent of that implied by administrative data from a credit-reporting agency.
3 A related study reported that borrowers also lack an understanding about the process of student loan
collection (Zafar et al. 2014).
4 We also subtract institution reports of state and school loans for the small number of students who participate in such programs (less than one percent, in both cases). We exclude a small number of students (29) who reported that they had private loans but did not report an amount.
References
Akers, Beth, and Matthew M. Chingos. (2014). “Is a Student Loan Crisis on the Horizon?” Brown Center on Education Policy, Brookings Institution.
Andruska, Emily A., Jeanne M. Hogarth, Cynthia Needles Fletcher, Gregory R. Forbes, and Darin R.
Wohlgemuth. (2014). “Do You Know What You Owe? Students’ Understanding of Their Student Loans,” Journal of Student Financial Aid, Vol. 44: Iss. 2, Article 3.
Baum, Sandy, and Jennifer Ma. (2014). Trends in College Pricing, 2014. New York: College Board. Bowen, William G., Matthew M. Chingos, and Michael S. McPherson. (2009). Crossing the Finish Line: Completing College at America’s Public Universities. Princeton, NJ: Princeton University Press.
Brown, Meta, Andrew Haughwout, Donghoon Lee, and Wilbert van der Klaauw. (2013). “Do We Know What We Owe? A Comparison of Borrower- and Lender-Reported Consumer Debt.” Federal Reserve Bank of New York Staff Reports, no. 523.
College Board. (2012). “A Majority of Students Rule out Colleges Based on Sticker Price.” studentPOLL, Volume 9, Issue 1. College Board and Art & Science Group, LLC. Retrieved from: http://www.artsci.com/studentpoll/ v9n1/index.html.
Gallup. (2013). America’s Call for Higher Education Redesign: The 2012 Lumina Foundation Study of the American Public’s Opinion on higher Education. Retrieved from: http://www.luminafoundation.org/ publications/Americas_Call_for_Higher_Education_Redesign.pdf.
Levine, Philip B. (2014). “Transparency in College Costs,” Economic Studies Working Paper Series. Brookings Institution, Nov. 2014. Retrieved from: http://www.brookings.edu/~/media/research/files/ papers/2014/11/12%20transparency%20in%20college%20costs%20levine/12_transparency_in_college_ costs_levine.pdf.
Zafar, Basit, Zachary Bleemer, Meta Brown, and Wilbert van der Klaauw. (2014).“What Americans (Don’t) Know about Student Loan Collections.” Liberty Street Economics. Federal Reserve Bank of New York.
Institution Survey
NPSAS
Did not Private Private for Private for
Respond respond Public Public nonprofit profit profit
(N=599) (N=904) 4-year 2-year 4-year 4-year 2-year
Age 18.2 18.3 19.3 24.7 19.1 29.3 27.2 Female 52% 47% 55% 54% 58% 65% 72% Race/Ethnicity White 62% 67% 59% 62% 65% 48% 41% Black 4% 4% 19% 20% 15% 28% 26% Hispanic 11% 10% 14% 9% 11% 16% 28% Asian 22% 18% 4% 3% 5% 2% 2% Other/missing 1% 2% 0% 6% 5% 5% 3% SAT/ACT 1313 1285 993 939 1044 905 921 EFC $26,709 $25,379 $9,414 $5,131 $11,868 $2,006 $1,964 Net price $21,018 $21,316 $17,107 $11,816 $24,756 $24,585 $23,455 Total loans (those
with debt) $7,327 $6,989 $8,494 $9,071 $10,372 $15,403 $12,504
Table A1. Summary Statistics
Source: Authors’ calculations using single-institution survey data and NPSAS. Notes: EFC is expected family contribution.
Institution Survey
NPSAS
Price Debt Debt
Percent of Borrowers:
Underestimating 25% 19% 46%
Correctly Estimating 52% 38% 34%
Overestimating 17% 28% 21%
Responding “I don’t know” 7% 16% 0%
Percent Correct within $1,000 55% 52% 46%
Number of Observations 598 333 7,913
Table A2. Accuracy of Debt Estimates, by Subgroup, Students with Federal Loans
Source: Authors’ calculations using single-institution survey data and NPSAS. Notes: NPSAS responses binned to match single institution survey.
Table A3. Accuracy of Debt Estimates, by Subgroup and Sector,
Students with Federal Loans
Percent of Borrowers at Two-year Institutions: Under-Estimating by 10%+ Correct Within by 10% Over-Estimating by 10%+ All 47% 28% 25% 51% 23% 25% Gender Female 48% 27% 25% 51% 23% 25% Male 46% 30% 24% 52% 23% 25% Race/ethnicity Asian 53% 39% 8% 49% 23% 28% Black or African American 50% 25% 25% 53% 22% 25% Hispanic or Latino 42% 29% 29% 48% 28% 24% Other 44% 36% 20% 60% 18% 22% White 48% 27% 25% 51% 23% 26% Age Under 24 54% 25% 22% 53% 23% 24% 24 and over 39% 32% 28% 40% 24% 36% SAT Score
Did not take 41% 33% 26% 42% 21% 37%
Bottom quartile 60% 20% 20% 59% 21% 20% 2nd quartile 49% 20% 31% 54% 22% 24% 3rd quartile 53% 22% 25% 49% 25% 26% Top quartile 50% 33% 17% 48% 25% 26% Expected Family Contribution Zero 47% 25% 28% 49% 23% 27%
Positive, bottom third 47% 29% 23% 48% 27% 25%
Positive, middle third 47% 31% 22% 55% 20% 25%
Positive, top third 50% 33% 18% 54% 23% 23%
Source: Authors’ calculations using NPSAS.
Under-Estimating by 10%+ Correct Within by 10% Over-Estimating by 10%+ Percent of Borrowers at Four-year Institutions:
ABOUT BROOKINGS
The Brookings Institution is a private nonprofit organization devoted to independent research and innovative policy solutions. For more than 90 years, Brookings has analyzed current and emerging issues and produced new ideas that matter—for the nation and the world. The conclusions and recommendations of any Brookings publication are solely those of its author(s), and do not reflect the views of the Institution, its management, its donors, or its other scholars.
ABOUT THE BROWN CENTER ON EDUCATION POLICY
The mission of the Brown Center on Education Policy at Brookings is to bring rigorous empirical analysis to bear on education policy in the United States. The primary activities of the Brown Center are based on quantitative social science, and are responsive to the immediate interests and needs of those who participate in policymaking.
Brown Center on Education Policy The Brookings Institution 1775 Massachusetts Ave., NW Washington, DC 20036 Tel: 202.797.6090