Laptop Use and Impact
in the Context of Changing Home and School Access
The third in a series of research studies on Microsoft’s Anytime Anywhere Learning Program
Submitted by ROCKMAN ET AL San Francisco, CA
June, 2000
ROCKMAN ET AL 605 Market Street, #305 San Francisco, CA 94105 415/ 543-4144 www.rockman.com FAX 415/ 543-4145
Laptop Use and Impact
in the Context of Changing Home and School Access
The third in a series of research studies on Microsoft’s Anytime Anywhere Learning Program
Submitted by ROCKMAN ET AL San Francisco, CA
We gratefully acknowledge the extensive cooperation and support of the many people who have made this evaluation possible. We especially thank the Laptop Program coordinators and teachers from the laptop schools and the faculty, administration and students at the sites where we conducted the bulk of our research. While these schools must remain nameless, given our promises of anonymity to the administrators, faculty and their students, we owe them a substantial debt of gratitude. They exhibited great patience and offered much assistance as we went about our data collection efforts.
We also want to thank the members of the ROCKMAN ET ALstaff and consultants who assisted us in planning and designing the research, and gathering and analyzing data, with a special nod to Michelle Weissman.
Laura Walker Saul Rockman Melissa Chessler
Laptop Use and Impact
in the Context of Changing Home and School Access
The third in a series of research studies onMicrosoft’s Anytime Anywhere Learning Program
E
XECUTIVES
UMMARYROCKMAN ET AL is an independent research organization in San Francisco that for the past three years has been conducting an evaluation of Microsoft’s Anytime, Anywhere Learning Program. Each student in the “Laptop Program” acquired a laptop computer loaded with Microsoft Office software, and their teachers received training on how to integrate
technology into the classroom. Research on the first year experiences of the pioneer schools focused on the many challenges and successes of program implementation. During the second year of the study, ROCKMAN ET AL focused on the range of the Laptop Program’s impacts on teaching and learning. During the third year of the Laptop Program, ROCKMAN
ET AL continued to examine impacts on teaching and learning within laptop classrooms, and especially the ways in which laptops might be supporting a more constructivist pedagogy. ROCKMAN ET AL was also asked to focus on the possible impact of students’ full-time laptop access on standardized test scores.
School selection for the third year of the study was based on the availability of these test scores. Our initial sample of 13 schools at 12 different sites yielded useful and reliable data from eight sites. More than 450 students and almost 50 teachers participated in one or more elements of the research. Our research also included a smaller group of matched students and teachers, in which matched Laptop and Non-Laptop groups came either from the same school (internal matches) or from separate schools with similar demographics and resources (external matches). Our matched sub-sample included over 270 students and 27 teachers. This report portrays the findings from this group of laptop schools and a smaller group of comparison schools. ROCKMAN ET AL conducted surveys of teachers and students, collected logs of computer use, gathered prompted writing samples, interviewed school
administrators, and analyzed standardized test scores from a variety of state- and nationally-normed assessments. This third year report presents a more complex picture of the impact of a fully implemented school Laptop Program.
S
TUDENTU
SE OFT
ECHNOLOGYAccess to technology has increased for all. When we began our Laptop research three years ago, laptops were often a school’s first substantial exposure to technology, and Non- Laptop students often had no exposure to technology at all. This is no longer the case. In fact, our comparison Non-Laptop students often had access to computers that was substantially the same as their Laptop counterparts. At school, 63% of Non-Laptop students reported using a computer in Year 2 of our research; in Year 3, 92% of Non-Laptop students said they had used a
computer at school, compared with 99% of our Laptop students. Access outside of school is even more similar between groups. In Year 3, 96% of the Non-Laptop students reported using a computer at some point outside of school; 98% of the Laptop students said the same. In
addition, 89% of Non-Laptop students said they had a computer in the home.
Computer access Laptop Non-Laptop % reporting computer use in school 99% 92% % reporting computer use outside school
98% 96%
% with at least one computer at home
96% 89%
Average number of computers at home
2.3 1.5
Opportunities for individual access are still greater for Laptop students. Despite increased access to computers for all, Laptop students still had greater individual access to technology. Non-Laptop teachers reported an average student-to-computer ratio of 9:1 in their classes; Laptop teachers reported a ratio of 1:1. When we asked students if they had a computer at home that was “just for you,” 60% of the Laptop students said they did, while only 20% of the Non-Laptop students said the same. While almost all students have some access to computers, Laptop students still have substantially greater individual access.
Laptop students consistently show deeper and more flexible uses of technology than their Non-Laptop matched groups. Despite the increased access to computers Non-Laptop
students now enjoy, Laptop students continue to show the more intensive uses of computers that were evident in our earlier years of research. On a variety of measures, Laptop students consistently show more frequent use of computers for longer periods of time than Non-Laptop students. In addition, they feel greater confidence in their computer skills on a variety of applications, and they use computers for a wider variety of tasks than do Non-Laptop students. These more intensive uses of technology for Laptop students are evident both at school and at home; however, home uses for the two groups are more similar than school uses.
Frequency of school computer use (student report)
Non-Laptop Laptop
Never
Once a month or less Once a week A few times a week Almost everyday
Frequency of home computer use (student report)
0 20 40 60 80 100 Non-Laptop
Laptop
Never
Once a month or less Once a week A few times a week Almost everyday
While Internet access for Laptop and Non-Laptop groups is identical at school and similar at home, Laptop students use the Internet more frequently and for longer periods of time. Both groups of students had almost universal direct classroom access to the Internet, and three-fourths of Laptop and two-thirds of Non-Laptop students reported access to the Internet at home. However, the use made of that access differs substantially. Even though teachers reported comparable classroom access, on average Laptop teachers used the Internet once a week, while Non-Laptop teachers reported average use of once a month. In fact, Laptop teachers showed the greatest gains in frequency of Internet use than for any other classroom computer application, moving from close to never three years ago to almost once a week in the current year. In addition, Laptop students used the Internet for longer periods at a time; once they were logged on, Laptop students remained online an average of 40% longer than their Non-Laptop counterparts.
Internet access at school and home
Laptop Non-Laptop
Access in school 91% 93%
Average frequency of student internet use (teacher report) 2.9 1.9 1 2 3 4 5 Frequency Laptop Non-laptop
(Scale: 1-never; 2- once a month or less; 3-about once a week; 4-a few times a week;5-almost every day)
Laptop students spend more time doing homework on computers than do Non-Laptop students (on average per week). At two of our three matched sites, Laptop students spent more time completing homework on computers than did Non-Laptop students; at our external site, the differences were quite stark. Laptop teachers report assigning homework that involves computer use seven times more often than Non-Laptop teachers. However, Laptop students spend less time per week on homework overall, and, according to teacher logs, homework is assigned less often. While we don’t know why this is, these differences may reflect the productivity of ubiquitous computer access or a tendency toward long term or interdisciplinary projects.
Both Laptop and Non-Laptop students use computers at home for a wider variety of tasks and subjects than they do at school. Both groups of students are using their computer resources at home within specific subjects at greater rates than they do at school. Even when their teachers are not utilizing computers in particular classes, students seem to be transferring and applying their computer skills at home to complete work in these same classes where computers are not used within school. As we found last year, computer use is most prevalent in language arts and social studies, and least prevalent in math, both in and out of school. However, in almost all cases, a greater number of students use computers for homework in a particular subject than use computers inside school. In addition, at two of three sites, both Laptop and Non-Laptop students use computers at home for a wider variety
Percentage of students who’ve used computers in specific subjects at least once, in school and at home
0 10 20 30 40 50 60 70 80 90 100 English/ Soc.Studies
Science Math English/ Soc. Studies
Science Math Laptop Non-Laptop
Inside School Outside School
I
MPACT ONT
EACHINGLaptop teachers show significant movement toward constructivist teaching practices. When we asked teachers to reflect on their practices three years ago and currently, only the Laptop teachers showed statistically significant change toward more constructivist teaching practices. These changes included more frequent uses of student-led inquiry and
collaborative work, and also included departures from traditional classroom roles and changes in activity structures. Data from Non-Laptop teachers did not show any significant changes in their practice from three years ago. In a measure of more traditional teaching, Non-Laptop teachers report they employ direct instruction (a traditional practice defined on our questionnaire as the sequence “review, teach, guided practice, individual practice”) almost every day, and that this has not changed at all over the last three years. In contrast, Laptop teachers have moved from employing direct instruction almost every day to about once a week in the current year. However, differences in current practices for Laptop and Non-Laptop teachers on most measures were not statistically significant, though
directionally Laptop teachers were slightly more constructivist. The laptop program itself, then, may be acting as a catalyst for change.
Laptop teachers show significant gains in how often they use computers for specific academic purposes. Again reflecting on their practice three years ago and currently, Laptop teachers report significant changes in how often they ask students to use computers
to conduct research and data analyses, run collaborative and interactive projects, and create documents, graphics and multimedia presentations. Non-Laptop teachers do not show significant increases in the frequencies of these practices.
Laptop teachers’ strongest catalysts for change are internal in nature. When we asked teachers to rate various catalysts for their changes in practice, Laptop teachers gave the strongest ratings to catalysts which involve more internal changes and learning, such as changes in their goals for students, in their understanding of how people learn, or staff development opportunities. In contrast, Laptop teachers gave their lowest ratings to events that were outside their control, such as changes in district policies, textbook resources, or students’ ability levels. Non-Laptop teachers felt they’d been most affected by a variety of factors, both internal and external. Laptop teachers’ answers seem to reflect a stronger sense of self-efficacy in the classroom, and these feelings may be contributing to their more rapid changes in pedagogy.
For both groups, the large majority of teachers who indicated a change toward more constructivist pedagogy also indicated that computers played a role in that change. When we asked teachers to reflect on changing practice, we also asked them to indicate whether computers had played a role in particular changes, such as using more authentic assessment, allowing themselves to be taught by students, encouraging students to choose their own research areas or explore topics independently, or moving away from direct instruction. In each case, more than four out of five teachers who made a change in such practices indicated that computers played a role in this change; in some cases, one hundred percent indicated a computer role. Computers themselves, then, may be acting as a catalyst for change for both Laptop and Non-Laptop teachers.
I
MPACT ONL
EARNINGLaptop students performed better on our writing assessment. We administered a writing assessment to all our matched Laptop and Non-Laptop students, and the resulting essays were scored blind by an independent in-house team of researchers. In two of three cases, Laptop students' writing rated stronger in all four scored areas: content, organization, language/voice/style, and mechanics. In the third case, language/voice/style and mechanics were rated higher, while the overall score was lower. For three years, teachers have
reported that they think access to laptops has improved student writing; there seems to be some evidence for this assertion.
Standardized test score comparisons were inconclusive. We faced major hurdles in gathering test scores for students: in some cases, schools were unable to give us the scores; in others, especially the high schools, only a handful of students took any particular test,
current Laptop scores were compared with the scores of the cohort who had moved though the same grade just before the Laptop Program was implemented (i.e., we compared 1999 7th grade scores with 1996 7th grade scores). We then conducted administrator interviews to inquire about other changes over time at these schools. Because we had such small groups of scores, we were unable to control for student background variables. Results were inconclusive; in some cases, current Laptop students’ scores were higher, but often the differences were not statistically significant. Certainly these standardized tests for the most part were not designed to reflect the types of learning that we have found laptops support. Also, in most cases, Laptop students were only in the second year of the Program, and therefore had had their computers less than two full years. It is not surprising, consequently, that results from standardized tests were inconclusive.
Comparison groups of Laptop and Non-Laptop students show less clear differences in some areas than last year. When we first examined comparison groups of Laptop and Non-Laptop students in the 1997-98 school year, differences between the two groups were often stark. While group differences are still large for many measures, such as computer use and computers skills, in other areas differences have diminished. Last year we found that Laptop students reported using active learning strategies more often than Non-Laptop students as they read, wrote, or prepared presentations. Last year, for example, Laptop students more often took notes as they read, outlined their papers, and rewrote passages for reports. This year results are more mixed. While Laptop students more often highlight a main idea or re-read reports before turning them in, for example, Non-Laptop students more often outline their papers and information they read, look up additional information as they read, and ask questions to make sure they understand what they’ve read, among other items. However, this is the case only for our two internally matched sites. Our externally matched site still shows the stark differences between Laptop and Non-Laptop students we found in Year 2, and here Laptop students employ almost every active learning strategy more often than their Non-Laptop counterparts. Laptop and Non-Laptop students within the same school may be growing more similar as time passes, perhaps due to a sharing of resources, pedagogical approaches, or school philosophies.
Laptop students rate their confidence in computer skills more highly than Non-Laptop students. Laptop students continue to rate their computer skills for specific applications more highly than Non-Laptop students. Differences between the two groups were
statistically significant for word processing, presentation software, Internet use, spreadsheets, databases, and webpage design. Only differences in email did not reach statistical significance, but directionally they were also in favor of Laptop students.
S
TUDENT ANDT
EACHERB
ELIEFS ABOUTT
ECHNOLOGYLaptop students' attitudes toward computers are more positive than Non-Laptop students’. For five statements about the benefits of computers, Laptop students indicated greater levels of agreement, and differences between Laptop and Non-Laptop students were
statistically significant. Laptop students agreed more strongly that computers helped them improve the quality of their schoolwork, made their schoolwork easier to do, made it more fun and/or interesting, and helped them understand their classes better. Laptop students also indicated that they more strongly preferred doing their schoolwork on the computer. In fact, the only statement with which Non-Laptop students indicated a greater level of agreement than Laptop students was “I enjoy playing games on the computer” (the difference was not statistically significant). Laptop students seem to feel more enthusiastic about the benefits of computer use for their schoolwork.
Both Laptop and Non-Laptop students perceived specific benefits from computer use. When asked the open-ended question, “How would your schoolwork be different if you didn’t use computers?”, both groups of students perceived benefits from computer use. These included greater productivity in their schoolwork (primarily in writing and research), the ability to create more professional products, an increase in creative opportunities, and increases in the skill set they feel they’ll need in future employment.
While both groups are enthusiastic, Laptop teachers rate computers' effects on students more positively than Non-Laptop teachers. Most teachers see the benefits of using technology for teaching and learning and, while Laptop teachers are a bit more enthusiastic about those benefits, Non-Laptop teachers are also very positive. Among the places where the differences between the two groups are most pronounced, however, are in the areas where we have seen consistent advantages in Laptop classes—in increased student research, in role shifts in the classroom, in collaboration, and in the fluency students have for using technology for a variety of purposes.
Teachers’ ratings of effects of technology access on students:
Laptop
Non-Laptop Fluency in using technology for a variety of educational purposes 4.7 4.2
Amount of research students do 4.6 3.9
Number of roles students assume in learning 4.3 3.9
Amount of time students spend working with class or schoolmates 4.2 3.6 (ratings are based on a 5 point scale, where 1 is “very negative” and 5 is “very positive”.) All the teachers we surveyed are enthusiastic about the use of technology in the classroom. For the third year, we asked teachers to rate their enthusiasm for technology and for laptops on a 7 point scale. Both Laptop and Non-Laptop teachers are consistently enthusiastic about the benefits of technology in the classroom, rating themselves at 5.5 and 5.4 respectively. However, Laptop teachers feel computers are more essential to their
I. Introduction 1
Project Background 1
Research Approach and Methodology 2
Summary of Years 1 and 2 9
II. Student Use of Technology 13
Technology Access 13
Technology Use 15
Students’ Technology Skills 29
III. Impact on Teaching 31
Current Practice 31
Changes in Practice 33
Catalysts for Change 40
Teachers’ Technology Skills 42
IV. Impact on Learning 45
Writing 45
Student Test Score Comparisons 51
Student Learning Strategies 58
V. Teacher and Student Beliefs about Technology 61
Students 61
Teachers 63
Laptop Use and Impact
in the Context of Changing Home and School Access
The third in a series of research studies onMicrosoft’s Anytime Anywhere Learning Program
INTRODUCTION
P
ROJECTB
ACKGROUNDIn the fall of 1996, Microsoft Corporation and Toshiba America Information Systems launched the Anytime Anywhere Learning Program, also called the Laptop Program, at 29 “pioneer” school sites across the United States. Students and teachers in both public and private schools acquired notebook computers loaded with Microsoft Windows and Microsoft Office software and began to explore how best to use these powerful tools for schooling. The pilot program was designed to demonstrate that providing every student within a classroom with access to “real world” business tools would produce substantial educational benefits by supporting learning anytime and anywhere. There are now hundreds of school sites across the country that are in various stages of implementing and adapting their own Laptop Program.
ROCKMAN ET AL, an independent research organization in San Francisco, California, was contracted to explore and assess the experiences of these Laptop schools. The first year experiences of the pioneer schools are detailed in the June 1997 “Report of a Laptop Program Pilot.” This report 15 on the challenges of program implementation, various participants’ assessments of the program, and includes recommendations for schools contemplating their own program.
During the second year of the study, the 1997-98 school year, ROCKMAN ET AL focused on the Laptop Program’s impact on teaching and learning. Selecting schools which were in their second year of a concentrated program implementation, ROCKMAN ET AL used surveys, on-site observation, and simulated problem-solving sessions to assess how Laptop students approached classroom tasks and integrated laptops as learning tools. The study also examined changes in teaching and how these changes might be related to ubiquitous access to laptops. In order to provide context for the findings, each group of Laptop students was compared to a matched group of Non-Laptop students from within the same school. These findings are described in “Powerful Tools for Schooling: Second Year Study of the Laptop Program.” Both this report and the first year report are
available on the websites of Microsoft and ROCKMAN ET AL.
During the third year of the Laptop Program, the 1998-99 school year, ROCKMAN ET AL continued to examine impacts on teaching and learning within Laptop classrooms, and especially the ways in which laptops might be supporting a more constructivist pedagogy.
ROCKMAN ET AL was also asked to focus on the possible impact of students’ full-time laptop access on standardized test scores. Questionnaires, logs and surveys were gathered from Laptop students, and matched groups of Non-Laptop students were again included to provide context for the findings. The third year report presents a more complex picture of the impact of a fully implemented school Laptop Program.
R
ESEARCHA
PPROACH ANDM
ETHODOLOGYBecause we were asked in part to examine the impact of the Laptop Program on standardized test scores, the number of potential research sites turned out to be quite limited. Although there are hundreds of schools initiating or implementing a Laptop Program, only a few qualified for our study.
Research Sites Site selection
Of the hundreds of Laptop Program sites, 141 responded to a program fact survey we mailed out in the fall of 1998. Many of these sites were in their first, second, or third years of implementation, while some were still in planning stages.
Our previous research on Laptop schools had shown that students and teachers often needed their first year to become familiar with the laptop computer as a tool and to begin to use the computer in ways that could have substantial impact on learning. Because we were investigating possible effects on standardized test scores, we limited our study sample to those students who were in at least their second year of the program, and who had teachers who were also teaching in at least their second year. Of the 141 sites that responded to our initial study, roughly 50 schools stated that they were in either their second or third year of implementation.
In our first year report, we described the various models that Laptop schools had adopted as they strove to provide meaningful and equitable access to the Laptop program. The concentrated model—in which each student had his or her own laptop, was able to take that laptop home, and was taught by a teacher who also had full-time access to a laptop computer—provided the most intensive laptop environment. To best understand the impact of ubiquitous computing, we chose, therefore, to work with sites that had a concentrated model. Of the 50 sites responding to us that were beyond their first year in the program, 29 schools had both a concentrated program and had students who were in their second year in the Laptop Program.
There were various other factors which further narrowed our potential study site list. Of the 29 sites above, only 12:
√ gave standardized tests at the necessary grade levels (e.g., a group of students in their second or third year of laptop use who also took a state-level test)
Matching sites
Our original research plan called for studying matched groups of Laptop and Non-Laptop students. Of the 12 sites which met our criteria, four had internal matches of
students—that is, the Laptop Program involved only a subset of the entire school population, and we were able to work with both Laptop and Non-Laptop students at the same school.
The other eight schools were whole-school implementations, and we began to look for external matches for these schools. We planned to find Non-Laptop schools in which the student population was roughly similar to that of a matched Laptop school, and schools which were willing to participate in our research. Our Laptop sites recommended
possible matches, either in their local area or in their network of independent schools, and we made dozens of phone calls. In the end, however, most of these Non-Laptop schools were unable to participate in our research, and only one externally matched school agreed to take part in our study.
Site participation
In the spring of 1999 we began our research at these 12 sites (13 schools, with our one external matched site). However, in the end we did not receive data from all of our schools. At two sites, student data sets were completed and then lost before they could be mailed to us. Unfortunately, incidents of lost data occurred at two of our five matched sites, leaving us with only three matched sites for our final study. In addition, one school returned so little information that we were unable to use it in our analysis; one returned no data whatsoever; and one returned only partial data, which included student test scores but no other student instruments. We made repeated efforts to obtain the data, but
circumstances and on-site concerns made obtaining it quite a problem.
For our final study, then, we have usable data from eight sites: three matched sites and five unmatched sites, one of which has only limited sets of instruments. Half are middle schools and half are high schools; five are public, and three are private.
Figure 1: Participating school sites
Public Middle Schools Private Middle Schools Private High Schools Public High Schools
Instruments and Data Collection Test score collection
Test score collection provided its own set of challenges. Some of the data were from nationally-normed, standardized tests; others were from state-level tests. Some of the assessments were being used for the first time, and thus no longitudinal data were available. Standardized tests are often administered in the spring of each school year; however, reports of student scores are returned mid-winter of the following school year. While participating sites could have teachers and students complete our surveys and questionnaires, test score data were often not under their direct control. At two of our three matched sites and at one of our unmatched sites, test score data were unavailable for several months because of database problems at the district level.
In addition, students who met our requirements—who were in at least their second year with laptops and who were in a grade level that participated in standardized testing—did not always take the tests. Some of the widely offered national tests, like the SAT, the PSAT, and the ACT, are not mandatory. At private schools, participation is close to 100%; at some of our public schools, less than 30% of our target group of students took the test.
At the schools for which we were unable to find a matched site, we had no group of comparison test scores. Therefore, we conducted a “cohort comparison”—we examined test scores for the current Laptop group and compared their achievement with the test scores of the cohort of the same grade level who had moved through the school four years earlier, before the Laptop Program began. In order to account for other influences
beyond the laptops during those four years, we conducted interviews with each principal or headmaster to ascertain the changes that had occurred at their schools during the last four years (see below for description of the principal interviews).
Finally, because the United States has no national testing program, each school gave tests at different grade levels, and the tests the students took varied from school to school. While a few schools gave us PSAT scores, other schools were the only school in our sample to give a particular test. Therefore, we were not able to compare student test scores across sites, and could not construct the larger and more powerful data set that identical testing would have allowed us.
It is important to recognize that Anytime Anywhere Learning was not designed
specifically to improve test scores. Although our previous research has identified many benefits of the Laptop program, differences between Laptop and Non-Laptop students’ achievement test scores may not appear. Possible impacts of the Anytime Anywhere Learning program on standardized test results may not be apparent until students have more than two years’ experience with using a laptop as a learning tool. Anytime
students with and without laptop access may therefore be minimal while alternative assessment tests may show significant differences between these groups.
Grade Private/ public
Full data returned?
Test All students take test?
% of group w/ test scores
Matched schools: (LT, NLT)
School Pair 1 (external) 11 public yes ACT no 27%, 27%
School 2 (internal) 11 public yes PSAT no 26%, 15%
School 3 (internal) 8 public yes SAT9 yes 98%, 84%
Laptop Only schools:
School 4 8 public yes SAT9 yes 96%
School 5 8 public yes OH state yes 100%
School 6 10 private yes PSAT no 82%
School 7 10 private yes PSAT no 87%
School 8 7 private no SSAT yes 100%
Instruments
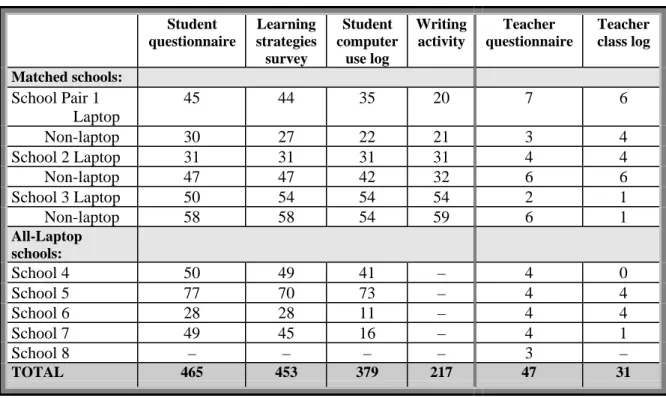
In addition to collecting student test scores, we also administered several surveys and questionnaires, and asked both students and teachers to keep logs for us. Over 460 students and 47 teachers at 9 different schools participated. All students were asked to fill out a student questionnaire, a learning strategies survey, and a computer use log; students at our matched sites were asked to complete a writing activity as well. Teachers were asked to complete a survey and a class log. Instruments are described below and are included in the appendix of this report.
Table 2: Number of participants
All Laptop (Matched Laptop) Non-Laptop Total Student instruments Student questionnaire 330 (126) 135 465
Learning strategies survey 321 (129) 132 453
Computer use log 261 (161) 118 379
Writing activity – (105) 112 217
Teacher instruments
Teacher survey 32 (12) 15 47
Table 2.1: Instrument collection by site Student questionnaire Learning strategies survey Student computer use log Writing activity Teacher questionnaire Teacher class log Matched schools: School Pair 1 Laptop 45 44 35 20 7 6 Non-laptop 30 27 22 21 3 4 School 2 Laptop 31 31 31 31 4 4 Non-laptop 47 47 42 32 6 6 School 3 Laptop 50 54 54 54 2 1 Non-laptop 58 58 54 59 6 1 All-Laptop schools: School 4 50 49 41 – 4 0 School 5 77 70 73 – 4 4 School 6 28 28 11 – 4 4 School 7 49 45 16 – 4 1 School 8 – – – – 3 – TOTAL 465 453 379 217 47 31 Student instruments.
Student Questionnaire. All of our participating students were asked to complete a background questionnaire. Students answered questions about their experience with computers, current computer use, technology skills, their school schedule, and their home environment. Four hundred and sixty-five students at seven sites completed the
questionnaire.
Learning Strategies Survey. The Learning Strategies Survey asked students to rate the frequency with which they apply a variety of learning strategies when they read, write and prepare presentations for school. For example, students were asked how frequently they revise reports and write outlines for papers. Students also indicated which learning strategies they have applied with the aid of a computer. Four hundred and fifty-three students at seven sites completed the survey.
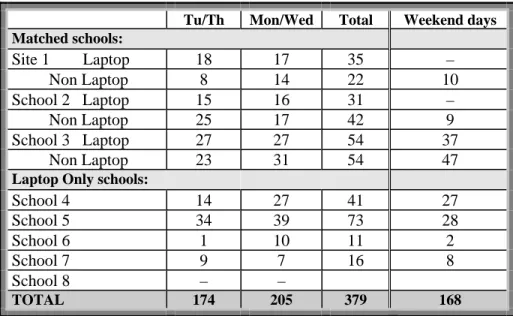
Computer Use Log. Students at each of our schools completed a Computer Use Log. Because we wanted to get computer use information for several different days, half the students began their logs on a Tuesday or Thursday, and the other half on a Monday or Wednesday. Then students recorded computer use every other day, for three days, including a weekend day if their logs happened to cover one.
Students were asked to report each time they used a computer, both in school and outside of school. Additionally, they recorded what class they used the computer for (in school), what they used the computer to do, which software/tools they used, and how many minutes they spent on the computer. If they were reporting out-of-school use, they were asked if they used the computer to complete schoolwork, and if so for which subject. Also, each day they recorded the total amount of time they spent on homework, either with or without a computer. Three hundred and seventy-nine students at eight schools completed the logs.
Table 2.2: Student computer logs
Tu/Th Mon/Wed Total Weekend days Matched schools: Site 1 Laptop 18 17 35 – Non Laptop 8 14 22 10 School 2 Laptop 15 16 31 – Non Laptop 25 17 42 9 School 3 Laptop 27 27 54 37 Non Laptop 23 31 54 47
Laptop Only schools:
School 4 14 27 41 27 School 5 34 39 73 28 School 6 1 10 11 2 School 7 9 7 16 8 School 8 – – TOTAL 174 205 379 168
Writing Activity. A Student Writing Activity was administered only at our matched sites, where we had both Laptop and Non-Laptop students participating. Students were asked to write several paragraphs describing the activity they had learned the most from during the preceding school year. They were asked to explain why they had learned so much from this activity and what made it different from other assignments. As a pre-writing exercise they were asked to give some basic facts about the assignment and to list the steps they took to complete their project. The students were instructed to take about 30 minutes to complete the activity, and to turn in any pre-writing activities
(brainstorming, outlining, creating a concept web, etc.) that they used in order to write their response.
A separate ROCKMAN ET AL team conducted a blind assessment of the writing activity. Team members used a rubric that reflected a four-point scale in four different areas: Content, Organization, Language/Voice/Style, and Mechanics. Benchmark papers were selected, and each student’s work was scored by two different evaluators. When those scores differed, the paper was re-evaluated by both scorers. Two hundred and seventeen students at three sites completed the writing activity.
Teacher Instruments.
Teachers in both Laptop and Non-Laptop classes were asked to complete two instruments: a questionnaire and a class log.
Teacher Questionnaire. The Teacher Questionnaire asked teachers to reflect on their pedagogy, their teaching philosophy, and their classroom practice. In order to investigate change over time, teachers were asked about their current practices and about those same practices three years ago, before the Laptop Program began. In addition, they indicated whether they thought computers had played a role in any changes that might have occurred. Teachers were also asked about their technology expertise and background, their access to computers and the Internet, and their assessment of technology’s impact on the classroom. Forty-seven teachers completed these questionnaires.
Teacher Class Log . Teachers chose two classes each day for five consecutive days and kept a log for these ten different class periods. They were asked to indicate on a checklist which student activities had occurred (e.g., writing, reading, problem solving,
discussion), which roles they as teacher had assumed (e.g., lecturing, facilitating
discussion, consulting with small groups), the activity structure (teacher led, student led, or independent) and student grouping. The teachers were asked to indicate for each period which two activities had consumed the most class time. In addition, they indicated when computers had been used for each activity. If the class had been atypical for any reason, or if they wanted to explain further, they were asked to elaborate. Thirty-one teachers kept class logs for us.
Principal Interviews.
At each school we conducted a 15-to-20-minute telephone interview with the principal, headmaster, or other administrator to get a sense of all the ways the school might have changed during the last three years, during the period that the Laptop Program was implemented. Administrators were asked about any school reform initiatives or major changes, either at a local, district, or state level, and what they felt the impacts of those efforts had been. They also answered questions about changes in teacher experience or demographics (e.g., staff turnover or professional development initiatives); changes in student demographics (student body size, socioeconomic status, etc); changes in test preparation for students; and any other changes they felt may have impacted standardized test scores or teaching and learning at their schools.
S
UMMARY OFY
EARS1
AND2: C
ULMINATION OF FINDINGSOur research this year completes three years of extensive, nation-wide research on
schools and classrooms that have implemented a substantial Laptop program. While each year’s research design built on the findings of the previous years, in each successive study we also examined new areas and questions. To provide a context for viewing and interpreting the research findings of the third year study, below is a brief summary of our first and second year findings, and the current status of each.
First Year Study: The Pioneer Schools
Our first year of research documented the experiences of the small group of pioneer schools that began the program. Their experiments and lessons provided important information for those who followed.
Positive attitudes. The first year report documented extremely high levels of enthusiasm among all participants—teachers, students, parents, and administrators. Respondents felt the laptops enhanced both teaching and learning, that they were highly flexible and adaptable tools, and that they could be adopted successfully in a variety of academic settings and grade levels.
In the second and third years of the study, we continued to ask teachers to rate their enthusiasm for the project on the same seven-point scale. Enthusiasm for the program, even after three years of implementation, has remained high.
Figure 2: Teacher enthusiasm for the Laptop Program
unenthusiastic1 2 3 4 5 6 very enthusiastic7
Years 2 & 3 Year 1
➷
➷
Year 1- average rating 5.8; Year 2- average rating 5.6; Year 3- average rating 5.6
Implementation models. Because the pioneer sites in Year 1 were mapping out new territory, there were many experiments on how best to utilize the available laptop
resources. Some schools chose to acquire a class set of laptop computers, available to all classrooms but not the exclusive domain of any single class. Other schools scattered their Laptop students in with Non-Laptop students, and some gave a few of their limited number of laptops to each classroom to use full-time. However, by the end of the year, whether or not they were able to implement it, most participants agreed that the most effective model was the concentrated model: All students in a particular class, grade, or school have a laptop, and it is theirs to use at all times, both at home and at school. Teachers also have their own laptops, and receive intensive training on technology skills, curriculum uses, and integration.
Because we wanted to examine the most intensive uses of the laptop, in Years 2 and 3 we confined our research to those sites that were able to pursue a concentrated Laptop
Program implementation model.
Challenges of equity. Laptop computers are expensive. While many sites recognized that most benefits occurred when all students in a particular class had laptops, and when Laptop students were grouped together through several subjects, many also worried about what that might mean for students unable to afford a laptop. Schools experimented with scholarships, securing low-interest loans for parents, rent-to-buy programs, and creating a set of loaner laptops.
While we did not focus on this issue in Years 2 and 3, comments from teachers and administrators during interviews and on questionnaires indicate that equity continues to be a challenge. Some sites feel their various assistance programs have provided equal access, while others are still struggling with the issue. This is a critical concern for schools and worthy of further monitoring and study.
Exposure to technology. When the Laptop Program began in the fall of 1996, only a handful of mostly private schools already had substantial technology programs. For many of the pioneer schools, the Laptop Program comprised their first significant
exposure to technology in general, and to the Internet. Much of the enthusiasm we heard in the first year of the program was a reflection not only of the laptops as a particularly flexible tool but also of any exposure whatsoever to computers in the classrooms and to the World Wide Web.
Today, this is no longer the case. In the last three years, American schools have acquired technological resources at astounding rates, and Internet connections are commonplace; studies report that almost all schools—and more than half of all classrooms—have an Internet connection. In addition, students have access to home computers in much greater numbers. In Years 2 and 3, when we used Non-Laptop students for comparison purposes, we found that often these students had extensive computer access and
exposure, especially at home. Therefore, the Laptop Program does not necessarily constitute a first exposure to technology, but rather a particular kind of exposure: Students have their own computer; it is highly mobile; and they have the same set of software resources no matter where they are working.
Changes in pedagogy. In our first year’s research we threw a wide net to begin to understand the impacts laptops could have in schools. As a small part of our research, we asked teachers to report on their perceptions of changes in their pedagogy, such as
changes in their teaching style or methods. We found that teachers felt they were doing more project-based work, more student-centered or student-led work, and more
Second Year Study: Focus on Teaching and Learning
Inspired by the changes in classrooms that our pioneer school participants described during their first year in the program, we focused on impacts on teaching and learning during our second year of research. In order to deepen our understanding, we spent a lot of time on-site, observing and interviewing students and teachers about what we saw.
Comparison groups. We worked with groups of both Laptop and Non-Laptop students during Year 2. These matched groups of students attended the same school and often shared teachers with our Laptop students; they provided an excellent comparison group as we examined the effects of the laptops. During Year 3, we continued to use
comparison groups as we investigated the Laptop Program.
Impacts on learning. During Year 2, we spent a total of 60 days on site at four different schools, examining what went on in classrooms; we also administered problem solving activities and ran focus groups. We found that Laptop students participated in more project-based instruction than Non-Laptop students; that they wrote more often and produced writing of higher quality; that their research and analysis skills were stronger; and that they completed more presentations than Non-Laptop students. Additionally, during our problem solving simulations, we found that Laptop students more readily engaged in critical thinking and displayed more instances of higher-order thinking than their Non-Laptop counterparts.
Impacts on teaching. During our time on site, we used an observation log to note what roles teachers played in the classroom, and how much time they spent in various
activities. We shadowed students (both Laptop and Non-Laptop comparison) and teachers, closely monitoring how they spent their time. We found that Laptop teachers spent less time lecturing than did their Non-Laptop counterparts, and they spent more time consulting and conferencing with individuals and small groups of students. Laptop students spent more time collaborating with their peers than did Non-Laptop students. These findings are consistent with the style of a constructivist classroom. In Year 3, we further explored the idea that laptops were facilitating more constructivist teaching.
Technology access, use, and skills. During Year 2, we explored how Laptop students use their computers. In comparison with Non-Laptop groups, we found that Laptop students used computers more frequently, for longer periods, more appropriately, and had more advanced technology skills. We also found that the laptops seemed to extend the school day, as Laptop students spent a greater percentage of their out-of-school computer time completing school tasks. During Year 3, we continued to examine students’ use of computers as schools nation-wide increased their technology resources.
Third Year Study: A Shifting Focus
Our Year 3 research was shaped by the request to examine possible impacts on student achievement, primarily standardized test scores. We selected sites based on their test-giving schedule and their willingness to share test data, as outlined above. However, we also continued to examine teaching and learning inside classrooms. While we were unable to go on site, as we did in Year 2, we did receive questionnaires, logs, and/or surveys from over 450 students at seven schools. In addition, 47 teachers answered an extensive set of questions about their teaching practice and philosophy, and 31 filled out a ten-day log of classroom practice. With this generous cooperation from students and teachers, we were able to expand our findings on computer access and use, influences of the laptops on classroom practice, changes in teaching over time, and student writing.
STUDENTS’ USE OF TECHNOLOGY
T
ECHNOLOGYA
CCESSOver the past three years, access to technology in schools and homes in the United States has increased at a breathtaking rate. While there are substantial differences based on income and often race, the number of families with school-age children who have a home computer exceeds fifty percent, and the students-to-computer ratio continues to decline, now in the neighborhood of 7-to-1. In addition, according to a recent study by Grunwald
(Children, Families, and the Internet 2000. Grunwald Associates, P.O. Box 908, San
Mateo, CA 94403, [email protected]), access to the Internet has increased
dramatically over the past several years, tripling since 1997, up 40% in the past year. Grunwald’s data indicate that more than 70% of all teenagers are connecting with the Internet at home or in school. Fourteen million children sign on to the Internet from school; 18 million children, ages 2-17, connect from home for a non-duplicated total of 25 million. The National Center for Education Statistics reports that 95% of schools and more than 60% of the classrooms are linked to the Internet. Teachers are also gaining access to technology and are rapidly and frequently being offered the training to use it. Across the country, almost all schools are making progress towards acquiring and using computers for teaching and learning.
When the Laptop Program was first introduced, only a handful of participating schools, often private ones, had extensive technology resources. As described above in our summary of the first year report, for many schools the Laptop Program initially provided the first substantial technology access for teaching and learning, and the comparison, Non-Laptop schools had only modest computer access and resources. Three years ago, Laptop schools often went from very limited access to immediate and ubiquitous access, while Non-Laptop schools had perhaps only a few computers in the library or in a lab. However, this is no longer the case, and the technology gap has narrowed considerably. Students in many schools are getting substantial access to computer time in their
classrooms, a lab, or in their school library. At these sites, they can usually gain access to the Internet; some have email accounts, and most use the software applications and tools that Laptop classes have had since they joined the program. At home, too, the Non-Laptop students not only have access to computers to play games and do their homework, but also use the Internet to conduct research and communicate with their friends. Laptop students are not as unequaled as they were several years ago. While not all students have their own computer, many do have sufficient access to be comparable with Laptop students in critical ways.
Computer Access
While we only have data from Non-Laptop students for Years 2 and 3 of our research, even within that small time frame, access has increased significantly for Non-Laptop students. Our data for in-school computer access for Non-Laptop students indicate that:
Year 2: 63% report using a computer at school (yes/no question)
Year 3: 92% report using a computer at school at some point (frequency question) (In comparison, 99% of the Laptop students in Year 3 report using a computer at school at some point)
Out-of-school computer access data for Non-Laptop students shows that: Year 2: 80% report using a computer at home (yes/no question) Year 3: 86% report using a computer at home (yes/no question)
Year 3: 96% report using a computer outside of school at some point (frequency question).
(In comparison, 98% of the Laptop students in Year 3 report using a computer outside of school at some point)
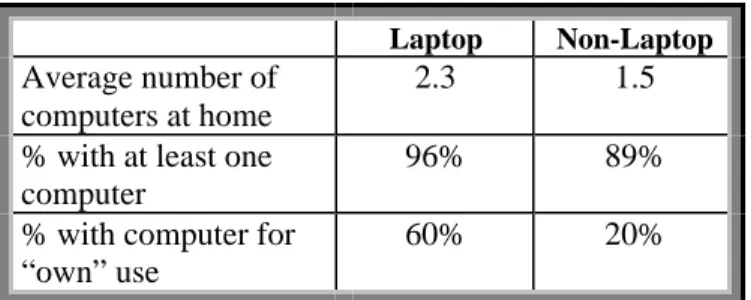
We also asked our matched group of Laptop and Non-Laptop students how many computers, if any, they had at home. Since we were working with concentrated Laptop classrooms, where students can take their laptops home, Laptop students automatically had at least one computer to count. However, it was clear that our comparison students had substantial access at home as well. While 96% of the Laptop students reported that there was at least one computer in the home, 89% of the Non-Laptop students said the same. Laptop students reported an average of 2.3 computers in their home, while the Non-Laptop comparison students reported 1.5 computers in the home, on average. However, while both Laptop and Non-Laptop students have substantial access to
computers at home, the type of access may be different. We asked students if they had a computer at home that was “just for them”; a significantly larger percentage of Laptop students (60%) replied that they did, in comparison to Non-Laptop students (20%). While over half of our Laptop students have sole proprietorship over their computers, four out of five of our Non-Laptop students must share their computers at home.
Table 3: Computer access at home
Laptop Non-Laptop Average number of
computers at home
2.3 1.5
% with at least one computer
96% 89%
% with computer for “own” use
their class logs, teachers indicated the student-to-computer ratio for each of their classes. Laptop classes averaged 1:1; Non-Laptop classes averaged 9:1.
The gap in computer resources between our Laptop and Non-Laptop students has narrowed considerably. In some respects, their access is almost equivalent. However, opportunities for individual access are still much greater for Laptop students.
Internet Access
Laptop and Non-Laptop students also seem to have similar access to the resources of the Internet. All of the teachers in our matched groups report that their school has Internet access. All teachers except one in each group report that their classrooms have Internet access; they all state they have a direct connection (as opposed to a dial-up or modem connection). Access from home is more dissimilar, but still reflects relatively
comparable levels of access.
Table 4: Internet access at school and home
Laptop Non-Laptop
Access in school 91% 93%
Access at home 76% 65%
T
ECHNOLOGYU
SELaptop and Non-Laptop students now have more similar access to technology than they did three years ago. However, evidence suggests that this access is utilized in very different ways. Laptop students use computers more frequently, for longer periods, for a wider variety of uses, and have higher confidence in their computer skills, despite the more similar access. Below, we examine differences in technology use between the matched groups in school, outside of school, with the Internet, with homework, and by individual subjects and activities.
Computer Use: Inside School Frequency
Even though the vast majority of both Laptop and Non-Laptop students report that they have used computers in school at some point, and so have some type of access, the frequency of that use varies widely. Many of our measures reveal that Laptop students use computers significantly more often.
When asked how often they use computers in school, 83% of the matched group of Laptop students indicated “almost everyday.” Only one-fourth (25%) of the Non-Laptop students use computers in school this often. In fact, almost half—47%—of the
Non-Laptop students say they use a computer at school only once a month or less. Only 4% of the Laptop students say they use a computer at school this infrequently.
Figure 3: Frequency of school computer use (student report)
0 20 40 60 80 100 Non-Laptop
Laptop
Never
Once a month or less Once a week A few times a week Almost everyday
Given their access to computers, students with full-time use of a laptop are more likely to use that computer in school. Laptop students use their computers almost every day in school, while Non-Laptop students use a computer about once a week on average. The difference between the two groups is statistically significant.
Figure 4: Frequency of computer use in school (student report)
4.7 3.1 1 2 3 4 5 Frequency Laptop Non-laptop
(Scale: 1-never; 2- once a month or less; 3-about once a week; 4-a few times a week;5-almost every day)
Teachers were also asked to estimate how often a typical student in their classes used a computer. Laptop teachers reported far more frequent use of computers during their
Figure 5: Frequency of computer use in school (teacher report) 3.6 2.5 1 2 3 4 5 Frequency Laptop Non-laptop
(Scale: 1-never; 2- once a month or less; 3-about once a week; 4-a few times a week;5-almost every day)
For both Laptop and Non-Laptop groups, student reports of computer use are higher on average than teacher reports. This probably reflects the fact that students are talking about all their classes put together, while teachers are talking only about their own classes.
Duration
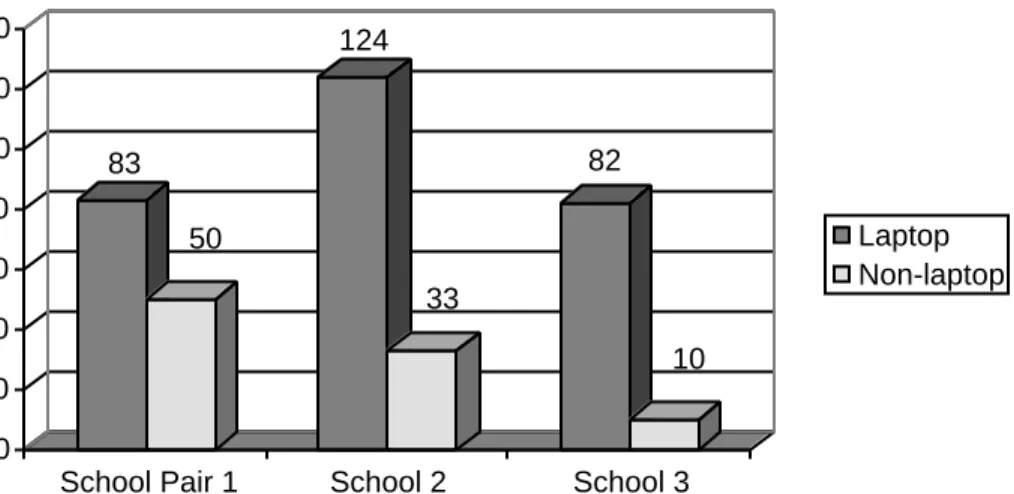
The measures above reflect how often students used their computers—i.e., how many days per week they sit down in front of a computer. Laptop students also use their computers for longer periods each day. At all three matched sites, Laptop students report far higher average minutes of computer use each day at school, up to eight times as much at one site. These data come from student logs and are consistent with the data obtained in previous years.
Figure 6: Average minutes of computer use per day in school
83 50 124 33 82 10 0 20 40 60 80 100 120 140
School Pair 1 School 2 School 3
Laptop Non-laptop
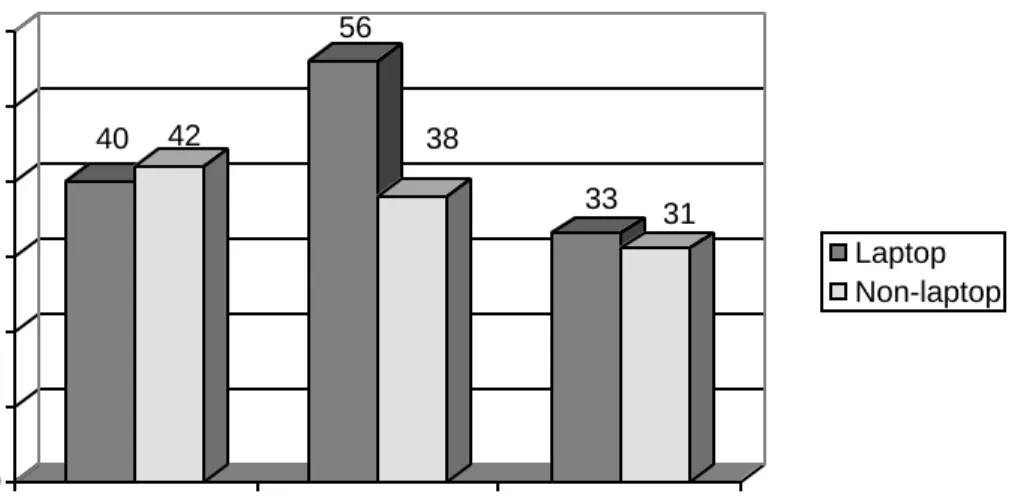
In addition, in two of three cases, Laptop students use the computer for longer periods once they get on. Longer periods may allow for more intensive work time.
Figure 7: Average duration of a single session on the computer, in minutes
40 42 56 38 33 31 0 10 20 30 40 50 60
School Pair 1 School 2 School 3
Laptop Non-laptop
Computer Use: Outside School
Frequency
While Laptop students use computers much more frequently than Non-Laptop students at school, outside of school those differences diminish somewhat. The differences,
however, are still statistically significant. Both groups seem to use computers at home a few times a week, but students report a half-point difference on a five-point scale.
Figure 8: Frequency of computer use at home (student report)
4.2 3.7 1 2 3 4 5 Frequency of computer use outside of school
Laptop Non-laptop
In addition, while 47% of Non-Laptop students report they use computers at school once a month or less (see above), only 17% of Laptop students say that they use computers at home that infrequently. This compares with 8% of the Laptop students who report using computers at home only once a month or less. About half (54%) of the Laptop students report using a computer at home “almost everyday,” while about one-third (32%) of the Non-Laptop students report using computers at home this frequently. Frequency of use, then, seems much more similar at home than at school for our matched group of students.
Figure 9: Frequency of home computer use (student report)
0 20 40 60 80 100 Non-Laptop
Laptop
Never
Once a month or less Once a week A few times a week Almost everyday
Duration
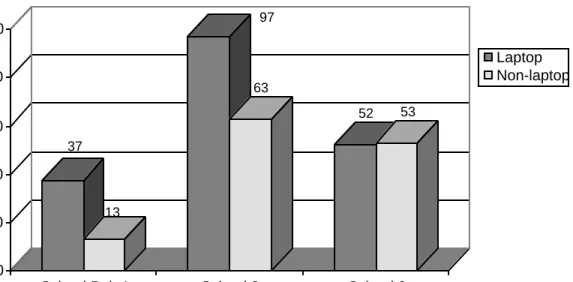
How long students spend on computers on the days they use them outside of school is still quite different between Laptop and Non-Laptop groups. At two of our three matched sites, Laptop students spend far longer on the computer than their Non-Laptop
counterparts, up to three times as long at one school:
Figure 10: Average daily computer use outside of school, in minutes
37 13 97 63 52 53 0 20 40 60 80 100
School Pair 1 School 2 School 3
Laptop Non-laptop
Note also that Laptop students at school pair 1 and school 2 did not log any weekend days, unlike the rest of the groups. Their reports of longer periods on computers all occurred after school on weekdays, when they had less time at home.
Internet Use
Again, while both Laptop and Non-Laptop students have similar access to the Internet at home and identical access within classrooms (see above), the use they make of that access differs significantly. Laptop teachers report that their students use the Internet in their classes about once a week on average; Non-Laptop teachers say about once a month. Differences are statistically significant.
Figure 11: Average frequency of student internet use (teacher report)
2.9 1.9 1 2 3 4 5 Frequency Laptop Non-laptop
(Scale: 1-never; 2- once a month or less; 3-about once a week; 4-a few times a week;5-almost every day)
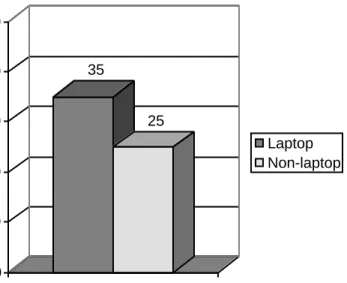
In addition, how long students spend using the Internet once they begin also differs significantly. Laptop students use the Internet in class for periods almost 50% longer than their Non-Laptop counterparts:
Figure 12: Average duration of a single session using the Internet, in minutes 35 25 0 10 20 30 40 50 Duration Laptop Non-laptop
Laptop students also report using the Internet to prepare presentations more often than Non-Laptop students. The difference, again, is statistically significant:
Figure 13: Percent of students reporting Internet use for presentations
68 54 0 20 40 60 80 100
Internet for Presentations
Laptop Non-Laptop
While student access to computers and to the Internet has grown more similar for Laptop and Non-Laptop groups, the use students make of that access continues to differ
Homework
Our findings on homework in Year 3 differ from our findings in the second year of our research. Several differences in research approach may have contributed to these changes. Data on homework in Year 2 were gathered through shadowing students and conducting daily interviews, while data in Year 3 were obtained through individual and unsupervised student logs. Because of the intensive nature of a shadow study, data in Year 2 reflected information from a total of 16 Laptop and Non-Laptop students; data on homework in Year 3 come from 379 students. Finally, Non-Laptop students had greater access on average to computers in Year 3 than they did in Year 2, and our findings certainly reflect this change.
Amount of homework
On average, Non-Laptop teachers report assigning more minutes of homework each week (169 minutes) than do the Laptop teachers (159 minutes). At two of our three matched sites, Laptop students also report spending less time on homework than their matched Non-Laptop counterparts. (Note again that Laptop students at School Pair 1 and School 2 did not log any weekend days, unlike the rest of the groups).
Figure 14: Students’ average daily homework, in minutes (student report)
76 57 69 76 67 105 0 20 40 60 80 100 120
School Pair 1 School 2 School 3
Laptop Non-laptop
These measures reflect the amount of homework assigned in minutes, i.e., how long it took students to complete their homework. We also have evidence that Non-Laptop teachers assigned homework more frequently than their Laptop counterparts. Roughly half (52%) of Non-Laptop teachers’ logged class periods included a homework
component, while only one-third (36%) of Laptop teachers’ logged classes did.
homework by the amount of time it took to complete it, rather than what students were actually asked to do, it may be that Laptop students have similar assignments but simply complete their homework more efficiently by using their computers.
Figure 15: Percentage of all homework completed on computers (student report)
24 0.01 57 49 30 32 0 20 40 60 80 100
School Pair 1 School 2 School 3
Laptop Non-laptop
Use of computers for homework seems to be encouraged by Laptop teachers; our teacher logs show that Laptop teachers assigned homework which involved computer use seven times more often than Non-Laptop teachers.
Figure 16: Percentage of homework assigned which involved computer use
42 6 0 20 40 60 80 100
Homework assignments with computers
Laptop Non-laptop
Again, then, Laptop teachers may be considering the effect of computer use when estimating how much time their homework assignments might require.
Outside-school computer use and school-related tasks
In two of three sites, we found that Laptop students spent a smaller percentage of their overall computer time working on school-related assignments than did Non-Laptop students. In contrast, for Year 2, we found that Laptop students spent a greater
percentage of their out-of-school computer time working on school-related assignments than did the Non-Laptop students.
Figure 17: Percentage of outside-school computer use related to schoolwork:
49 2 40 59 39 64 0 20 40 60 80 100
School Pair 1 School 2 School 3
Laptop Non-laptop
At two of three sites, then, Laptop students are spending a large amount of time on their computers for work that is not directly related to school.
However, it is also important to note that at two of the three sites, Laptop students actually spent more minutes per day on average on their computers completing school-related tasks than did their Non-Laptop counterparts. Because they spent so much time on their computers in general, the percentage of time that is school-related shrinks.
Figure 18: Average minutes per day spent on the computer doing school related tasks
18 0.3 39 37 20 34 10 20 30 40 50 Laptop Non-laptop
Activities and Subjects Computer use by activity
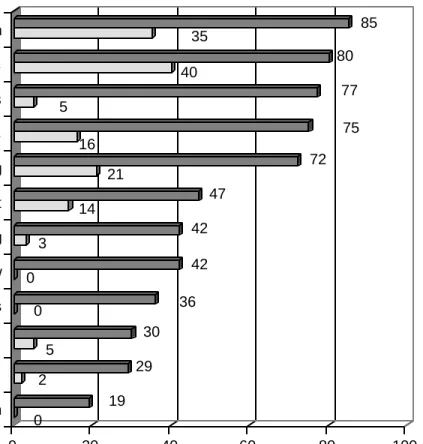
According to their classroom logs, Laptop teachers employ computers far more often in a wide variety of tasks than do their Non-Laptop counterparts. Each time they recorded a particular classroom activity, we asked teachers to indicate if they used computers to complete that task. In every case, Laptop teachers used computers far more regularly.
Figure 19: Percentage of time classroom activities involve computer use (teacher report)
0 19 2 29 5 30 0 36 0 42 3 42 14 47 21 72 16 75 5 77 40 80 35 85 0 20 40 60 80 100 discussion reading problem solving worksheets review note taking assessment writing presentations data analysis projects research Laptop Non-Laptop Percentage
In almost all cases, Laptop students also recorded a wider variety of uses for their computers during the three days they kept logs for us. Students recorded what they did on their computers both inside and outside of school, and we coded their responses into 17 categories. These categories included presentations; research; writing (composing); word processing; database work; assessment; taking notes; email; Internet surfing; chat room participation; web page design; playing games; graphics; using subject-specific software; computer studies; “homework” (when content was unspecified); and “other,” which included non-specific responses (i.e., “work,” “assignment”) and responses that
were not frequent enough to code (“doing translations”, vocabulary, spelling, playing music, monitoring, etc. )
When we examine student computer logs for activities during school, in each case laptop students record a larger variety of computer uses than their non-laptop counterparts, and a larger number of “other” activities as well. When we examine the logs for computer time outside of school, Laptop students at School Pair 1 and School 2 again report a wider variety of computer uses than their Laptop counterparts, while Laptop and Non-Laptop students at School 3 record the same number of different activities. Again, Laptop students also indicated a larger number of responses we coded as “other.”
Figure 20: Number of different student activities coded
0 2 4 6 8 10 12 14 16 School Pair 1
School 2 School 3 School Pair 1
School 2 School 3 Laptop Non-Laptop
Inside School Outside School
How students divided their time among these various activities is harder to categorize. Our analysis of the logs is based on number of incidences of a particular activity recorded, rather than the duration of any one activity. That is, if a student spends 10 minutes surfing the Internet and 60 minutes doing homework, these activities still get 1 count each for that day. From this analysis, then, we cannot generalize about the amount of time spent, but rather the number of discrete times a particular activity was performed. In general, both Laptop and Non-Laptop students indicate that, inside of school,
academic activities are performed most often. These activities include writing, research, assessment, and presentations. Outside of school, as we indicated above in the section on
periods of time on their computers anyway, a larger percentage here does not necessarily indicate a greater amount of time.
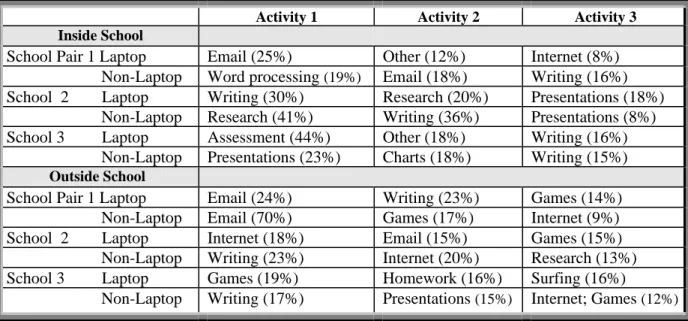
Table 5: Top three computer activities by site, as a percentage of all discrete uses
Activity 1 Activity 2 Activity 3
Inside School
School Pair 1 Laptop Email (25%) Other (12%) Internet (8%)
Non-Laptop Word processing (19%) Email (18%) Writing (16%) School 2 Laptop Writing (30%) Research (20%) Presentations (18%) Non-Laptop Research (41%) Writing (36%) Presentations (8%) School 3 Laptop Assessment (44%) Other (18%) Writing (16%) Non-Laptop Presentations (23%) Charts (18%) Writing (15%)
Outside School
School Pair 1 Laptop Email (24%) Writing (23%) Games (14%)
Non-Laptop Email (70%) Games (17%) Internet (9%) School 2 Laptop Internet (18%) Email (15%) Games (15%) Non-Laptop Writing (23%) Internet (20%) Research (13%) School 3 Laptop Games (19%) Homework (16%) Surfing (16%)
Non-Laptop Writing (17%) Presentations (15%) Internet; Games (12%)
Computer use by subject
Students were asked if they had ever used a computer during school in each of their core subjects this year. Note that this measure does not reflect how frequently computers are used in any given subject, but rather whether they have ever been used at all, even just once. Again, Laptop students’ computer use was significantly higher in each subject. However, different subjects reflect different computer uses, revealing that even with Laptop schools computer use varies markedly by subject.
Figure 21: Percent of students who say they have NEVER used a computer in these subjects during school: 57 63 45 76 15 28 0 10 20 30 40 50 60 70 80
math science language/social studies
Laptop Non-Laptop
For both groups, computer exposure is most prevalent in language and social studies classes, and least prevalent in math. Only one in five Non-Laptop students had ever used a computer in their math classes, and less than half of the Laptop students had done the same. In each case, differences between Laptop and Non-Laptop students a