Can Feature Design Reduce the Gender Gap
in End-User Software Development Environments?
Valentina Grigoreanu
1, Jill Cao
1, Todd Kulesza
1, Christopher Bogart
1,
Kyle Rector
1, Margaret Burnett
1, and Susan Wiedenbeck
2 1Oregon State University and
2Drexel University
{grigorev, caoch, kuleszto, bogart, rectorky, burnett}@eecs.oregonstate.edu,
[email protected]
Abstract
Recent research has begun to report that female end-user programmers are often more reluctant than males to employ features that are useful for testing and de-bugging. These earlier findings suggest that, unless such features can be changed in some appropriate way, there are likely to be important gender differences in end-user programmers’ benefits from these features. In this paper, we compare end-user programmers’ feature usage in an environment that supports end-user debugging, against an extension of the same environ-ment with two features designed to help ameliorate the effects of low self-efficacy. Our results show ways in which these features affect female versus male end-user programmers’ self-efficacy, attitudes, usage of testing and debugging features, and performance.
1. Introduction
Although there is a large body of literature about is-sues facing women in IT professions, until recently, researchers had not considered how gender differences interact with features and tools in programming envi-ronments. However, researchers are now beginning to report theory and empirical data pointing to gender differences in the use of end-user programming envi-ronments. Evidence of these differences has accumu-lated, indicating gender differences in programming environment appeal, playful tinkering with features, attitudes toward and usage of end-user programming features, and end-user debugging strategies [2, 3, 6, 12, 14, 17, 18, 21].
In these studies, females have been shown to both use different features and to use features differently than males. Even more critically, the features most conducive to females’ success are different from the features most conducive to males’ success—and are the features least supported in end-user programming environments. This is the opposite of the situation for features conducive to males’ success [21].
These studies have not delved into how to remedy this situation so that feature barriers to females’ suc-cess can be removed. Although a few isolated solu-tions have been reported [12, 18], these solusolu-tions have not been tied to theory, and therefore do not provide
designers of end-user programming environments the fundamental information they need about how to find and remove such barriers in their own environments.
In this paper, we tackle this issue. Our long-term research goal is to answer the following question:
Can theory be directly applied to end-user pro-gramming environment features to narrow the gender gap in end-user programmers’ debugging success, by better supporting females?
The answer to this question holds the key to ena-bling designers of end-user programming environments to spot barriers in their own tool set, and further, to figure out what is needed to remove them.
In earlier research, we proposed two theory-based features that aimed to improve female performance without harming male performance: (1) adding “may-be” nuancing, inspired by self-efficacy theory, to fea-tures with which users input quality judgments and (2) integrated explanations geared toward gender dif-ferences in information processing and problem-solving styles [4]. We evolved these features over three years through the use of formative investigations, drawing from education theory, self-efficacy theory, information processing theory, metacognition, and curiosity theory [4, 13, 20].
In this paper, we now face the challenge head-on. Namely, we committed these features to a robust im-plementation, and we investigated statistically whether they do indeed help to remove barriers to female end-user programmers’ debugging efforts.
Our specific research questions were:
(RQ 1): Do these features help to close the gender gap in feature usage for female and male end-user programmers? If so, how does that relate to their suc-cess?
(RQ 2): Do these features help decrease the gap be-tween females' and males’ debugging self-efficacy? If so, how does that relate to their debugging success?
2. Background
2.1 Theoretical and Empirical Basis
Self-efficacy theory has had a strong influence on our work. Bandura’s social-cognitive theory identifies self-efficacy (or confidence in one’s ability to carry out 2008 IEEE Symposium on Visual Languages and Human-Centric Computing (VL/HCC)
a specific task) as a key element in performance out-comes. People with low self-efficacy for a task tend to expend less effort on the task, use simpler cognitive strategies, show less persistence when encountering difficulties, and ultimately finish with a lower success rate than people with high self-efficacy [1].
In software applications, studies have found gender differences in self-efficacy. Females generally have lower computer self-efficacy than males, and this has been tied to feature usage [9]. Our own studies of both student and professional end-user debuggers have also found these effects [2, 3]. For example, females’ self-efficacy was predictive of successful use of debugging features, whereas males’ feature usage was not tied to their self-efficacy. Further, unlike males, females were less willing to engage with, or even to explore, novel debugging features. This is unfortunate, because such features have been tied to improved debugging per-formance by both females and males.
For example, the Forms/3 spreadsheet environment, in which we prototype our ideas, includes WYSIWYT features (What You See Is What You Test) [7] (Figure 1). This set of debugging features allows users to make decisions about the correctness of cells’ output values, and then provides feedback to help them find and fix formula errors. When the user notices a correct cell value and puts a checkmark () in the cell’s deci-sion box (as in cell F3 in Figure 1, for example), the system increases the testedness of that cell and of the other cells that contributed to its value. These changes are reflected in the cell’s border colors (red for un-tested, blue for un-tested, and shades of purple for partly tested; shown as shades of gray in this paper). Overall testedness of the spreadsheet is also reflected in the progress bar at the top of the screen. Instead of check-ing off a value, if the user sees an incorrect cell value and puts an X-mark in the cell (as in cell E3),
fault-likelihood calculations are triggered, which highlight the interior of cells that are likely to contain faulty formulas. The interior highlights follow a color con-tinuum from light yellow for cells not likely to contain a formula error, to orange for cells with formulas very likely to contain an error (e.g., cell E3). Also, optional arrows can show dataflow relationships of cells; the arrows are colored using the same color scheme as the cell borders, to reflect testedness of the relationships. Tool tips briefly explain the semantics of each feature, suggest an action, and hint at a reward [7].
We have reported in previous studies [2, 3] females’ lack of willingness to even try out the WYSIWYT fea-tures. Trying out new things by tinkering with them is a curiosity-based, playful behavior that leads to open-ended exploration in learning [19]. Such unguided, informal exploration has been shown to improve both motivation to learn and task performance [15], but re-search in education suggests that females are less likely to tinker than males [10]. Our own investigations have confirmed females’ lack of willingness to tinker [2]. Self-efficacy theory suggests that females’ low com-puter self-efficacy decreased their willingness to tinker, denying them the benefits of exploratory learning and depressing the adoption of unfamiliar features. The solution, however, does not lie solely in encouraging tinkering—our previous results indicate that tinkering in overly complex environments can have the detri-mental effect of decreasing females’ self-efficacy [2]. Thus, if tinkering is to be helpful, it may need to in-volve features well-matched to the user’s problem-solving style.
Another theory that has had a strong influence on our work is information processing theory [16]. This theory proposes that, as a group, females seek more comprehensive information than males do, although males tend to seek this too when problems become Figure 1. Forms/3 spreadsheet with WYSIWYT features. (Version used by the Control group.)
complex. We conducted formative empirical work to better understand what information end users seek when debugging [13]. Strategy information emerged as one of the top needs. Better ability to self-judge was another high-ranking information need, which is close-ly related to self-efficacy.
2.2 The Features
Given the results above, we looked for methods that might improve females’ self-efficacy and willingness to try out, and ultimately to effectively use, the novel debugging features. The result was two feature changes. The first was adding “maybe” nuances to the checkmarks and X-marks (Figure 2), which we pro-posed earlier but did not statistically test [4]. The em-pirical work leading to this change suggested that the original “it’s right” and “it’s wrong” checkmark and X-mark might seem too assertive a decision to make for low self-efficacy users, and we therefore added “seems right maybe” and “seems wrong maybe” checkmark and X-mark options. The change was intended to communicate the idea that the user did not need to be confident about a testing decision in order to be “quali-fied” to make judgments. In the current paper we sta-tistically investigate whether this feature does indeed help females, without hurting the males.
The second change, also proposed in [4], was a more extensive set of explanations, to explain not only concepts but also to help close Norman’s “gulf of eval-uation” by enabling users to better self-judge their problem-solving approaches. We evolved that pro-posal [20], ultimately providing the strategy tions of the current study. Note that these are tions of testing and debugging strategy, not explana-tions of software features per se.
The strategy explanations are provided as both vid-eo snippets and hypertext (Figure 3). In each vidvid-eo snippet, the female debugger works on a debugging problem and a male debugger, referring to the spread-sheet, helps by giving strategy ideas. Each snippet ends with a successful outcome. The video medium was used because theory and research suggest that an individual with low efficacy can increase self-efficacy by observing a person similar to oneself strug-gle and ultimately succeed at the task [1, 8]. The hy-pertext version had exactly the same strategy informa-tion, with the obvious exception of the animation of the spreadsheet being fixed and the talking heads. We
decided on hypertext because it might seem less time-consuming and therefore more attractive to users from an attention investment perspective [5], and because some people prefer to learn from text rather than picto-rial content. Recent improvements to the video expla-nations include shortening the explaexpla-nations, revising the wording to sound more like a natural conversation, and adding an explicit lead-in question to immediately establish the purpose of each explanation.
3. Experiment
3.1 Design
The experiment was a 2x2 between-subjects design with gender (female/male) and condition (Treat-ment/Control), carried out in a computer laboratory. The Treatment group's environment was the same as the Control group’s (Figure 1) with the addition of the “maybe” marks and the strategy explanations features (Figure 2 and Figure 3). We
did not isolate each feature in its own treatment because we feared that a single fea-ture alone might not be enough to make a differ-ence. This was important because the overall goal was to ascertain whether it is possible to make a differ-ence in the gender gap through feature design.
3.2 Participants
The participants were 65 female and 67 male students from a variety of majors. Participants were required to have previous spread-sheet experience, including use of formulas, but could not have much program-ming experience. About half the participants were from non-technical majors. There were no significant differences across gender or group in GPA, age, year in school, programming rience, or spreadsheet expe-rience.
3.3 Materials and Task
A pre-session question-naire gathered background
Figure 2: Clicking on the checkbox turns it into four choices whose tool tips say “its wrong,” “seems wrong maybe,” “seems right
maybe,” “its right.”
_________
Figure 3: (Top): 1-minute video snip-pets. (Bottom):
information and self-efficacy based on a slightly modi-fied version of Compeau and Higgins’ validated scale [8]; the modifications made the questionnaire task-specific to end-user debugging. In post-session ques-tionnaires participants answered the same self-efficacy questions, rated the usefulness of the features, and an-swered an open-ended question about how parts of the software affected their confidence in finding and fixing bugs.
The hands-on portion began with a 30-minute “tour of features” tutorial, which explained what the features in the spreadsheet environment meant, but it did not imply any strategies for howbest to use these features. The participants were instructed to “test the updated spreadsheet and if [they] find any formula errors, fix them.” The spreadsheet had previously been seeded with six bugs that we have used in many previous ex-periments [2, 4, 13, 20, 21]; these were originally har-vested from end users. Participants had 45 minutes to complete the task. The Treatment group was inter-rupted after 30 minutes and asked to view either a vid-eo or hypertext explanation of their choice. This interruption was necessary to ensure actual usage of the explanations; without usage, we could not have collected data on their usefulness.
4. Analysis Methodology
4.1 Measures
In this study, we were interested in only certain comparison groups: Treatment females vs. Control females to see if the Treatment helped females, Treatment males vs. Control males to see if males’ performance was affected, and “gender gaps”, i.e., Treatment female/male differences versus Control female/male differences.
In making comparisons, two potential confounds had to be taken into account: gender/group differences
in pre-self-efficacy, and individual differences in
minutes available for debugging.
Regarding pre-self-efficacy, analysis of pre-session questionnaires revealed that females in the Treatment group had significantly lower pre-self-efficacy than females in the Control group (Treatment females:
M=36.82, SD=5.22; Control females: M=40.13,
SD=4.28; ANOVA: F(1,63)=7.96, p<.0064). (Recall that there were no significant differences otherwise in participant background (e.g., academic areas, age, etc.) among the groups.) Consequently, except where noted, all statistical tests were done in ways that took pre-self-efficacy into account.
Regarding minutes available for debugging, the de-bugging time available to Treatment participants varied by individual, depending on how much time they spent on explanations. To account for the time differential, we calculated debugging minutes as ((45*60) –
expla-nation seconds)/60, where 45 was the number of min-utes given to debug the spreadsheet, and explanation seconds was the time a participant spent viewing the strategy explanation videos and/or text. We counted “explanation seconds” from the time they touched a strategy explanation until there was any event (even a simple mouse movement) in the spreadsheet area. Thus, except where noted, all statistical tests were done in ways that also took debugging minutes into account. To take these covariates into account and to allow direct row-wise and column-wise comparisons (e.g., analyzing female differences by comparing Treatment females vs. Control females), we used one-way AN-COVAs and linear regressions, and in the few cases where ANOVAs were appropriate, we used one-way ANOVAs.
4.2 Coding Methodology
The post-session questionnaire’s open-ended confi-dence question asked participants which parts of our software affected their confidence in their ability to fix bugs and how their confidence was affected. To ana-lyze their responses, we began by deriving codes close to the words used by the participants in their answers. We then iteratively regrouped the low-level codes to generalize them. The result was two 3-level trees of codes, one tree for comments about positive effects on confidence (+) and a mirror image for comments about negative effects on confidence (-). The top level of the tree included six codes: environmental conditions, user features, software feedback, information given, soft-ware usability, and experiment setup.
Two researchers individually coded 20 participants’ answers using this scheme, achieving a 91% agreement rate. Given the high agreement, a single researcher coded all remaining participants’ answers.
5. Results
Although not our primary research question, the reader may be wondering whether males or females fixed more bugs. If we do not take into account self-efficacy and actual time spent debugging, males fixed significantly more bugs than females (females:
M=2.88, SD=1.75; males: M=3.84, SD=1.46; ANOVA: F(1,130)=15.67, p<.00013) and achieved a signifi-cantly higher maximum percent testedness (females:
M=0.49 (49.1% testedness), SD=0.24; males: M=0.64,
SD=0.19; ANOVA: F(1,130)=15.05, p<.00017). This is not surprising given our setting. Previous studies have revealed numerous barriers to females’ success in debugging spreadsheets, showing that males use spreadsheet testing and debugging features more than females [2, 3], and that their strategies are better sup-ported by the debugging features present in this envi-ronment [21].
new features in the Treatment group helped to close the gender gap. The Treatment females did not fix more bugs than Control females, but we would not expect them to: Treatment females had both lower self-efficacy than Control females and more things to take their time than Control females did, as we have already discussed. However, as our analysis in the next few sections shows, taking the self-efficacy and time fac-tors into account reveals that the new features helped to close the gender gap in numerous ways.
5.1 The Gender Gap and Debugging Features
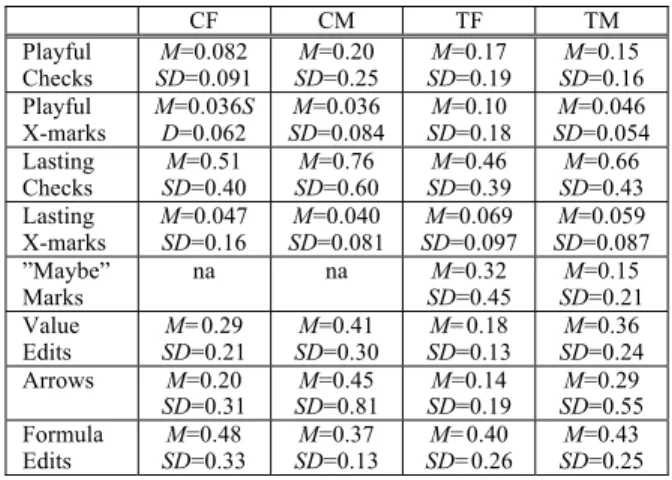
First we consider the relationship between our fea-ture changes and the debugging feafea-ture usage gap for males and females. When we compared the males and females in the Treatment group to their counterparts in the Control group, a clear answer emerged: our feature changes did lead to greater interest among the Treat-ment group. Compared to females in the Control group, Treatment females made more use of debugging features such as checkmarks and X-marks, and had stronger ties between debugging feature usage and strategic testing behaviors. The mean and standard deviation for usage of each type of feature are detailed in Table A1 (Appendix A).
As in prior studies, we took playful experimentation with the checkmarks and X-marks (trying them out and then removing them) as a sign of interest. Past studies reported that females were unwilling to approach these features, but that if they did choose to tinker, their ef-fectiveness improved [2, 3].
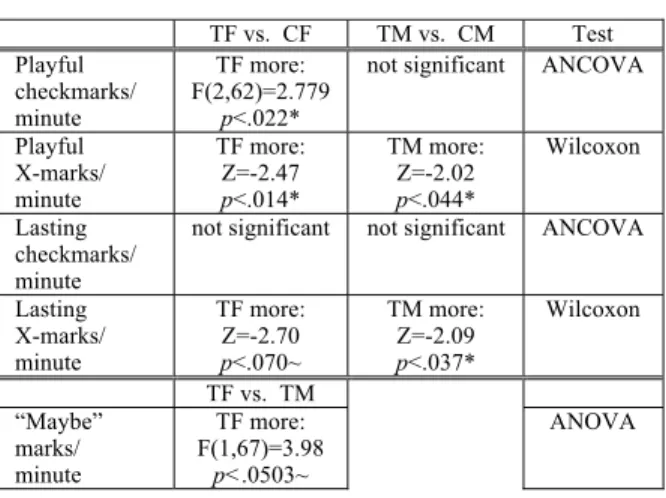
Treatment females approached (tinkered with) the features significantly more than Control females, and this pattern held for both checkmarks and X-marks. Figure 4 illustrates these differences. Regarding these and other feature usage behaviors, Table 1 shows the statistics. For checkmarks, we used ANCOVA, to take self-efficacy into account; for X-marks we used Wil-coxon rank-sum, since the number of ties at zero made the distribution non-normal. Since Wilcoxon does not facilitate a way to take self-efficacy into account, these
results are especially noteworthy: despite significantly lower self-efficacy, Treatment females showed more interest in the features than Control females.
Why these effects? One reason may be the “maybe” checkmarks and X-marks, which were available in the Treatment environment (see Table 1). (Recall that the features are designed to ameliorate differences between low self-efficacy and high self-efficacy users. Hence, we did not use self-efficacy as a covariate in this test because doing so makes allowances for lower self-efficacy users, and we wanted results for that test with-out such allowances.)
Even more important than debugging feature usage per se was the fact that the feature usage was helpful. The total (playful plus lasting) number of checkmarks used per debugging minute, when accounting for pre-self-efficacy, predicted the maximum percent tested-ness per debugging minute achieved by females in both the Control group (total checkmarks per debugging minute: M=0.59, SD=0.43; ANCOVA: F(2,27)=18.04,
=0.0099, R2=0.57, p<.000010) and in the Treatment
group (total checkmarks per debugging minute:
M=0.63, SD=0.53; ANCOVA: F(2,32)=31.11,
=0.0074, R2=0.66, p<.000010). Further, for all par-ticipants, maximum percent testedness, accounting for pre-self-efficacy, was a significant factor in the number of bugs fixed (maximum percent testedness: M=0.57 (56.5% testedness), SD=0.22; bugs fixed: M=3.36,
SD=1.65; ANCOVA: F(2,129)=8.88, =2.47, R2=0.12, p<.00024).
There is one very familiar feature that successful testers and debuggers must use: editing. However, overreliance on editing as one’s main problem-solving feature is time-wasting and can lead to introducing errors. Past studies have reported an overreliance by females on these familiar features [2], a finding consis-tent with their often low self-efficacy.
In the current study, Treatment females’ usage of Table 1: Tinkering. 35 Treatment females, 30 Control females, 34 Treatment males, 33
Con-trol males. **: p<0.01, *: p<0.05, ~: p<0.1. TF vs. CF TM vs. CM Test Playful checkmarks/ minute TF more: F(2,62)=2.779 p<.022*
not significant ANCOVA
Playful X-marks/ minute TF more: Z=-2.47 p<.014* TM more: Z=-2.02 p<.044* Wilcoxon Lasting checkmarks/ minute
not significant not significant ANCOVA
Lasting X-marks/ minute TF more: Z=-2.70 p<.070~ TM more: Z=-2.09 p<.037* Wilcoxon TF vs. TM “Maybe” marks/ minute TF more: F(1,67)=3.98 p<.0503~ ANOVA Figure 4: Tinkering with X-marks (left) and
-marks (right), in -marks per debugging minute. Note the gender gaps between the Control females and males medians. These gaps
editing was superior to Control females’. Specifically, value edits significantly predicted maximum percent testedness per debugging minute for Treatment females (ANCOVA: F(2,32)=4.18, =0.014, R2=0.21, p<.039), but not for Control females (ANCOVA: F(2,27)=0.77, =0.0056, R2=0.054, p<.28). Testing is trying values, but testedness advances based on coverage of formula interrelationships. Thus, in order to increase the spreadsheet’s testedness, value edits must be done in-telligently, such as by picking values that test each clause of an if/then expression. The fact that value edits were predictive of Treatment females’ maximum percent testedness shows the participants were indeed choosing effective values, thus implying that they were using the testing strategy supported by the WYSIWYT features.
Treatment females’ formula edits did not predict testedness (ANCOVA: F(2,32)=1.61, =-0.0001, R2=0.091, p<.98), which makes sense since testing is about values. However, Control females’ did—but in a negative direction (ANCOVA: F(2,27)=2.39, =-0.0064, R2=0.15, p<.045)! Obviously, the greater proportion of time people devote to editing formulas, the less time they have to use the testing and debug-ging features. Overreliance on editing formulas thus interferes with real progress in testing, just as happened to the Control females.
Taken together, the feature usage results show marked differences between Treatment females versus Control females, all of which were beneficial to the Treatment females. In contrast, except where noted above, there were no significant differences between the male groups. Most important, none of the changes benefiting the females showed adverse effects on the males.
5.2 The Gender Gap in Self-Efficacy
Self-efficacy has been found to be important to both feature usage and to various measures of debugging success for female end-user programmers [2, 3]. Thus, reducing the gender gap in self-efficacy was one of the goals of the new features.
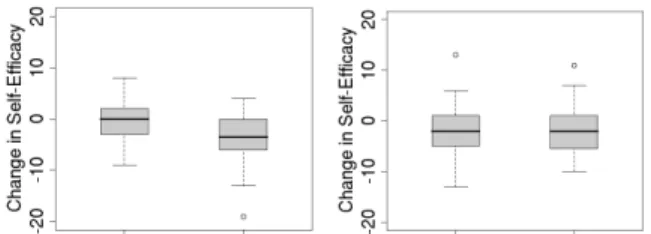
Debugging is a difficult task, and in our past stud-ies, participants’ confidence in their debugging has always decreased during the experiments. Consistent with this but encouraging, in the current study, measur-ing the change between pre- and post-self-efficacy revealed suggestive evidence that Treatment females’ decrease was less than Control females’ decrease (Con-trol females’ change in self-efficacy: M=-4.05,
SD=5.00; Treatment females: M=-1.91, SD=5.14; ANOVA: F(1,63)=2.86, p<0.096); see Figure 5.
Low self-efficacy is appropriate when it judges one’s abilities accurately. The problem is only when it is inappropriately low (underconfidence) or inappro-priately high (overconfidence), either of which can
lead to problems with persistence and strategy deci-sions. That is the reason one goal of the features was to improve people’s ability to self-judge.
As Table 2 shows, for both groups of males, their post-self-efficacy was appropriate for (predicted by) their debugging performance. Evidence of this regard-ing Treatment females was suggestive. There was no evidence of it for Control females.
5.3 What Females Said About Confidence
We triangulated the suggestive evidence of positive effects on Treatment females’ self-efficacy with evi-dence from what they said.
A post-session questionnaire asked participants which parts of the software affected their confidence in their ability to fix bugs. We analyzed their free-text responses, both positive and negative, as described in Section 4.2. An example of a positive statement from the Treatment group was: “I really liked the video. It was very helpful and easy to use. I also like the X-mark, checkmark system.”
Treatment females said more positive things about the features and information provided to them. Table 3 summarizes the analysis results at or approaching sig-nificance for females. One Treatment participant wrote “I did not know how to test the cells until I watched the video.” A Control participant wrote, “The x function and highlight of affecting boxes was helpful
Figure 5: Change in self-efficacy for (left) Con-trol and (right) Treatment participants. Table 2: Means, SD, and results of linear re-gression tests as to whether bugs fixed per debugging minute is predictive of post-self-efficacy for Control females, Control males, Treatment females, and Treatment males.
**:p<0.01, *: p<0.05, ~: p<0.1. CF CM TF TM Bugs: M=0.067 SD=0.042 Post-SE: M=36.12 SD=5.55 Bugs: M=0.092 SD=0.026 Post-SE: M=39.50 SD=4.70 Bugs: M=0.065 SD=0.039 Post-SE: M=34.86 SD=6.49 Bugs: M=0.084 SD=0.040 Post-SE: M=39.12 SD=5.51 F(1,28)=2.07 =34.46 R2=0.069 p<.17 F(1,31)=6.92 =76.79 R2=0.18 p<.014* F(1,33)=3.62 =52.86 R2=0.099 p<.066~ F(1,32)=6.33 =56.49 R2=0.17 p<.018*
to find bugs.”
Treatment males did not differ much from Control males in positive or negative statements. See Figure 6 for a comparison with females. However, the Treat-ment males did appreciate the availability of explana-tions: they spoke more positively about information than their Control counterparts did (Wilcoxon rank-sum test: Z=-2.21, n=67, p<.028). There were no other significant differences for males.
The significant differences in positive statements by Treatment females support the hypothesis that the Treatment environment supported females’ confidence better than the Control environment.
6. Discussion
As we mentioned earlier, this experiment did not tease apart the impacts of the nuanced (“maybe”) judgments feature from the impacts of the strategy ex-planations. We expected the use of strategy explana-tions to be a factor in closing the gap between females’ and males’ debugging success, as recent studies have
shown the benefit of tutorial materials on females’ per-formance in software development tasks [9, 11, 20]. But we do not know whether this was the case; we did not find direct evidence of an impact of the strategy explanations alone on female success rates.
We had hoped to investigate this by analyzing rela-tionships between the number of minutes spent view-ing explanations and measures of each participant’s success. Assessing ties to success involves interaction of participants’ use of strategies and their self-efficacy. The relationships in our data appear to be both com-plex and non-linear, making it difficult to interpret their meaning. Further research will require in-depth qualitative investigation to better understand what in-dividuals learned from the strategy explanations and how they applied this knowledge to their debugging task.
The combination of nuance and strategy explana-tions was tied to numerous quantifiable benefits for females. Gender differences in problem-solving strate-gies may explain this outcome. In a recent study [21], we found eight strategies that male and female partici-pants used to debug spreadsheets, such as “code inspection,” “dataflow,” “fixing formulas,” and “test-ing”. Of the eight strategies, there were significant gender differences in seven. None of the females’ most effective strategies (code inspection and specifi-cation checking) are well supported by spreadsheet software (ours or others’), whereas males’ most effec-tive strategies (testing and dataflow) are well sup-ported.
The testing and dataflow-following strategies were not tied with success for females in the study of [21]. Yet, the new features in this study try to encourage their use, and succeeded: females indeed seem to have done just what we encouraged, namely applying the recommended strategies of testing and following dataf-low, which worked to their advantage. It is not clear, however, whether nudging females in this direction is ultimately the ideal approach. In the future, we plan to investigate whether adding features supportive of strategies favored by females, such as code inspection, will be a better approach than encouraging them toward the strategies currently favored by males.
7. Conclusion
Our results serve to reconfirm previous studies’ re-ports of the existence of a gender gap related to the software environments themselves in the realm of end-user programming. However, the primary contribution is that they show, for the first time, that it is possible to design features in these environments that lower barri-ers to female effectiveness and help to close the gender gap. Specifically, with the addition of nuancing to our testing judgment feature and video/text strategy expla-nation snippets:
Table 3: Means, SD, and results of Wilcoxon rank-sum tests of 35 Treatment females and
30 Control females responses as to influ-ences on their confidence.
CF TF Result
Positive
state-ments overall SDM=0.63 =0.93 SDM=1.26 =1.20 TF more: Z=-2.29, p<.022* Negative state-ments about experiment M=0.40 SD=0.50 SDM=0.20 =0.47 TF less: Z=1.92, p<.055~ Positive state-ments about information M=0.03 SD=0.18 M=0.37 SD=0.65 TF more: Z=-2.70. p<.0070** Positive state-ments about features M=0.10 SD=0.31 SDM=0.29 =0.52 TF more: Z=-1.63, p<.103 All positive statements (positive)
0 5 10 15 20 25 30 CM CF TM TF Information (positive) 0 5 10 15 20 25 30 CM CF TM TF Features (positive) 0 5 10 15 20 25 30 CM CF TM TF Experiment (negative) 0 5 10 15 20 25 30 CM CF TM TF
Figure 6. Selected counts of participants making positive or negative statements. Bars
represent the number of participants in each group who made each type of comment.
• Regarding RQ1, females’ usage of test-ing/debugging features increased, and this fea-ture usage translated into testing and debugging improvements;
• Regarding RQ2, females’ confidence levels im-proved and their self-judgments were roughly appropriate indicators of their actual ability lev-els; and
• Also regarding RQ2, females’ post-session ver-balizations showed that their attitudes toward the software environment were more positive. Furthermore, these gains for females came without disadvantaging the males. Designers of end-user pro-gramming environments can therefore deploy these features into their own environments to help remove unintended barriers that currently impede females’ full participation in end-user programming tasks.
Acknowledgements
We thank the participants of our study. We also thank Derek Inman and Joe Markgraf for their help with the experiment. Discussions with our EUSES colleagues have benefited this work. This work was supported by NSF CNS-0420533, by the EUSES Con-sortium via NSF CCR-0325273 and CCR-0324844, and by an IBM International Faculty Award.
References
[1] Bandura, A. Self-efficacy: Toward a unifying theory of behavioral change. Psychological Review 8, 2 (1977), 191-215.
[2] Beckwith, L., Burnett, M., Grigoreanu, V., and Wieden-beck, S., Gender HCI: What about the software? Com-puter, IEEE (Nov. 2006), 83-87.
[3] Beckwith, L., Inman, D., Rector, K., Burnett, M., On to the real world: Gender and self-efficacy in Excel, In Proc. VLHCC, IEEE (2007), 119-126.
[4] Beckwith, L., Sorte, S., Burnett, M., Wiedenbeck, S., Chintakovid, T., and Cook, C., Designing features for both genders in end-user programming environments, Proc. VLHCC, IEEE (2005), 153-160.
[5] Blackwell, A. First steps in programming: a rationale for attention investment models, Proc. VLHCC, IEEE (2002), 2-10.
[6] Brewer, J. and Bassoli, A. Reflections of gender, reflec-tions on gender: Designing ubiquitous computing tech-nologies, Gender & Interaction: Real and Virtual Women in a Male World, Workshop at AVI, (2006), 9-12. [7] Burnett, M., Cook, C. and Rothermel, G. End-user
soft-ware engineering. Comm. ACM 47, 9 (2004), 53-58. [8] Compeau, D. and Higgins, C. Application of social
cog-nitive theory to training for computer skills. Information Systems Research, 6(2), (1995a), 118-143.
[9] Hartzel, K. How self-efficacy and gender issues affect software adoption and use. Comm. ACM 46, 9 (2003), 167-171.
[10] Jones, M., Brader-Araje, L., Carboni, L., Carter, G., Rua, M., Banilower, E. and Hatch, H. Tool time: Gender and students’ use of tools, control, and authority. Journal
of Research in Science Teaching 37, 8 (2000), 760-783. [11] Kelleher, C. and Pausch, R. Stencils-based tutorials:
Design and evaluation. In Proc. CHI, ACM (2005), 541-550.
[12] Kelleher, C., Pausch, R., and Kiesler, S. Storytelling Alice motivates middle school girls to learn computer programming, In Proc. CHI, ACM (2007), 1455-1464. [13] Kissinger, C., Burnett, M., Stumpf, S., Subrahmaniyan,
N., Beckwith, L., Yang, S., Rosson, M. Supporting end user debugging: What do users want to know? Advanced Visual Interfaces, ACM (2006), 135-142.
[14] Lorigo, L., Pan, B., Hembrooke, H., Joachims, T., Granka, L., Gay, G. The influence of task and gender on search and evaluation behavior using Google, Information Processing and Management (2006), 1123-1131. [15] Martocchio, J. and Webster, J. Effects of feedback and
playfulness on performance in microcomputer software training. Personnel Psychology 45, (1992), 553-578. [16] Meyers-Levy, J. Gender differences in information
processing: A selectivity interpretation. In P. Cafferata & A. Tybout, (Eds) Cognitive and Affective Responses to Advertising. Lexington, Ma, Lexington Books (1989). [17] Rode, J. A., Toye, E. F. and Blackwell, A. F. The
fuzzy felt ethnography - understanding the programming patterns of domestic appliances, Personal and Ubiquitous Computing 8 (2004), 161-176.
[18] Rosson, M., Sinha, H., Bhattacharya, M., Zhao, D. Design planning in end-user web development, In Proc. VLHCC, IEEE (2007), 189-196.
[19] Rowe, M. Teaching Science as Continuous Inquiry: A Basic (2nd ed.). McGraw-Hill, New York, NY (1978). [20] Subrahmaniyan, N., Kissinger, C., Rector, K., Inman,
D., Kaplan, J., Beckwith, L, and Burnett, M. Explaining debugging strategies to end-user programmers. In Proc. VLHCC, IEEE (2007), 127-134.
[21] Subrahmaniyan, N., Beckwith, L., Grigoreanu, V., Bur-nett, M., Wiedenbeck, S., Narayanan, V., Bucht, K., Drummond, R. and Fern, X. Testing vs. code inspection vs. ... what else? Male and female end users’ debugging strategies, In Proc. CHI, ACM (2008), 617-626.
Appendix A: Additional Details
Table A1. Means and SDs of features used per debugging minute by Control females and
males, Treatment females and males.
CF CM TF TM Playful Checks SD=0.091 M=0.082 SD=0.25 M=0.20 SD=0.19 M=0.17 SD=0.16 M=0.15 Playful X-marks M=0.036S D=0.062 M=0.036 SD=0.084 M=0.10 SD=0.18 M=0.046 SD=0.054 Lasting Checks SD=0.40 M=0.51 SD=0.60 M=0.76 SD=0.39 M=0.46 SD=0.43 M=0.66 Lasting X-marks M=0.047 SD=0.16 SD=0.081 M=0.040 SD=0.097 M=0.069 SD=0.087 M=0.059 ”Maybe” Marks na na M=0.32 SD=0.45 M=0.15 SD=0.21 Value Edits SD=0.21 M=0.29 SD=0.30 M=0.41 SD=0.13 M=0.18 SD=0.24 M=0.36 Arrows M=0.20 SD=0.31 SD=0.81 M=0.45 SD=0.19 M=0.14 SD=0.55 M=0.29 Formula Edits M=0.48 SD=0.33 M=0.37 SD=0.13 M=0.40 SD=0.26 M=0.43 SD=0.25