Available online at http://www.partedres.com
ISSN: 2148-6123
http://dx.doi.org/10.17275/per.14.02.1.1
Adapting Computer Programming Self-Efficacy Scale and Engineering
Students’ Self-Efficacy Perceptions
Özgen KORKMAZ*
Department of Computer Education and Instructional Technology, Mevlana University Education Faculty, Turkey
Halis ALTUN
Computer Engineering, Engineering Faculty, Mevlana University Konya/Turkey
Article history Received:
02.05.2014
Received in revised form:
05.05.2014
Accepted:
14.05.2014
Students might have different type and different level of perceptions: Positive or negative perceptions on programming; a perception on benefit of programming, perceptions related to difficulties of programming process etc. The perception of student on their own competence is defined as self-efficacy. Based on the discussions reported in literature, measuring self-efficacy is certainly necessary and, in this context, is highly important in order to develop new pedagogical methods to address the problems related to computer programming. The purpose of this study is to adapt a well-known self-efficacy scale and determine engineering student’s C++ computer programming self-efficacy levels. The sample group consists of 378 engineering students. In order to test the validity of the scale, an exploratory factor analysis has been conducted and item discriminative power has been evaluated. The reliability of the scale, on the other hand, has been justified using the internal consistency level. The results indicate that the scale is reliable and valid, and it can be used to measure the self-efficacy of the engineering student in Turkish cultural environment. Furthermore, it is revealed that the level of self-efficacy perception of the students is middling and it does not show any meaningful difference between genders. On the other hand, self-efficacy perception of students in computer engineering is found to be higher than that of the students in electrical-electronics engineering.
Key words:
Self-efficacy, computer programming, engineering education, validity, reliability
1. Introduction
As a result of rapid technological developments on information and communication technologies, the demands on graduates with a high competence in computer skills are ever-increasing in knowledge-based economies around the world. Furthermore, market analysis shows that the level of investment in software related industries are dramatically increasing compared to hardware related industries, which is a phenomenon that put an emphasis on the learning programming (Lee & Cheng, 2011). As a consequence, such expectations pose a new challenge which should be addressed especially through introducing novel and efficient computer programming courses in higher education institutions. However, despite this tendency and demands on the human sources with high competence and skills of computer programming, there are plenty of studies in literature, which report the deficiency in computer programming education (Lee & Cheng, 2011, Sivasakthi & Rajendran, 2012; Nikula et. al., 2011; Robins, 2010; Tan & et. al., 2009). It is reported that learning of a computer programming requires a considerable cognitive load on students (Garner, 2009) and students are perceived computer programming course as one of the most difficult courses As learning to program is perceived as a difficult task, compared to other subjects, a high drop-out and failure rates are very common (Korkmaz, 2013; Nilsen & Larsen, 2011; Caspersen & Kolling 2009; Bergin & Reilly 2005; Winslow, 1996; Dreyfus & Dreyfus, 1986; ). Therefore, despite the popularity of learning a computer programming increases among the students, the process of acquiring the skill are hard and requires a great amount of effort. Gomes and Mendes (2007) states that there are problems related to acquiring computer programming skills in terms of academic success and level of student’s satisfaction. Fang (2012), Garner (2009) and Nilsen and Larsen (2011) commonly states that students experience difficulties with programming courses and they do not understand the content and algorithmic structure of the programming mainly due to low self-efficacy and motivation.
Learning process of programming skills might be investigated into two main perspectives. The first is the professional software engineering perspective, which aims to undertake big projects requiring a complete competence and synchronized teamwork. On the other hand, the pedagogical perspective is focused on acquiring individual programing skill in a well-defined, limited-scope of framework (Humphrey, 1999; Brooks, 1995; Boehm, 1981). Evaluation of computer language, programming methods and teaching of programming are based on various psychological variables (Erdogan et all., 2008). Psychology of programming requires, beyond programming itself, higher order cognitive and affective processes which compromise of thinking, problem solving, planning and designing. The acquiring “programming” is perceived by students as a process which requires higher order cognitive skills and hence programming courses are perceived as one of the most difficult subjects (Fang 2012; Tan and et. al., 2009; Lau & Uuen, 2009; Milne & Rowe 2002). It is possible to count several factors which affects the success in the learning process, but it is generally accepted that the attitude and self-efficacy perception are the most important factors among the others (Anastasiadou & Karakos, 2011; Erdogan et all., 2008; Sacks et all., 1993; Austin, 1987).
Competence on computer and computer literacy are not just related to the level of knowledge, constraints, applications and the effect of computer but, at the same time, it is directly related to individual’s attitudes towards computer (Levine & Donitsa-Schmith, 1998). In literature it is reported that there is a meaningful relation between the accomplishment of tasks defined in computer environment, and attitudes of student towards computer (Sacks et. all., 1993; Koohang, 1989). Furthermore the studies in literature show that there is a confirmative and meaningful relation between the perception of computer’s usefulness and attitudes towards
computer.
During the learning phase of computer programming, difficulties faced by student contributes directly to development of negative perception on computer. This phenomenon causes a sense of misjudgement among student, that the learning and acquiring a competence on programming is highly difficult process. As consequence, students unconsciously reject the task of learning programming (Tan et. all, 2009). Therefore, it is crucial task to determine, before in hand, the students’ perception on programming and take countermeasure to tackle and address the problems associated with this perception.
Students might have different type and different level of perceptions: Positive or negative perceptions on programming; a perception on benefit of programming, perceptions related to difficulties of programming process etc. The perception of student on their own competence is defined as self-efficacy and it is stated that “different people with similar skills or the same person under different circumstances may perform poorly, adequately, or extraordinarily depending on fluctuations in their beliefs of personal efficacy” (Bandura, 1997). In this context, the self-efficacy perception is a self-evaluation of a person, on his/her competence to conduct a task successfully (Korkmaz 2011; Bandura, 1987) and it is considered as an prediction of a person’s aptitude on what he/she might accomplish, being in aware of his competence to complete the particular task. A person might have all necessary qualities to accomplish a task, but deficiency in self-believe and lack of motivation may give rise a failure. On the other hand, it is reported in literature that self-efficacy has direct effect on the process of acquiring new skill and using the acquired skill. Therefore, the level of self-efficacy might be used as a tool and a reliable indicator in order to predict a person’s performance (Askar & Davenport, 2009).
Based on the discussions reported in literature, measuring self-efficacy is certainly necessary and, in this context, is highly important in order to develop new pedagogical methods to address the problems related to computer programming. Therefore, in this study, the aim is to measure the self-efficacy perception of the students in engineering programs. “Computer Programming Self-Efficacy Perception Scale” (CPSEPS) is translated and adapted in Turkish in order to determine the self-efficacy level of the students in department of electrical & electronics engineering and computer engineering.
2.Method
2.1. Research Model
The present study is an attempt to detect the self-efficacy of the students in the electrical & electronics engineering and computer engineering departments, towards’ C++ programming self-efficacy and it is executed via scan model. Although it is mainly a scale analysis, at the same time, it is also a qualitative research. Within this framework, students’ computer programming self-efficacy perceptions have been attempted to detect.
2.2. Study Group
The study group of the research consists of collectively 378 engineering students from four different Universities. The 3rd and 4th year students from computer engineering and electrical & electronical engineering departments are involved in the study. All students have already taken C++ programming languages course. The distribution of students with respect to gender, university, class and department is summarized in Table 1.
Table 1. The distribution of study group with respect to gender, university, class and department
Departments Class Gender
Bulent Ecevit Un. Erciyes Un. Karabu k Un Nigde Un. Total Computer Eng. 3rd Male 0 0 47 0 47 Female 0 9 16 0 25 4th Male 28 8 24 12 72 Female 12 8 4 5 29 Electical-Electronics Eng. 3rd Male 24 0 0 37 61 Female 3 0 0 5 8 4th Male 21 0 13 64 98 Female 13 0 7 18 38 Total 101 25 111 141 378 2.3. Measurement Tool
The data of this research have been collected via Computer Programming Self-Efficacy Scale (CPSES) designed by Ramalingam and Wiedenbeck (1998). The instrument consists of thirty-two items about programming in the C++ Language. The strength of self-efficacy is measured by responses on a 7-point Likert-type scale ranging from 1 (not confident at all) to 7 (absolutely confident). The instrument was validated by administering the test first during the first week of the semester to 421 students (324 males) enrolled in eight sections of an introductory computer programming course by authors. The results of exploratory factor analysis suggested four factors which Ramalingam and Wiedenbeck (1998) labeled: (1) independence and persistence, (2) complex programming tasks, (3) self-regulation, and (4) simple programming tasks. Reliability coefficients were calculated for the scores on the full thirty-two item scale and the empirically derived factors which emerged in the exploratory factor analysis. Test-retest reliability was also calculated. The overall alpha reliability of the scores was found to be .98. The corrected item-total correlations ranged from .50 to .84. The alpha reliabilities of the factors were: (1) independence and persistence = .94, (2) complex programming tasks = .93, (3) self-regulation = .86, and (4) simple programming tasks = .93.
2.4. Scale Adaptation Process
In the process of scale adaptation, according to Hambleton and Patsula (1999), translation step is the one of the most critical phases. In this stage the original scale has been translated by an educational technologists and a computer engineer who are efficient in both Turkish and English languages. For the noticeable differences of statement between expert translators, a second opinion has been asked and translation procedures have been finalized. Subsequently the adapted scale has been reviewed and amended by a language specialist. The final translation form has been retranslated into English by two experts as stated by Hambleton and Patsula (1999) as well and the consistency with the original item structures has been analyzed. In this analysis it has been realized that the items in original scale and the items in the Turkish form have linguistic equivalence.
Following this stage the adapted test needs to be applied on test group (Deniz, 2007). Within that scope the test that has been adapted and amended must be applied on the pilot group prior to examining psychometric features and it should be detected if there are any other changes need to be done on the scale. The adapted test has been inspected by 21 students from 2nd year in Computer Engineering Department and was reevaluated in line with student views. Following the formation of the scale form accordingly, the scale has been applied on total 378
students in order to evaluate the factor structure of the scale, the structure validity, the scale scores’ reliability and the distinctiveness of items. Based on the data extracted from the application, the factor structures for the Turkish form of the scale have been analyzed.
Following the application of draft scale on the study group, SPSS 15.0 and Lisrel 8.7 are utilized to conduct the scale’s validity and reliability analyses of the obtained data statistically. The validity of scale’s factor structure within Turkish culture has been tested via confirmatory factor analysis (Gülbahar & Büyüköztürk, 2008). The basic parameters of confirmatory factor analysis indicated that the factor structure of the scale is not matching the criteria set for model-data compatibility for both the first and secondary levels detected in Turkish culture hence an explanatory factor analysis was deemed necessary. In order to measure the reliability of the scale, internal consistency analyses have been conducted on data.
2.5. Data Analysis
The factor structure of self-efficacy scale has been analyzed via exploratory factor analysis. As part of the statistical analyses, KMO and Bartlett test analyses were carried out on the data collected with the scale. The fact that the KMO value was over 0.90 is interpreted that the data set is perfectly appropriate for factor analysis. In addition, it is seen that the null hypothesis was rejected with a significance level of 0.05 according to the Bartlett test values, which are known to be the unit matrix of the correlation which it tests (Eroglu, 2008; Büyüköztürk, 2002).
In the light of the values obtained, the exploratory and confirmatory factor analyses were conducted on the data, the scale’s allocation to the factors was specified through principal component analysis and the factor loads were examined using the Varimax rotation method. The items with a factor load lower than 0.30 and the items that do not have at least 0.1 differences between their loads on two factors, or in other words, the items with loads separated into two factors, should be removed (Büyüköztürk, 2002). As a matter of fact, the factor loads of the items in the scale over 0.30 and at least 40% of the general variance is found to be sufficient for the behavioral sciences (Eroglu, 2008; Büyüköztürk, 2002; Kline, 1994; Scherer et. all, 1988). For item distinctiveness effects, item total correlations and Cronbach’s alpha internal consistency coefficients have been calculated.
The score obtainable from the scale is in the range of the minimum 28 and the maximum of 196 points. According to this the levels that are the equivalents of scores obtained from sub scales can be given such: 28-84: Low Level; 85-140: Medium Level; 141-196: High Level. On these data, the frequency, percentage, arithmetical means, standard deviation and t, Anova and Scheffe tests have been employed in order to detect self-efficacy perception levels of students. In differentiation analyses p<0,05 significance level has been considered sufficient.
3. Findings
3.1. Findings relevant of Scale’s Validity
3.1.1. Structural validity
In order to test the structural validity of the CPSES, firstly Kaiser-Meyer-Oklin (KMO) and Bartlett tests were applied to the data and their results were found to be KMO=
0.958 and χ2= 9495,954; df=496 (p=0,000) for the Bartlett test. In terms of these values, it was seen that factor analysis could be conducted on the 32-item scale. In the first place, principal component analysis was conducted in order to determine whether the scale was one-dimensional or not. Then, the Varimax rotation method was used according to the principal components. In line with this, after 4 items with less than 0.40 item load were removed from the scale, the factor analysis was applied to the remaining items again. After these processes, it was seen that the remaining 28 items in the scale were gathered as a single factor. It was found that the KMO value of the final 28-item scale was 0.960 and the Bartlett values were χ2=8169.752; df=378; (p<0.000). After these processes, the findings regarding the item load, the Eigen value and variance explaining the percentages of one dimension for the remaining 28 items are presented in Table 2.
Table 2. Factor analysis results of the scale
Items Common factor variances Factor Loads
I1 I can write syntactically correct C/C++ statements. ,503 ,709 I2 I understand the language structure of C/C++ and the usage of the
reserved words. ,494 ,703
I3 I can write logically correct blocks of code using C/C++ ,535 ,731 I4 I can write a C/C++ program that computes the average of any given
number of values. ,448 ,670
I5 I can use built-in functions that are available in the various C/C++
libraries ,500 ,707
I6 I can write a small C/C++ program given a small problem that is
familiar to me ,604 ,777
I7 I can write a reasonably sized C/C++ program that can solve a
problem that is only vaguely familiar to me ,513 ,716
I8 I can write a long and complex C/C++ program to solve any given
problem as long as the specifications are clearly defined ,640 ,800 I9 I can organize and design my program in a modular manner ,610 ,781
I10 I understand the object-oriented paradigm ,448 ,669
I11 I can identify the objects in the problem domain and declare, define,
and use them ,479 ,692
I12 I can make use of a pre-written function, given a clearly labeled
declaration of the function ,553 ,744
I13 I can debug (correct all the errors) a long and complex program that
I had written and make it work. ,501 ,708
I14 I can comprehend a long, complex multi-file program. ,522 ,722 I15 I could complete a programming project if someone showed me
how to solve the problem first. ,516 ,718
I16 I could complete a programming project if I had only the language
reference manual for help. ,464 ,681
I17 I could complete a programming project if I could call someone for
help if I got stuck. ,507 ,712
I18 I could complete a programming project once someone else helped
me get started. ,512 ,716
I19 I could complete a programming project if I had a lot of time to
complete the program. ,504 ,710
I20 I could complete a programming project if I had just the built-in
help facility for assistance. ,473 ,688
I21 I could find ways of overcoming the problem if I got stuck at a point
while working on a programming project. ,651 ,807
I22 I could come up with a suitable strategy for a given programming
project in a short time. ,611 ,781
I23 I could manage my time efficiently if I had a pressing deadline on a
programming project. ,523 ,723
multi-file program given to me
I25 I could rewrite lengthy confusing portions of code to be more
readable and clear. ,580 ,762
I26 I can find a way to concentrate on my program, even when there
were many distractions around me ,381 ,618
I27 I can find ways of motivating myself to program, even if the
problem area was of no interest to me. ,488 ,699
I28 I could write a program that someone else could comprehend and
add features to at a later date. ,552 ,743
Eigenvalue 14,726
Explained variance 52,591
As seen in Table 2, it was found that the unrotated factor loads of the remaining 28 items were between 0.448 and 0.651, while the rotated factor loads after the Varimax rotation method was applied were between 0.618 and 0.807. The Eigen value of the factor within the general scale is 14,726 and its contribution to the general variance is 52.591%.
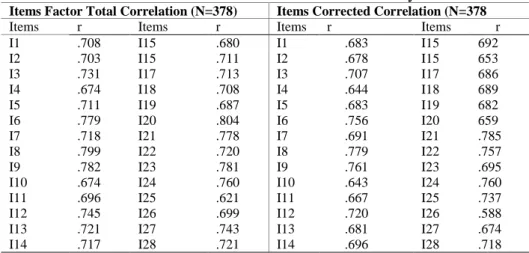
3.1.2. Item Factor Total and Corrected Correlations
In this section, the correlations between the scores obtained from each item and the scores obtained from the total scores with the item total correlation and corrected item correlation method were calculated and each item’s level of serving the general purpose was tested. The item-factor correlation values and corrected correlation values for each item are presented in Table 3.
Table 3. Item-factor scores correlation analysis
Items Factor Total Correlation (N=378) Items Corrected Correlation (N=378
Items r Items r Items r Items r
I1 .708 I15 .680 I1 .683 I15 692 I2 .703 I15 .711 I2 .678 I15 653 I3 .731 I17 .713 I3 .707 I17 686 I4 .674 I18 .708 I4 .644 I18 689 I5 .711 I19 .687 I5 .683 I19 682 I6 .779 I20 .804 I6 .756 I20 659 I7 .718 I21 .778 I7 .691 I21 .785 I8 .799 I22 .720 I8 .779 I22 .757 I9 .782 I23 .781 I9 .761 I23 .695
I10 .674 I24 .760 I10 .643 I24 .760
I11 .696 I25 .621 I11 .667 I25 .737
I12 .745 I26 .699 I12 .720 I26 .588
I13 .721 I27 .743 I13 .681 I27 .674
I14 .717 I28 .721 I14 .696 I28 .718
**
p<, 001
As seen in Table 3, the item test correlation coefficients vary between 0.621 and 0.804. Each item is in a significant and positive relationship with the general factor (p<0,000). Besides, as seen in Table 3, the corrected correlations between each item and the total score that it belongs to vary between 0.588 and 0.779. In this regard, it can be said that each item serves both the general purpose of the scale.
3.1.3. Item Discrimination
The discrimination power of the items in the scale was calculated. For this reason, firstly, the raw scores obtained from each items are ranged from the highest to the lowest. Then, the lowest and highest groups of students which formed by including the top 27% and the bottom of 27%, the total of 103 students, were determined. The t test values of the independent
groups were calculated with the total scores in the group. The findings regarding the t test values and significance levels of the discrimination powers are presented in Table 4.
Table 4. Item discrimination powers
Items t Items t Items t Items t
I1 -16,558 I8 -23,087 I15 -16,975 I22 -18,922
I2 -17,387 I9 -24,129 I16 -13,351 I23 -15,056
I3 -17,501 I10 -17,717 I17 -14,992 I24 -21,370
I4 -15,495 I11 -19,234 I18 -15,502 I25 -19,709
I5 -17,355 I12 -19,146 I19 -14,909 I26 -11,010
I6 -23,641 I13 -17,294 I20 -13,799 I27 -14,370
I7 -19,108 I14 -19,333 I21 -20,829 I28 -17,727
df: 204; p<.001 N=378
In Table 4, it can be seen that the independent sample t test values regarding the 28 items, the total score in the scale varies between -21.370 and -13.351. The t value for the general scale was found to be -37.133. The level of each difference determined is significant (p<0,001). In this regard, it can be said that the general scale of the scale have high item discrimination power.
3.1.4. Internal Consistency Level
The scale’s whole reliability analyses were conducted using Cronbach’s alpha reliability coefficient. The scale’s Cronbach’s Alpha reliability coefficient was found to be 0.966. In this regard, it can be said that the general scale can make consistent measurements.
3.2. Findings relevant of Self-Efficacy Perceptions Levels of Engineering Students'
Self-efficacy perceptions levels of engineering students' are as summarized in Table 5.
Table 5. Engineering students’ self-efficacy perceptions levels
Değişken N sd Min Max Levels (f/%)
Low Medium high
Computer Eng. 173 126.99 29.85 33 193 15 8.57 100 57.8 58 33.5
Electrical-Electronics Eng 205 109.14 36.11 28 193 51 24.9 116 56.6 38 18.5
Total 378 117.31 34.52 28 193 66 17.5 216 57.1 96 25.4
As shown in Table 5, students’ self-efficacy perceptions levels change between 28 and 193; the mean is =117.31. As data on Self-Efficacy Perceptions Levels are examined it is detected that more than half of the students (57.15%) have medium, 25.4% have high and 17.5% have low level Self-Efficacy Perceptions. Accordingly it can be argued that students’ self-efficacy perception levels are medium. As the scores obtained from each of the departments are examined, it has been detected that the students from Computer Engineering Department have the highest average which is =126.99. In Table 6, the students’ self-efficacy perceptions levels with respect to departments are summarized.
Table 6. The effect of departments on self-efficacy perceptions levels
Variables N Sd T df P
Self-Efficacy Computer Eng. 173 126.9 2.27 5.178 376 .000 Electrical-Electinical Eng 205 109.1 2.52
meaningful differentiation on their self-efficacy perception levels (t(2-276)=5.178; p<0,001). According to score means computer engineering student’s perceptions higher than Electrical-Electronics Engineering students’ perceptions. It can thus be asserted that self-efficacy perceptions levels of students from Electrical-Electronics Engineering Department is meaningfully lower than students receiving training in the other two departments.
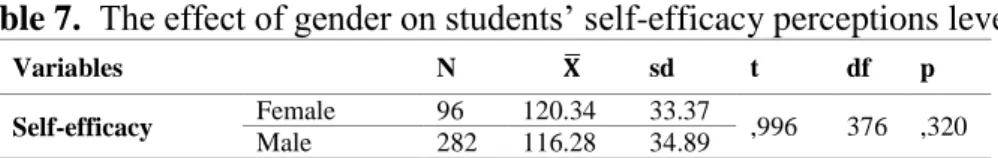
In Table 7, the findings relevant of students’ self-efficacy perceptions Levels with respect to gender are summarized.
Table 7. The effect of gender on students’ self-efficacy perceptions levels
Variables N sd t df p
Self-efficacy Female 96 120.34 33.37 ,996 376 ,320
Male 282 116.28 34.89
As given in Table 7, there is not a meaningful difference in students’ self-efficacy perceptions levels with respect to gender (t(2-376)=-0,996; p>0,05). Therefore it can reasonably be argued that gender has no effect on students’ self-efficacy perceptions skill levels.
4. Conclusion and Discussion
In present study, “Computer Programming Self-Efficacy Scale (CPSES)” has been adapted into Turkish to detect students’ self-efficacy perceptions levels. The scale is consisting of 28 items that can be collected as a single dimension. The strength of self-efficacy is measured by responses on a 7-point Likert-type scale ranging from 1 (not confident at all) to 7 (absolutely confident). According to the findings obtained from exploratory factor analysis, it was seen that the unrotated factor loads of the remaining 28 items were between 0.448 and 0.651 while the rotated factor loads, after the Varimax rotation method, were between 0.618 and 0.807. The Eigen value of the factor within the general scale is 14,726 and its contribution to the general variance is 52.591%. Accordingly the correlation values between each scale item and scores belongs to change between 0.621 and 0.804. Hence it can be asserted that each item in the scale serves meaningfully to the characteristics aimed to be measured via the whole scale and each item has the desirable level of distinctiveness. The discrimination power of the items in the scale was calculated. According to this, it can be said that the general score of the scale has a high item discrimination power. Internal consistency coefficients of scale have been calculated via Cronbach’s Alpha reliability formula. According to this the scale’s Cronbach’s Alpha reliability coefficient was found to be 0.966. Consequently it can reasonably be argued that “Computer Programming Self-Efficacy Scale (CPSES)” is a valid and reliable scale that can be employed in detecting students’ self-efficacy perception levels of engineering students in Turkey.
Additionally below given results have been obtained regarding students’ self-efficacy perception levels: students’ self-efficacy perception levels are generally medium. This finding is consistent with the literature. Indeed, similar conclusions were reached made by Robins et al., (2003), Hernane et al. (2010) and Hawi (2010).
As programming skill is an essential part of their career, it can be concluded that the level of students’ self-efficacy perception in engineering faculties is not adequate and acceptable. This level of self-efficacy is an indicator that the students in the department of computer and electrical-electronics engineering do not possess self-efficacy in C++ computer programming and they are lack of confidence in developing a complete software solution to a given
problem. At this point, it is crucially important to highlight possible factors which contribute to lack of self-efficacy among the student and to shed light on the main problems so as to provide a treatment in order to alleviate the main obstacles.
Students’ self-efficacy perception levels do not differ with respect to gender. In a study conducted by McDowell et all. (2003), it was concluded similarly that there is no significant variation between women and men in terms of the scores they attain on programming skills. Similar findings can also be found in the works of Pioro, (2004) and Lau and Yuen (2009). In contrast, however, results in the literature can be heard. For example in a study conducted by Askar and Davenport (2009), female students had significantly lower initial self-efficacy beliefs compared with those of their male peers. Self-efficacy perception levels of students from Electrical-Electronics Engineering Department are meaningfully lower than from Computer Engineering Department. The reason behind this finding could be the fact that the computer engineering students generally takes more computer programming related courses than the students in the electrical-electronics engineering department. In this context, it can be said that the difference is quite natural.
In relevant literature, it is found that there are limited researches on the students’ self-efficacy perception levels towards C++ programming language. Therefore, within this framework, it can be suggested that various studies should be conducted to analyse students’ self-efficacy perception levels towards programming languages.
5. Acknowledgements
A part of this article presented on 3th Word Conference on Information Technology
6. References
Anastasiadou, S.D., & Karakos, A.S. (2011). The beliefs of electrical and computer
engineering students’ regarding computer programming. The International Journal of Technology, Knowledge and Society, 7(1):37-51.
Askar, P., &, Davenport, D. (2009). .An investigation of factors related to self-efficacy for java Programming among engineering students .The Turkish Online Journal of Educational Technology TOJET. 8(1): 26-32
Austin, H.S. (1987). Predictors of Pascal Programming Achievement for Community College Students. Proceedings of the eighteenth SIGCSE technical symposium on Computer science education, Missouri, United States, 161-164.
Bandura, A. (1986), Social Foundations of Thought and Action: A Social Cognitive Theory. Prentice Hall, Englewood Cliffs, NJ.
Bergin, S., & Reilly, R. (2005). The influence of motivation and comfort-level on learning to program. In University of Sussex, Brighton, UK.
Boehm, B. W. (1981). Software engineering economics. Englewood Cliffs, NJ: Prentice-Hall. Brooks, F. P. (1995). The mythical man-month: Essays on software engineering anniversary
edition. Reading, MA: Addison-Wesley.
Büyüköztürk, Ş. (2002). Sosyal bilimler için veri analizi el kitabı [Data analysis handbook for social sciences]. Ankara: PegemA Press.
Caspersen, M.E., & Kolling M. (2009). STREAM: A first programming process. ACT Transaction on Computing Education, 9,1-29.
Deniz, K.Z. (2007). The adaptation of psychological scales. Ankara University, Journal of Faculty of Educational Sciences, 40(1), 1-16.
Dreyfus, H., & Dreyfus, S. (1986). Mind over machine: The power of human intuition and expertise in the era of the computer. New York: Free Press.
Erdogan, Y., Aydin, E., & Kabaca, YT. (2008). Exploring the Psychological Predictors of Programming Achievement. Journal of Instructional Psychology, 35(3), 264-270.
Eroglu, A. (2008). Faktör analizi [Factor Analyze]. Ş. Kalaycı (Ed.), SPSS Uygulamalı çok değişkenli istatistik teknikleri [Applied multivariate statistical technique] (ss. 321-331). Ankara: Asil Yayın Dağıtım.
Fang, X. (2012). Application of the participatory method to the computer fundamentals course, Affective Computing and Intelligent Interaction. Advances in Intelligent and Soft Computing, 137, 185-189.
Garner, S. (2009). Learning to program from Scratch. 9th IEEE Int. Conference on Advanced Learning Technologies, 451-452, Doi: 10.1109/ICALT.2009.50.
Gomes, A., & Mendes, A., J.(2007). Learning to program-difficulties and solutions.
International Conference on Engineering Education, ICEE. 3-7 Temmuz, Coimbra, Portugal.Available at http://ineer.org/Events/ICEE2007/papers/411.pdf
Gülbahar, Y. & Büyüköztürk, Ş. (2008). Değerlendirme tercihleri ölçeğinin Türkçeye uyarlanması [Adaptation of evaluation choices scale into Turkish]. Hacettepe University Faculty of Education Journal, 35, 148-161.
Hambleton, R.K., & Patsula, L. (1999). Increasing the validity of adapted tests: myths to be avoided an guidelines for improving test adaptation practices. Journal of Applied Testing Technology,1(1), 1-30.
Hawi, N. (2010). Causal attributions of success and failure made by undergraduate students in an introductory-level computer programming course. Computers & Education 54, 1127–1136, Doi: 10.1016/j.compedu.2009.10.020.
Hernane, B., P., Gilney F., Z., & Marcelo A., M.(2010). Learning computer programming: Implementing a fractal in a Turing machine. Computers & Education 55 767-776 Doi: 10.1016/j.compedu.2010.03.009
Humphrey, W.S. (1999). Introduction to the team software process. Reading, MA: Addison- Wesley/Longman.
Kline, P. (1994). An easy guide to factor analysis. London and New York: Routledge. Koohang, A. A., (1989). A Study of Attitudes Toward Computers: Anxiety, Confidence,
Liking, and Perception of Usefulness. Journal of Research on Computing in Education, 20, 137-151.
Korkmaz, Ö. (2011). Study of validity and reliability of self-efficacy scale of teaching material utilization. Educational Research and Review (ERR). 6(15),843-853. Doi: 10.5897/ERR11.174
Korkmaz, Ö. (2013). Students’ Difficulties in and Opinions about Designing Algorithms According to Different Instructional Applications. Energy Education Science and Technology Part B: Social and Educational Studies , 5(1), 209-218.
Lau, W.W. F., & Yuen, A.H.K (2009). Exploring the effects of gender and learning styles on computer programming performance: implications for programming pedagogy. British Journal of Educational Technology, 40(4), 696–712.
Doi:10.1111/j.1467-8535.2008.00847.x
Lee, J., & Cheng, Y.C. (2011). Change the face of software engineering education: A field report from Taiwan. Information and Software Technology 53, 51–57.
Levine, T., & Donitsa-Schmidt, S. (1998). Computer use, confidence, attitudes, and knowledge: a causal analysis. Computers in Human Behavior, 14, 125–146.
Mcdowell, C.E., Werner, L., Bullocki H. E., & Fernald, J. (2003). The Impact of Pair Programming on Student Performance and Pursuit of Computer Science Related
Majors. International Conference on Software Engineering, Portland, Oregon. Available at: http://wenku.baidu.com/view/09432408f78a6529647d53be.html
Milne, I., & G. Rowe. (2002). Difficulties in Learning and Teaching Programming—Views of Students and Tutors. Education and Information Technologies, 7(1), 55-66.
Nikula, U., Gotel, O., & Kasurinen J. (2011). A Motivation Guided Holistic Rehabilitation of the First Programming. ACM Transactions on Computing Education (TOCE), 11(4). Doi: /10.1145/2048931.2048935.
Nilsen H., & Larsen A. (2011) Using the personalized system of instruction in an introductory programming course, NOKOBIT, 27-38. November 21-23.
Pioro, B. T. (2004). Performance in an introductory computer programming course as a predictor of future success for engineering and computer science majors. International Conference on Engineering Education, Gainesville, FL.
Ramalingam, V., & Wiedenbeck, S. (1998). Development and validation of scores on a computer programming self-efficacy scale and group analyses of novice programmer self-efficacy. Journal of Educational Computing Research, 19(4), 367-381.
Robins, A (2010). Learning edge momentum: A new account of outcomes in CS1. Computer Science Education, 20( 1), 37–71.
Robins, A. Rountree, J., & Rountree, N.(2003). Learning and Teaching Programming: A Review and Discussion. Computer Science Education, 13( 2), 137–172.
Sacks, C., Bellisimo, Y., & Mergendoller, J., (1993). Attitudes toward computers and computer use: the issue of gender. Journal of Research on Computing in Education, 26, 257-269.
Scherer, R. F., Wiebe F. A., Luther, D. C., & Adams J. S. (1988). Dimensionality of Coping: Factor Stability Using the Ways of Coping Questionnaire, Psychological Reports 62(3), 763-770. PubMed PMID: 3406294.
Sivasakthi, M. & Rajendran, R. (2012). Learning Difficulties of OOP Paradigm Using Java: Students’ Perspective, Indian Journal of Science and Technology, 4 (8), 983-985.
Tan, P.H., Ting C.Y., & Ling, S.W. (2009). Learning Difficulties in Programming Courses: Undergraduates’ Perspective and Perception. International Conference on Computer Technology and Development, 42-46. DOI: 10.1109/ICCTD.2009.188
Winslow, L., E. (1996). Programming pedagogy–A psychological overview. SIGCSE Bulletin, 28, 17–22.