CIVIL & ENVIRONMENTAL ENGINEERING | RESEARCH ARTICLE
Comparison of response surface methodology
and hybrid-training approach of artificial neural
network in modelling the properties of concrete
containing steel fibre extracted from waste tyres
Temitope F. Awolusi1, Oluwaseyi L. Oke1, Olufunke O. Akinkurolere1andOlumoyewa D. Atoyebi2
Abstract:
The study presents a comparative approach between Response Surface
Methodology (RSM) and hybridized Genetic Algorithm of Artificial Neural Network
(GA-ANN) in predicting the water absorption, compressive strength, flexural
strength, split tensile strength and slump for steel fibre reinforced concrete. The
effects of process variables such as aspect ratio, water
–
cement ratio and cement
content were investigated using the central composite design of response
sur-face methodology. This same experimental design was used in training the
hybrid-training approach of artificial neural network. The predicting ability of
both methodologies was compared using the Root Mean Square Error (RMSE),
Mean Absolute Error (MAE), Model Predictive Error (MPE) and Absolute Average
Deviation (AAD). The response surface methodology model was found more
accurate in being able to predict compared to the hybridized genetic algorithm of
the artificial neural network.
Subjects: Neural Networks; Technology; Concrete & Cement; Waste & Recycling Keywords: Response Surface Methodology; hybrid; genetic algorithm artificial neural network; concrete; flexural strength; steel fibre reinforced concrete; civil engineering
Temitope F. Awolusi
ABOUT THE AUTHOR
Temitope F. Awolusi holds both Bachelor’s degree and Master’s degree from the Federal University of Technology, Akure and Ekiti State University, Ado Ekiti respectively. She is currently a Ph.D student of the Ekiti State University, Ado Ekiti. She joined the service of Landmark University, Omu Aran in November 2014 as a Lecturer II in the Department of Civil Engineering before crossing to Ekiti State University, Ado Ekiti in year 2016. She is a member of the Nigeria Society of Engineers (NSE) and a Registered Engineer with the Council for the Regulation of Engineering in Nigeria (COREN).
PUBLIC INTEREST STATEMENT
The necessity for sustainability has brought about the possible inclusion of several waste materials in concrete production. The steel fibre extracted from discarded tyres is an example of such waste material that can be used in con-crete. Research in this area has found the mate-rial suitable for use as reinforcement in concrete. Steel fibres have been identified as having the advantage of reducing the brittle nature of con-crete and as well improve the performance of concrete. However, there is a need to enhance the acceptability of this material for use in con-crete. This has brought about the use of effective predictive modelling techniques to inform an early decision on the fresh and hardened prop-erties of concrete reinforced with steel fibre.© 2019 The Author(s). This open access article is distributed under a Creative Commons Attribution (CC-BY) 4.0 license..
Received: 29 March 2019 Accepted: 23 July 2019 First Published: 30 July 2019 Corresponding author: Olumoyewa D. Atoyebi,Department of Civil Engineering, Landmark University, Omu-Aran, Kwara, Nigeria E-mail:atoyebi.olumoyewa@lmu. edu.ng
Reviewing editor: Sujin Bureerat, Mechanical Engineering, Khon Kaen University, Khon Kaen, Thailand
Additional information is available at the end of the article
1. Introduction
The annual global generation of end-of-life tyres, which is about 1.4 billion units, is estimated to reach 2.5 billion units in 2032 based on a maximum lifespan of 10 years for vehicular tyres (Di Mundo, Petrella, & Notarnicola,2018; Sebola, Mativenga, & Pretorius,2018). The bulkiness, shear volume and resilience of waste tyres make the case of recycling of their principal components indispensable. More importantly, the practical approach of reducing the associated environmental hazards attributed to illegal burning of waste tyres is to reuse them. Many researchers have shown interest in this waste due to its huge quantity (Atoyebi, Odeyemi, Bello, & Ogbeifun,2018; Oliveira, Silva, Abreu, & Fernandes,2013; Pacheco-Torgal, Ding, & Jalali,2012; Shen et al.,2013; Su, Yang, Ling, Ghataora, & Dirar,2014; Thomas & Gupta,2016; Thomas, Gupta, & Panicker,2016).
However, the low recycling rates of waste tyres reported in some developed countries and most developing countries are attributable to the absence of a regulatory framework for the collection, disposal, inefficient recycling process and perceived low economic value of the waste products (Mpanyana,2009). While the possibility of recycling the rubber component of waste tyre has been extensively researched, the steel fibre component has not received considerable attention (Mucsi, Szenczi, & Nagy,2018). One of the promising ways of reusing the steel component of waste tyres is in concrete. This can be done by incorporating the steel fibre component into the concrete mix chiefly to reduce or eliminate the brittleness of concrete amongst other benefits.
According to (Nasir,2009), the addition of conventional steel fibre at a volumetric fraction of 1% approximately doubles the construction cost which tends to limit the use of steel fibres to special applications. These waste tyres provide an alternative approach to obtaining steel fibres at little or no cost for use in concrete. Meanwhile, there is a need also to achieve a proper mix proportion of concrete constituents which accommodates the inclusion of such steel fibres. The optimization of these constituents helps to improve the performance of Steel Fibre Reinforced Concrete (SFRC). In addition to optimization, it is also necessary to explore predictive models that should help in; fast-tracking the design process, reducing laboratory trials and ensuring the reliability of the SFRC for effective application in the construction industry (Nasir,2009).
Response surface methodology (RSM) is an effective modelling technique that could be used to fine-tune the SFRC components mix to achieve desirable properties based on specific/target applications. Quantitative characterization of the efficiency of steel fibres extracted from waste tyres could provide a guide on the use of steel fibres for durable and cost-effective mix design. This study was mainly conducted to develop a procedure for making an informed early decision on the fresh and hardened properties of concrete reinforced with steel fibre extracted from waste tyres. The application of statistical tools such as RSM provides useful information that can be used to refine the design criteria and specification for better performance of a system. Another advantage of statistical tools is the ability to perform quick prediction once fitted into a function (Chopra, Kumar, & Kumar,2015). RSM is a valuable tool for designing experiment, building of models and optimization of search conditions to provide better outputs by fitting effect factors to quadratic functions (Alyamac, Ghafari, & Ince, 2017; Desai, Survase, Saudagar, Lele, & Singhal, 2008; Mohammed, Khed, & Nuruddin, 2018; Şimşek, Uygunoğlu, Korucu, & Kocakerim, 2018; Tyagi, Rana, Kumari, & Jagadevan,2018).
In recent times, the use of Artificial Neutral Network (ANN) which is a mathematical model of the biological neural system promises to be a useful method for experimental modeling and optimization due to its ability to understand the interactions behind complex processes (Ebrahimpour, Rahman, Ean Ch’ng, Basri, & Salleh,2008). The application of Artificial Neural Networks (ANNs) for the prediction and optimization of concrete properties is relatively new. Research in this area has shown that it is one of the best tools for this purpose (Hacene, Ghomari, Schoefs, & Khelidj,2014). The application of ANN is dynamic and comes with hybridization. Hybridization can be achieved by combining intelligent techni-ques such as fuzzy logic, neural networks, genetic algorithm and expert system. For example, when applied to a wide range of real-life problems, they were found to be effective since the limited experience
of one technique can be overcome by the other technique (Nauck & Kruse,1997,1999; Yager & Filev, 2017). Most intelligent techniques can learn from examples which makes them suitable for many applications. Genetic Algorithm (GA) is a form of artificial intelligence technique that imitates the principles of biological evolution. This algorithm involves a general search approach that is stochastic. In this approach, a new population of individuals is generated from the existing populations. GA computes a new population by applying stochastic operators such as selection, crossover and mutation for an initially random population. The searching feature present in GA is population-driven and not trajectory-driven like the gradient descent and LM algorithm (Desai et al.,2008; Ghaffari et al.,2006). The hybridized Genetic Algorithm of Artificial Neural Network (GA-ANN) is another approach that could be used for refining the design criteria for enhanced system performance. According to Fang, Wang, & Zhang (2005), the genetic algorithm employs an evolutional search approach to obtain an optimal solution which differs from the one point at a time approach employed in the gradient descent and Levenberg Marquardt algorithms. When the genetic algorithm is limited in fine-tuning local search within a problem, it is usually integrated with a gradient descent algorithm. The process is referred to as hybrid-training approach. Therefore, the application of the hybrid-training approach enables the weakness of one algorithm to be compensated for by the other (Ghaffari et al.,2006).
This investigation was aimed at developing and comparing the performance RSM and ANN-GA models in predicting the properties of steel fibre reinforced concrete. Both the fresh and hardened properties of steel fibre reinforced concrete were explored in the study (water absorption, com-pressive strength, flexural strength, split tensile strength and slump). The effects of variables such as aspect ratio, water–cement ratio and cement content were utilized for this process. The derived models were then compared using RMSE, MAE, MPE and AAD to identify the most suitable technique for predicting the properties of steel fibre reinforced concrete.
1.1. Comparison of ANN and RSM in literature
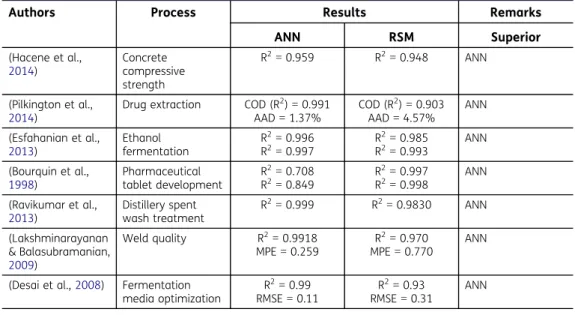
In the last few decades, there have been increasing interests by researchers to investigate the suitability of RSM and ANN modelling techniques in solving practical problems as presented in Table
1while a comparison between both approaches is presented in Figure1. (Hacene et al.,2014) studied probabilistic modelling of compressive strength of concrete using response surface methodology and neural networks. They concluded that the application of either RSM or ANN modelling techniques is a practical approach with a promising future depending on the objectives to be achieved (Hacene et al.,2014). (Esfahanian, Nikzad, Najafpour, & Ghoreyshi, 2013) modelled and optimized ethanol fermentation using saccharomyces cerevisiae. They observed that the prediction by ANN was slightly more precise. Similarly, Pilkington, Preston, & Gomes (2014) compared the performance of both techniques on the extraction of artemisinin fromArtemisia annua. They appraised the models through the coefficient of determination (R2) and the Absolute Average Deviation (AAD) which showed that the ANN was superior to the RSM model in predicting artemisinin recovery.
Prakash Maran, Sivakumar, Thirugnanasambandham, & Sridhar (2013) applied ANN and RSM in modelling and prediction of mass transfer parameters during osmotic dehydration of Carica
Papayausing standard error of prediction, RMSE, MAE, coefficient of determination and MPE. The
results showed that a properly trained ANN model was found to be more accurate in prediction as compared to RSM model. Desai et al. (2008) assessed the performance of ANN-GA and RSM in fermentation media optimization. The ANN-GA was observed to have a better predicting and generalization capacity than the RSM. Bourquin, Schmidli, van Hoogevest, & Leuenberger (1998) explored the applicability of the ANN modelling techniques in studying the data set with the nonlinear relationship of galenical study on a solid dosage form. This was done using the degree of data fitting and predicting abilities of the developed models. Better results were achieved for the model using ANN methodology concerning data fitting and predicting ability. Moghaddam & Khajeh (2015) compared the ability of RSM and ANN in Microwave-Assisted Extraction Procedure to Determine Zinc in Fish Muscles. The predictions by ANN were observed to be more accurate when compared to that of the RSM.
Ravikumar, Renuka, Sindhu, & Malarmathi (2013) investigated the suitability of RSM and ANN in the modelling and optimization of distillery spent wash treatment withPhormidium valderianum. The predictions obtained for both model were close to experimental values but ANN revealed reasonable performance over RSM. The above illustrations showed the vast application RSM and GA-ANN; however, the application of both techniques in modelling the properties of steel fibre reinforced concrete is not readily available.
Syaidathul, Izni, & Ibrahim (2012) utilized steel fibres extracted from waste tyres in reinforcing concrete. It was observed that the inclusion of steel fibres in concrete mix reduced slump with stepwise increase in (0%, 2%, 4%, 8%, 1%) fibre content. (Qi,2003) observed a similar trend with
Table 1. Comparison of ANN and RSM in literature
Authors Process Results Remarks ANN RSM Superior (Hacene et al., 2014) Concrete compressive strength R2= 0.959 R2= 0.948 ANN (Pilkington et al., 2014)
Drug extraction COD (R2) = 0.991 AAD = 1.37% COD (R2) = 0.903 AAD = 4.57% ANN (Esfahanian et al., 2013) Ethanol fermentation R2= 0.996 R2= 0.997 R 2= 0.985 R2= 0.993 ANN (Bourquin et al., 1998) Pharmaceutical tablet development R2= 0.708 R2= 0.849 R2= 0.997 R2= 0.998 ANN (Ravikumar et al., 2013) Distillery spent wash treatment R2= 0.999 R2= 0.9830 ANN (Lakshminarayanan & Balasubramanian, 2009) Weld quality R2= 0.9918 MPE = 0.259 R2= 0.970 MPE = 0.770 ANN
(Desai et al.,2008) Fermentation media optimization R2= 0.99 RMSE = 0.11 R2= 0.93 RMSE = 0.31 ANN Type of Techniques RSM ANN
Regression Supervised learning
learning Interpolation Generalization Observation Training set Parameters Weights Independent Variables Input Output Dependent variables Figure 1. Comparison between
industrially manufactured steel fibre. Therefore, it could be inferred that both industrially manu-factured steel fibre and waste tyres steel fibre have a similar influence on workability measured in terms of slump. Chen & Liu (2005) also observed that the presence of fibres in the concrete mix has a holding effect which prevents segregation of aggregates, surface bleeding and as well encourages uniformity of the mix for better performance. However, it has been recommended that the volumetric fraction of fibre content should not exceed 2% to avoid undesirable conditions such as the formation of balls which can be attributed to the presence of too many fibres (Mastali & Dalvand,2016). These steel fibres are usually discrete, short length and defined by the aspect ratio (length to diameter ratio) in the range of 20 to 100 (ACI Committee 544,1996). An aspect ratio of less than 200 was also suggested by (Neocleous, Tlemat, & Pilakoutas, 2006) and (Pilakoutas, Neocleous, Dipl-ing, & Inge,2006) for steel fibre obtained from waste tyres. It will be worthwhile to predict the properties of steel fibre reinforced concrete by RSM and ANN using varying aspect ratio, water–cement ratio and cement content.
2. Experimental materials, procedure and design 2.1. Experimental materials
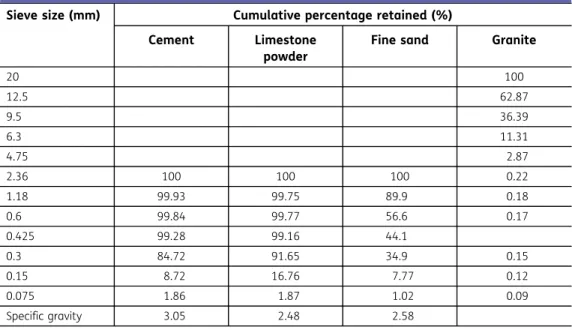
The materials used in the study were the grade 42.5 Portland Cement, limestone powder as filler, steel fibre, high range water reducing admixture, fine river sand as fine aggregates, granite stones as coarse aggregates and potable water. The grading and physical properties of the cement and aggregates are presented in Table2. The steel fibres were extracted from waste tyres by manual shredding. A flow chart of the process is presented in Figure2. Further details of materials used, mix proportion and procedure have been detailed in an earlier publication (Awolusi et al.,2019b). 2.2. Mixing and casting
The concrete mix was prepared with a tilting drum mixer. The revolution speed of the mixer was 60 rpm and the total mixing time varied as presented in Figure3. 100 mm × 100 mm × 100 mm cubes were cast for compressive strength, water absorption and split tensile strength tests. For flexural strength test, beams with dimension 100 mm × 100 mm × 400 mm were used, while the slump was determined using a slump cone of height 300 mm, a bottom diameter of 200 mm and a top diameter of 100 mm. The slump test was done immediately after casting while the speci-mens for compressive strength, water absorption, split tensile strength and flexural strength tests were prepared by placing the concrete into the already lubricated mould and compaction was
Table 2. Grading and physical properties of cement and aggregate Sieve size (mm) Cumulative percentage retained (%)
Cement Limestone powder
Fine sand Granite
20 100 12.5 62.87 9.5 36.39 6.3 11.31 4.75 2.87 2.36 100 100 100 0.22 1.18 99.93 99.75 89.9 0.18 0.6 99.84 99.77 56.6 0.17 0.425 99.28 99.16 44.1 0.3 84.72 91.65 34.9 0.15 0.15 8.72 16.76 7.77 0.12 0.075 1.86 1.87 1.02 0.09 Specific gravity 3.05 2.48 2.58
done in three layers. These specimens were covered in damp sacks in the laboratory for 24 h before demoulding and curing in water until the time of testing. The tests for compressive, split tensile and flexural strengths were done at 28 days while the water absorption test was done after 24 h of immersing in water.
2.3. Development of quadratic response surface model
The experimental design often plays a major role in determining the total number of experiments required during the investigation. The study utilized the central composite design of RSM in deter-mining the required number of experiments. According to (Pilkington et al., 2014), the central composite rotatable design provides an opportunity for introducing axial points into the experimen-tal design. A toexperimen-tal of 20 experimenexperimen-tal runs were generated using the central composite design. The central composite design is generally used to ensure accurate prediction when examining larger spread conditions in which the complexity of the model is not known by providing five levels for each process variable. The architecture for the RSM modelling technique is presented in Figure4. The process variables considered in the study at different levels are given in both actual and coded terms as follows:
● Aspect ratio (A): 170(+1.68979), 140(+1),95(0), 50(−1), 19.32(−1.68979) ● Water-cement ratio (B): 0.45(+1.68979), 0.40(+1),0.33(0),0.25(−1),0.2(−1.68979) ● Cement content (C): 45.1(+1.68979), 40(+1), 32.5(0),25(−1), 19.(−1.68979)
Figure 2. Extraction process for steel fibre.
Figure 3. Simplified flow chart for the production of steel fibre reinforced concrete (Awolusi
et al.,2019b).
The RSM is usually represented by a quadratic model expressed in a second-order equation as presented in Equation (1). The equation gives the relationship that exists between the three independent variables. y¼a0þ∑ 6 i¼1 aix1þ∑ 6 i¼1 ∑6 i¼1 aijxixj (1)
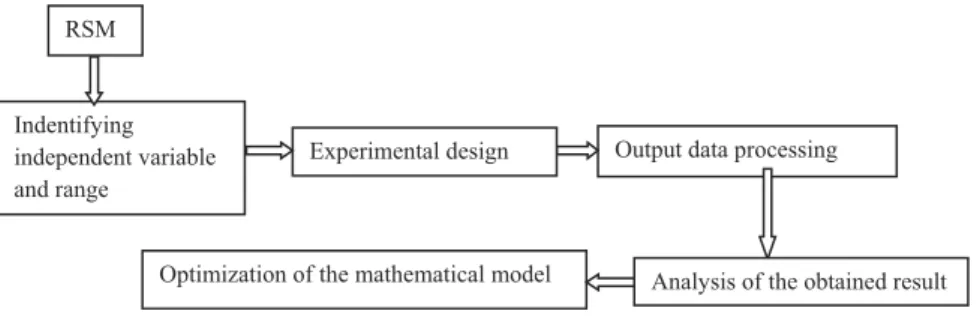
Where Y is the predicted value, a0is a constant and aiand aijare the regression coefficients of the RSM model. The Xiand Xjare the factor variables (Esfahanian et al.,2013). The operation of the RSM is presented in Figure5.
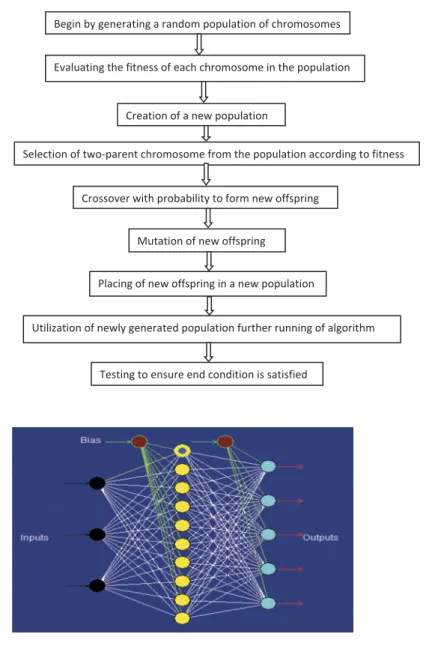
2.4. Design of artificial neural network
Previous researchers have highlighted the disadvantage of using the gradient descent algo-rithm in ANN training because of the likelihood of being caught in a local minimum error function and have proposed an evolutionary approach known as genetic algorithm (GA). However, the inability of GA to provide fine-tuned local search has brought about the hybridi-zation of GA and backpropagation. A block diagram for the operation of genetic algorithm is presented in Figure6. This approach has been recommended for ANN training (Ghaffari et al., 2006). The study obtained a supervised ANN in predicting the five properties of steel fibre reinforced concrete investigated using the hybridized genetic algorithm. The genetic algorithm with incremental backpropagation was used to achieve the hybridized genetic algorithm. The incremental backpropagation is a form of the gradient descent algorithm. The experimental data obtained from the central composite design of RSM were divided into two sets, namely, the training set and testing set. The training set contained 15 experimental data, while the testing set contained five experimental data.
The general ANN architecture consists of three layers which are the input, hidden and output layers. The number of neurons in both the input and output layers is usually determined by the process variables and the investigated responses, respectively. The number of neurons in the hidden layer was determined by trial and error process. This was done to minimize the deviation of predictions from experimental data. The ANN architecture for the study is pre-sented in Figure 7. From this Figure, it can be observed that a single hidden layer with 15 neurons was used, while the number of neurons in the input and output layers correspond with the three process variables (Aspect ratio, Water–cement ratio and Cement content) and the five properties investigated (water absorption, compressive strength, flexural strength, split tensile strength and slump) respectively. Further increase in the neurons of the hidden layer presents the possibility of overfitting the ANN. The transfer function of the network for both the hidden and output layers was sigmoidal. The weight is an adjustable quantity that is associated with the connection of neurons. Scaled input data were introduced into the hidden layer by the neurons in the input layer through weights. These weights are the thin lines shown in Figure7
connecting successive layers.
RSM
Indentifying independent variable and range
Output data processing Experimental design
Analysis of the obtained result Optimization of the mathematical model
2.5. Comparison tools
For this study, the performance of both techniques was evaluated using the following error functions; RMSE, MAE, MPE and AAD. The equations representing each error function are presented by 1 to 4 (Pilkington et al.,2014; Prakash Maran et al.,2013).
RMSE¼∑ n i¼1 RieRip 2 n (1) MAE¼1n∑n i¼1 RieRip (2) MPEð Þ ¼% 100n ∑n i¼1 RieRip Rip (3) AAD¼ 1n∑n i¼1 RipRie Rie ! 100 (4)
Begin by generating a random population of chromosomes
Evaluating the fitness of each chromosome in the population
Creation of a new population
Selection of two-parent chromosome from the population according to fitness
Crossover with probability to form new offspring
Mutation of new offspring
Placing of new offspring in a new population
Utilization of newly generated population further running of algorithm
Testing to ensure end condition is satisfied Figure 6. Operation of genetic
algorithm.
where n represents the number of experimental runs, Rieis the ith value of experimental run and Ripis the ith value predicted.
3. Results and discussion
3.1. Performance of RSM and ANN models
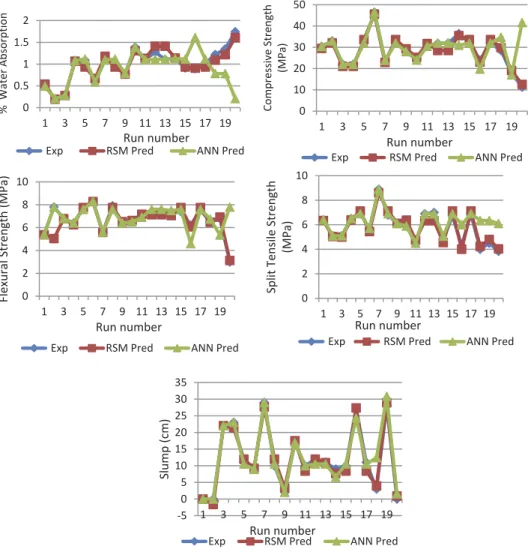
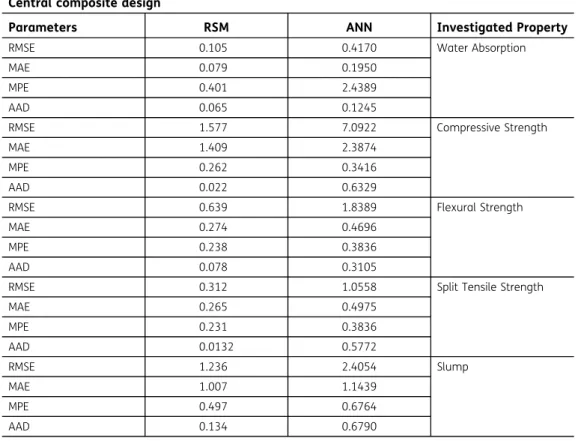
The predicting ability of RSM and ANN-GA were assessed in the study. The aforementioned techniques predicted all properties investigated at 20 experimental points. Details of these are presented in Figure8(a–e). These figures represent the experimental versus predicted RSM and ANN values for Water absorption (R1), Compressive strength (R2), Flexural strength (R3), Split tensile strength (R4) and Slump (R5) respectively. These figures showed that the predicted RSM values were closer to the experimental data than the predicted ANN-GA values. The RMSE, MAE, MPE and AAD presented in Table 3and Figure 9(a–d)were used to compare the experimental values with RSM and ANN-GA. Although both techniques were observed to predict the responses to a certain level of accuracy as presented in Figure9(a–d), however, for all responses (R1-R5) the RSM was able to provide a better prediction than ANN-GA.
Table3 presents the RMSE, MAE, MPE and AAD values obtained for RSM and ANN-GA for all properties investigated. The above mentioned statistical parameters were used to evaluate the predicting ability of both modelling techniques in comparison with the experimental data. From
0.5 1 1.5 0 2 1 3 5 7 9 11 13 15 17 19 Exp RSM Pred ANN Pred
% Water Absorption Run number 0 10 20 30 40 50 1 3 5 7 9 11 13 15 17 19 Exp RSM Pred ANN Pred
Run number Compressive Strength (MPa) 0 2 4 6 8 10 1 3 5 7 9 11 13 15 17 19
Exp RSM Pred ANN Pred
) a P M( ht g n er t S l ar u x el F Run number 0 2 4 6 8 10 1 3 5 7 9 11 13 15 17 19 Exp RSM Pred ANN Pred
Split Tensile Strength
(MPa) Run number -5 0 5 10 15 20 25 30 35 1 3 5 7 9 11 13 15 17 19 Exp RSM Pred ANN Pred
Slump (cm)
Run number
Figure 8. (a): RSM and ANN-GA comparison for R1. (b): RSM and ANN-GA comparison for R2. (c): RSM and ANN-GA comparison for R3. (d) RSM and ANN-GA comparison for R4. (e): RSM and ANN-GA comparison for R5.
Table 3. Evaluation of the ANN-GA and RSM model Central composite design
Parameters RSM ANN Investigated Property
RMSE 0.105 0.4170 Water Absorption
MAE 0.079 0.1950
MPE 0.401 2.4389
AAD 0.065 0.1245
RMSE 1.577 7.0922 Compressive Strength
MAE 1.409 2.3874
MPE 0.262 0.3416
AAD 0.022 0.6329
RMSE 0.639 1.8389 Flexural Strength
MAE 0.274 0.4696
MPE 0.238 0.3836
AAD 0.078 0.3105
RMSE 0.312 1.0558 Split Tensile Strength
MAE 0.265 0.4975 MPE 0.231 0.3836 AAD 0.0132 0.5772 RMSE 1.236 2.4054 Slump MAE 1.007 1.1439 MPE 0.497 0.6764 AAD 0.134 0.6790 0 2 4 6 8 (a) (b) (c) (d) R1 R2 R3 R4 R5 RMSE for RSM RMSE for ANN
RSME 0 0.5 1 1.5 2 2.5 3 R1 R2 R3 R4 R5 MAE for RSM MAE for ANN
MAE 0 0.5 1 1.5 2 2.5 3 R1 R2 R3 R4 R5 MPE for RSM MPE for ANN
MPE 0 0.1 0.2 0.3 0.4 0.5 0.6 0.7 0.8 R1 R2 R3 R4 R5 AAD for RSM AAD for ANN
AAD
Figure 9. (a): Chart of the root-mean-square error for all response. (b): Chart of the mean absolute error for all response. (c): Chart of the model predic-tion error for all response. (d): Chart of the absolute average deviation for all response.
the table, it was generally observed that the RMSE, MAE, MPE and AAD values obtained for the RSM model were lower than those obtained for the ANN-GA. It is a common knowledge that the lower the values of these error functions, the better is the predicting ability of the model. This informed the choice of RSM over ANN-GA.
3.2. Derived model using RSM
From the Analysis of Variance (ANOVA), it was observed that the quadratic model containing a few cubic terms predicted the investigated properties of steel fibre reinforced concrete. The second-order model for water absorption, compressive strength, flexural strength, split tensile strength and slump are given by Equations (5)–(9) with a coefficient of determination of 0.86, 0.95, 0.98, 0.93 and 0.98, respectively. Equations (5)–(9) give the regression coefficients for the main, inter-action, quadratic and cubic terms (Awolusi et al.,2019a).
Water Absorption R1ð Þ ¼ þ0:16þ0:062A0:14B0:14Cþ0:098ABþ0:1ACþ0:17BC
0:036A2þ0:047B20:082C2þ0:14ABCþ0:25A2Bþ0:25A2C (5)
Compressive strength R2ð Þ ¼ þ32:991:15A4:46Bþ6:24C1:24AC5:04BCþ0:19B2
5:11C2þ0:67B2Cþ1:93BC2
(6)
Flexural strength R3ð Þ ¼ þ6:82þ0:24Aþ1:23Bþ1:17C0:19AB0:38AC0:80BC1:01B2
0:37C20:69B2C 1:04BC2
(7)
Split tensile R4ð Þ ¼4:65þ0:095Aþ1:22Bþ1:07Cþ0:21ABþ0:016ACþ0:16BC0:25A2
þ0:56B20:42C2þ0:14ABC1:54A2Bþ0:71A2C (8)
Slump R5ð Þ ¼ þ10:950:54Aþ8:62Bþ7:73C1:62ABþ5:88ACþ2:63BC4:04A2þ2:27B2
þ1:74C24:88ABC 6:25A2B6:85A2C
(9) 3.3. Derived model using ANN-GA
The generalization capability of ANN—GA was assessed by carrying out a linear regression on the test data set. The experimental and predicted values are presented in Figure10. The model coefficient of determination (R2) and the absolute fraction of variance (AFV) obtained from the plot were 0.94 and 0.929, respectively. The value of R2 and AFV obtained signifies a close relationship between the experimental values and the predicted values. Atoyebi, Awolusi et al. (2018) have identified that the closer this value is to one (1) the better is the predicting ability of the obtained model.
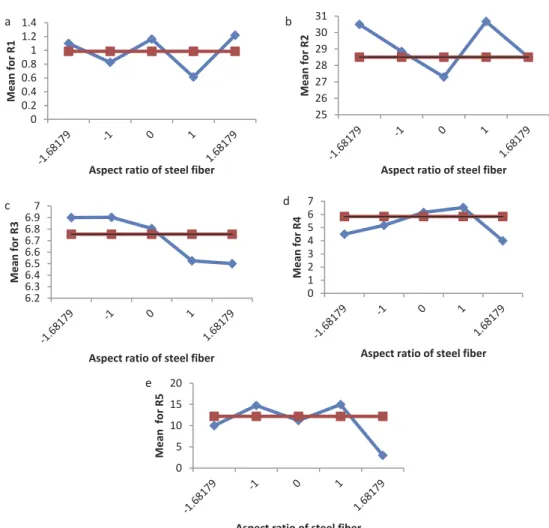
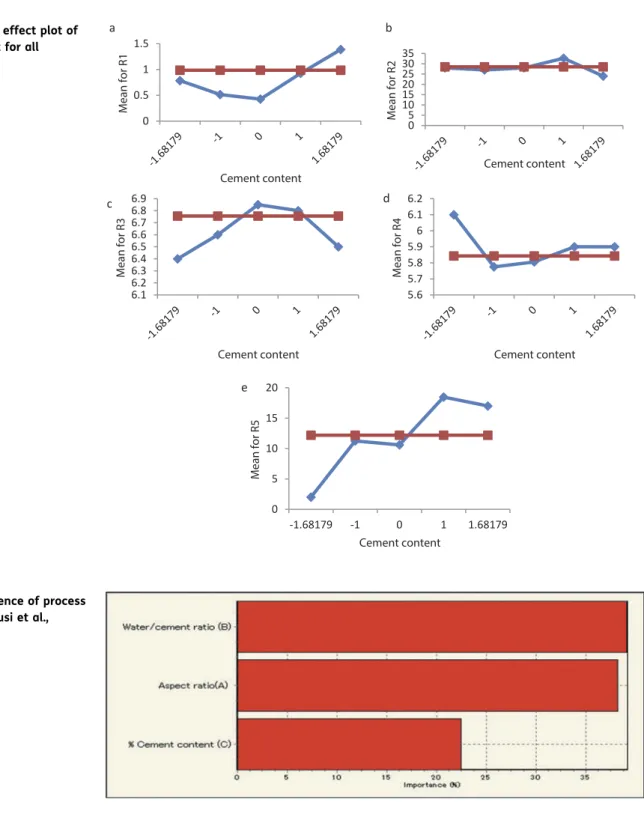
3.4. Mean effect plot
Figures11–13present the main effect plot for the three process variables. These plots were used to understand the effect of linear terms on the interested response (Rostamiyan, Fereidoon,
-5 0 5 10 15 20 25 30 0 10 20 30 40 Predicted Da ta Experimental Data Predicted Data Experimental Data Y= 0.78883X + 0.884, R2= 0.94 , AFV = 0.929 Figure 10. Comparison of experimental values (red) with predicted values (blue). The straight line represents the lin-ear regression (Awolusi et al.,
Mashhadzadeh, Ashtiyani, & Salmankhani,2015). The main effect plot for variable A which repre-sents the aspect ratio of steel fibre is displayed in Figure11(a–e). From Figure11(a,b,e)there was no obvious trend for water absorption, compressive strength and slump with respect to changes in aspect ratio. However, the least water absorption, highest compressive and reduced slump were observed with an aspect ratio of 140. The split tensile strengths were observed to increase with the increase in aspect ratio up to 140 which implies that a high aspect ratio is required for improved split tensile strength. The highest flexural strength (Figure11(c)) was observed to be constant for aspect ratios between 19 and 50, while a further increase in aspect ratio led to a decrease in flexural strength.
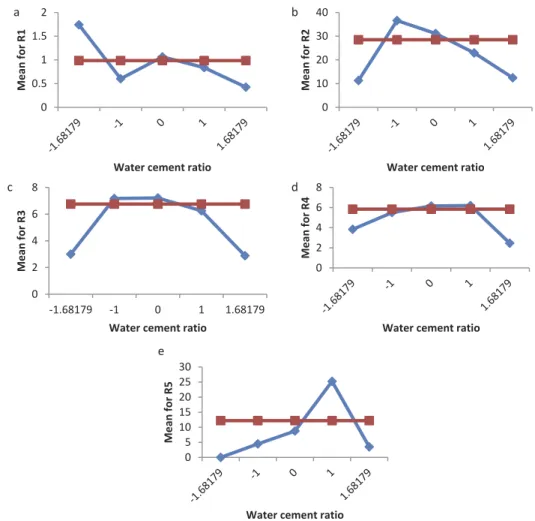
Figure12(a–e) presents the main effect plot for water–cement ratio (variable B). From Figure12 (a–c) it was observed that low water absorption, high compressive and flexural strengths could be achieved with water–cement ratio of 0.25. The split tensile strength (Figure12(d)) was observed to increase up to a water–cement ratio of 0.4 whereby a further increase in water–cement ratio decreases the split tensile strength. From Figure12(e), it could be observed that reasonable slump for good workability can be achieved with a water–cement ratio range of 0.25 and 0.33. Figure13 (a–e) present the main effect plot for variable C (cement content). From Figure 13(a) it was observed that with a cement content of 32.5%, the lowest water absorption was achieved. From Figure 13(b,c), the highest compressive and flexural strengths were achieved with a cement content of 40%. For split tensile strength, no clear trend was observed; however, lower cement content seemed to have enhanced split tensile strength (Figure13(d)). Figure13(e) presents the
0 0.2 0.4 0.6 0.8 1 1.2 1.4 Mean for R1
Aspect ratio of steel fiber
a 25 26 27 28 29 30 31 Mean for R2
Aspect ratio of steel fiber
b 6.2 6.3 6.4 6.5 6.6 6.7 6.8 6.9 7 Mean for R3
Aspect ratio of steel fiber
c 0 1 2 3 4 5 6 7 Mean for R4
Aspect ratio of steel fiber
d 0 5 10 15 20 Mean for R5
Aspect ratio of steel fiber
e
Figure 11. Main effect plot of aspect ratio for all responses.
effect of variable C (cement) on the slump. The slump was observed to have increased with increasing cement content which is in agreement with the findings of (Marar & Eren, 2011). According to the gradient of the main effect plots, it was generally observed that the process variable B (water–cement ratio) had more influence on the responses when compared to the other two variables (Aspect ratio and cement content). This assertion is supported by the analysis of the relative importance of process variables obtained for the hybridized genetic algorithm of ANN presented in Figure14. From Figure14it could be observed that the water–cement ratio has the most significant influence on the responses followed by the aspect ratio and lastly the cement content. This observation corroborates the recommendations of (Mindess, Young, & Darwin,2003). They identified water–cement ratio as playing a primary role in strength increase while the presence of fibres provides a modest increase in strength. Rostamiyan et al. (Rostamiyan et al., 2015) similarly observed that the presence of fibres improves mechanical properties and reduces the crack propagation of composite materials. However, Simões et al. (Simões, Costa, Dias-da-Costa, & Júlio,2017) identified that the presence of fibres in the concrete matrix reduces homo-geneity and increases the porosity of the concrete. This could be a disadvantage to the use of steel fibre since reports by Claisse, Elsayad, & Shaaban (1997); they have identified that the more open the pore sizes of concrete, the more vulnerable the materials are to degradation caused by penetrating substances. These substances which are mostly liquid move from the surrounding environment into the concrete matrix and may cause irreparable damage to the material. The rate of water absorption is closely related to the sizes of the pores in the concrete. Therefore, the study has provided regression models that could help in proportioning the constituents of steel fibre
0 0.5 1 1.5 2 Mean for R1
Water cement ratio
a 0 10 20 30 40 Mean for R2
Water cement ratio
b 0 2 4 6 8 -1.68179 -1 0 1 1.68179 Mean for R3
Water cement ratio
c 0 2 4 6 8 Mean for R4
Water cement ratio
d 0 5 10 15 20 25 30 Mean for R5
Water cement ratio
e
Figure 12. Main effect plot of water–cement ratio for all responses.
reinforced concrete with minimum water absorption, reasonable slump and improved mechanical properties.
3.5. Optimization by RSM
The optimization of all responses was done using the optimization tool of RSM. The following settings are available for the optimization process; maximize, minimize, in range and target. For the purpose of this study the compressive, flexural split tensile strengths were set at maximum while the water absorption and slump were set at minimum and in range, respectively. Under this
0 0.5 1 1.5 Mean for R1 Cement content a 0 5 10 15 20 25 30 35 Mean for R2 Cement content b 6.1 6.2 6.3 6.4 6.5 6.6 6.7 6.8 6.9 Mean for R3 Cement content c 5.6 5.7 5.8 5.9 6 6.1 6.2 Mean for R4 Cement content d 0 5 10 15 20 -1.68179 -1 0 1 1.68179 Mean for R5 Cement content e
Figure 13. Main effect plot of cement content for all responses.
Figure 14. Influence of process variables (Awolusi et al.,
condition, the water absorption, slump compressive, flexural and split tensile strengths were 0.94%, 7.65 cm, 42.69 N/mm2, 7.97 N/mm2and 5.23 N/mm2 respectively. The process variables used to achieve this purpose were 140 for aspect ratio (A), 0.26 for water–cement ratio (B) and 40% for cement content (C). The validations of these experimental results are available in an earlier study (Awolusi et al.,2019b).
4. Conclusion
The study examined the effects of process variables such as aspect ratio, water–cement ratio and cement content on the properties of steel fibre reinforced concrete. For a better understanding of these process variables, two modelling approaches were used, namely, RSM and ANN. Both modelling tech-niques have identified water–cement ratio as the most significant process variable influencing the investigated properties of steel fibre reinforced concrete. This study found out that although there have been far-reaching recommendations in favour of ANN for modelling complex nonlinear relation-ships of process variables, the RSM model performed better in predicting the investigated properties of steel fibre reinforced concrete measured by the RMSE, MAE, MPE and AAD. This may be attributed to the fact that the nature of RSM is structured towards exhibiting the contributions of all coefficients in the regression models which makes it efficient in recognizing the insignificant process variables and their interactions. Also, RSM also identifies insignificant quadratic terms thereby reducing the complexity of the problem and providing better prediction in this study. The inability of ANN-GA to outperform RSM may be attributed to the fact that five properties of steel fibre reinforced concrete were being predicted simultaneously. ANN-GA training and testing require huge search space to provide optimal solutions for concrete with low water absorption, high compressive, flexural splitting tensile strengths and reasonable slump. From the findings of this study, it could be inferred that RSM performs better in prediction when limited data are used for predicting several properties. In summary, the current study has identified RSM as a preferred option for modelling when several properties of a single product (in this case steel fibre reinforced concrete) are simultaneously investigated with limited experimental data. The study has provided regression models that could help in proportioning the constituents of concrete reinforced with steel fibre extracted from discarded tyres. The aim was to achieve SFRC with minimum water absorption, reasonable slump and improved mechanical properties. This serves as an alternative to industrial fibre which is relatively expensive and as well provides an avenue where a huge amount of waste tyres dumped in environments will be used in concrete for friendly disposal of waste tyres.
Acknowledgements
Financial support from the Tertiary Education Trust Fund (TETFUND) for carrying out experimental works is highly appreciated. The authors would like to also acknowledge Advanced Chemical Technology Ikeja Lagos, manufacturer of the high range water reducing admixture used in the study. We also express sincere gratitude to Engr. Taiwo Abiola of the Department of Chemical Engineering, Cape Peninsula University of Technology, South Africa for his support.
Funding
The authors received no direct funding for this research. Author details Temitope F. Awolusi1 E-mail:[email protected] Oluwaseyi L. Oke1 E-mail:[email protected] Olufunke O. Akinkurolere1 E-mail:[email protected] Olumoyewa D. Atoyebi2 E-mail:[email protected] ORCID ID:http://orcid.org/0000-0001-9669-3179
1Department of Civil Engineering, Ekiti State University,
Ado-Ekiti, Nigeria.
2Department of Civil Engineering, Landmark University,
Omu-Aran, Nigeria.
Citation information
Cite this article as: Comparison of response surface methodology and hybrid-training approach of artificial neural network in modelling the properties of concrete containing steel fibre extracted from waste tyres, Temitope F. Awolusi, Oluwaseyi L. Oke, Olufunke O. Akinkurolere & Olumoyewa D. Atoyebi, Cogent Engineering (2019), 6: 1649852.
References
ACI Committee 544. (1996). State-of-the-art report on fiber reinforced concrete.ACI Committee 544 report
544.1R-96. Detroit: American Concrete Institute.
Alyamac, K. E., Ghafari, E., & Ince, R. (2017). Development of eco-efficient self-compacting concrete with waste marble powder using the response surface method. Journal of Cleaner Production,144, 192–202. doi:10.1016/j.jclepro.2016.12.156
Atoyebi, O. D., Awolusi, T. F., & Davies, I. E. E. (2018). Artificial neural network evaluation of
cement-bonded particle board produced from red iron wood (Lophira alata) sawdust and palm ker-nel shell residues.Case Studies in Construction
Materials, e00185. doi:10.1016/j.cscm.2018.
e00185
Atoyebi, O. D., Odeyemi, S. O., Bello, S. A., & Ogbeifun, C. O. (2018). Splitting tensile strength assessment of
lightweight foamed concrete reinforced with waste tyre steel fibres.International Journal of Civil Engineering and Technology,9(9), 1129–1137. Awolusi, T. F., Oke, O. L., Akinkurolere, O. O., Sojobi, A. O.,
& Aluko, O. G. (2019a). Performance comparison of neural network training algorithms in the modeling properties of steel fiber reinforced concrete.Heliyon, 5(1), e01115. doi:10.1016/j.heliyon.2018.e01115 Awolusi, T. F., Oke, O. L., Akinkurolere, O. O., & Sojobi, A. O.
(2019b). Application of response surface methodol-ogy: Predicting and optimizing the properties of concrete containing steel fibre extracted from waste tires with limestone powder as filler.Case Studies in Construction Materials,10, e00212. doi:10.1016/j. cscm.2018.e00212
Bourquin, J., Schmidli, H., van Hoogevest, P., & Leuenberger, H. (1998). Advantages of Artificial Neural Networks (ANNs) as alternative modelling technique for data sets showing non-linear rela-tionships using data from a galenical study on a solid dosage form.European Journal of Pharmaceutical Sciences,7(1), 5–16. doi:10.1016/ S0928-0987(97)10028-8
Chen, B., & Liu, J. (2005). Contribution of hybrid fibers on the properties of the high-strength lightweight con-crete having good workability.Cement and Concrete Research,35(5), 913–917. doi:10.1016/j.
cemconres.2004.07.035
Chopra, P., Kumar, R., & Kumar, M. (2015, March). Artificial neural networks for the prediction of compressive strength of concrete.International Journal of Applied Sciences & Engineering,13, 187–204.
Claisse, P. A., Elsayad, H. I., & Shaaban, I. G. (1997). Absorption and sorptivity of cover concrete.Journal of Materials in Civil Engineering,9(3), 105–110. doi:10.1061/(ASCE)0899-1561(1997)9:3(105) Desai, K. M., Survase, S. A., Saudagar, P. S., Lele, S. S., &
Singhal, R. S. (2008). Comparison of artificial neural network (ANN) and response surface methodology (RSM) in fermentation media optimization: Case study of fermentative production of scleroglucan. Biochemical Engineering Journal,41(3), 266–273. doi:10.1016/j.bej.2008.05.009
Di Mundo, R., Petrella, A., & Notarnicola, M. (2018). Surface and bulk hydrophobic cement composites by tyre rubber addition.Construction and Building Materials,172, 176–184. doi:10.1016/j. conbuildmat.2018.03.233
Ebrahimpour, A., Rahman, R. N. Z. R. A., Ean Ch’ng, D. H., Basri, M., & Salleh, A. B. (2008). A modeling study by response surface methodology and artificial neural network on culture parameters optimization for thermostable lipase production from a newly iso-lated thermophilic Geobacillus sp. strain ARM.BMC
Biotechnology,8(1), 96. doi:10.1186/1472-6750-8-96
Esfahanian, M., Nikzad, M., Najafpour, G., &
Ghoreyshi, A. A. (2013). Modeling and optimization of ethanol fermentation using Saccharomyces cerevi-siae: Response surface methodology and artificial neural network.Chemical Industry and Chemical Engineering Quarterly,19, 1–11. doi:10.2298/ CICEQ120210058E
Fang, J., Wang, S., & Zhang, C. (2005). Application of Genetic Algorithm (GA) trained artificial neural net-work to identify tomatoes with physiological diseases.Nature and Science,3(2), 52–58. Ghaffari, A., Abdollahi, H., Khoshayand, M. R.,
Bozchalooi, I. S., Dadgar, A., & Rafiee-Tehrani, M. (2006). Performance comparison of neural network training algorithms in modeling of bimodal drug
delivery.International Journal of Pharmaceutics,327 (1), 126–138. doi:10.1016/j.ijpharm.2006.07.056 Hacene, B. S. M. A., Ghomari, F., Schoefs, F., & Khelidj, A.
(2014, April). Probabilistic modelling of compressive strength of concrete using response surface metho-dology and neural networks.Arabian Journal for
Science and Engineering, doi:
10.1007/s13369-014-1139-y
Lakshminarayanan, A. K., & Balasubramanian, V. (2009). Comparison of RSM with ANN in predicting tensile strength of friction stir welded AA7039 aluminium alloy joints.Transactions of Nonferrous Metals Society of China,19(1), 9–18. doi:10.1016/S1003-6326(08) 60221-6
Marar, K., & Eren, Ö. (2011). Effect of cement content and water/cement ratio on fresh concrete properties without admixtures.International Journal of the Physical Sciences,6(24), 5752–5765. doi:10.5897/ IJPS11.188
Mastali, M., & Dalvand, A. (2016). Use of silica fume and recycled steel fibers in self-compacting concrete (SCC).Construction and Building Materials,125, 196–209. doi:10.1016/j.conbuildmat.2016.08.046 Mindess, S., Young, F. J., & Darwin, D. (2003).Concrete
(2nd ed.). Upper Saddle River, NJ, USA: Prentice Hall, Pearson Education, Inc.
Moghaddam, M. G., & Khajeh, M. (2015). Comparison of response surface methodology and artificial neural network in predicting the microwave-assisted extraction procedure to determine zinc in fish muscles.Food and Nutrition Sciences. (January 2011). doi:10.4236/fns.2011.28110.
Mohammed, B. S., Khed, V. C., & Nuruddin, M. F. (2018). Rubbercrete mixture optimization using response surface methodology.Journal of Cleaner Production,171, 1605–1621. doi:10.1016/j. jclepro.2017.10.102
Mpanyana, L. M. (2009).Waste tyre management pro-blems in South Africa and the possible opportunities
that can be created through the recycling thereof.
Pretoria: University of South Africa.
Mucsi, G., Szenczi, Á., & Nagy, S. (2018). Fiber reinforced geopolymer from synergetic utilization of fly ash and waste tire.Journal of Cleaner Production,178, 429–440. doi:10.1016/j.jclepro.2018.01.018 Nasir, B. (2009).Steel fiber reinforced concrete made with
fibers extracted from used tyres. Ethiopia: Addis Ababa University.
Nauck, D., & Kruse, R. (1997). A neuro-fuzzy method to learn fuzzy classification rules from data.Fuzzy Sets and Systems,89(3), 277–288. doi: 10.1016/S0165-0114(97)00009-2
Nauck, D., & Kruse, R. (1999). Neuro-fuzzy systems for function approximation.Fuzzy Sets and Systems,101 (2), 261–271. doi:10.1016/S0165-0114(98)00169-9 Neocleous, K., Tlemat, H., & Pilakoutas, K. (2006, October).
Design issues for concrete reinforced with steel fibers, including fibers recovered from used tires. Journal of Materials in Civil Engineering,18(5), 677–685. doi:10.1061/(ASCE)0899-1561(2006) 18:5(677)
Oliveira, J. R. M., Silva, H. M. R. D., Abreu, L. P. F., & Fernandes, S. R. M. (2013). Use of a warm mix asphalt additive to reduce the production temperatures and to improve the performance of asphalt rubber mixtures.Journal of Cleaner Production,41, 15–22. doi:10.1016/j.jclepro.2012.09.047
Pacheco-Torgal, F., Ding, Y., & Jalali, S. (2012). Properties and durability of concrete containing polymeric wastes (tyre rubber and polyethylene terephthalate bottles): An overview.Construction and Building
Materials,30, 714–724. doi:10.1016/j. conbuildmat.2011.11.047
Pilakoutas, K., Neocleous, K., Dipl-ing, H. T., & Inge, B. (2006). Reuse of tyre steel fibres as concrete reinforcement.Proceedings of the ICE-Engineering Sustainability, 157(3), 131–138. (September 2004). Pilkington, J. L., Preston, C., & Gomes, R. L. (2014).
Comparison of response surface methodology (RSM) and artificial neural networks (ANN) towards efficient extraction of artemisinin from Artemisia annua. Industrial Crops and Products,58, 15–24. doi:10.1016/ j.indcrop.2014.03.016
Prakash Maran, J., Sivakumar, V.,
Thirugnanasambandham, K., & Sridhar, R. (2013). Artificial neural network and response surface methodology modeling in mass transfer parameters predictions during osmotic dehydration of Carica papaya L.Alexandria Engineering Journal,52(3), 507–516. doi:10.1016/j.aej.2013.06.007 Qi, C. (2003).Quality assessment of plastic shrinkage
cracking and its impact on the corrosion of steel
reinforcement. Indiana: Purdue University.
Ravikumar, R., Renuka, K., Sindhu, V., & Malarmathi, K. B. (2013). Response surface methodology and artificial neural network for modeling and optimization of distillery spent wash treatment using Phormidium valderianum BDU 140441.Polish Journal of Environmental Studies,22(4), 1143–1152. Rostamiyan, Y., Fereidoon, A., Mashhadzadeh, A. H.,
Ashtiyani, M. R., & Salmankhani, A. (2015). Using response surface methodology for modeling and optimizing tensile and impact strength properties of fiber orientated quaternary hybrid nano composite. Composites Part B: Engineering,69, 304–316. doi:10.1016/j.compositesb.2014.09.031 Sebola, M. R., Mativenga, P. T., & Pretorius, J. (2018).
A benchmark study of waste tyre recycling in South Africa to European union practice.Procedia CIRP,69, 950–955. doi:10.1016/j.procir.2017.11.137
Shen, W., Shan, L., Zhang, T., Ma, H., Cai, Z., & Shi, H. (2013). Investigation on polymer–Rubber aggregate modified porous concrete.Construction and Building
Materials,38, 667–674. doi:10.1016/j. conbuildmat.2012.09.006
Simões, T., Costa, H., Dias-da-Costa, D., & Júlio, E. (2017). Influence of fibres on the mechanical behaviour of fibre reinforced concrete matrixes.Construction and Building Materials,137, 548–556. doi:10.1016/j. conbuildmat.2017.01.104
Şimşek, B., Uygunoğlu, T., Korucu, H., &
Kocakerim, M. M. (2018). Analysis of the effects of dioctyl terephthalate obtained from polyethylene terephthalate wastes on concrete mortar: A response surface methodology based desirability function approach application.Journal of Cleaner Production,170, 437–445. doi:10.1016/j. jclepro.2017.09.176
Su, H., Yang, J., Ling, T., Ghataora, G. S., & Dirar, S. (2014). Properties of concrete prepared with waste tyre rub-ber particles of uniform and varying sizes.Journal of Cleaner Production, 1–9. doi:10.1016/j.
jclepro.2014.12.022
Syaidathul, A., Izni, R., & Ibrahim, S. (2012).Mechanical properties of recycled steel tire fibres in concrete. Universiti Teknologi Malaysia.
Thomas, B. S., & Gupta, R. C. (2016). A comprehensive review on the applications of waste tire rubber in cement concrete.Renewable and Sustainable Energy Reviews,54, 1323–1333. doi:10.1016/j.
rser.2015.10.092
Thomas, B. S., Gupta, R. C., & Panicker, V. J. (2016). Recycling of waste tire rubber as aggregate in con-crete: Durability-related performance.Journal of Cleaner Production,112, 504–513. doi:10.1016/j. jclepro.2015.08.046
Tyagi, M., Rana, A., Kumari, S., & Jagadevan, S. (2018). Adsorptive removal of cyanide from coke oven was-tewater onto zero-valent iron: Optimization through response surface methodology, isotherm and kinetic studies.Journal of Cleaner Production,178, 398–407. doi:10.1016/j.jclepro.2018.01.016
Yager, R. R., & Filev, D. P. (2017). Adaptive defuzzification for fuzzy systems modeling. (2), 135–142.
© 2019 The Author(s). This open access article is distributed under a Creative Commons Attribution (CC-BY) 4.0 license..
You are free to:
Share—copy and redistribute the material in any medium or format.
Adapt—remix, transform, and build upon the material for any purpose, even commercially. The licensor cannot revoke these freedoms as long as you follow the license terms. Under the following terms:
Attribution—You must give appropriate credit, provide a link to the license, and indicate if changes were made. You may do so in any reasonable manner, but not in any way that suggests the licensor endorses you or your use. No additional restrictions
You may not apply legal terms or technological measures that legally restrict others from doing anything the license permits.
Cogent Engineering(ISSN: 2331-1916) is published by Cogent OA, part of Taylor & Francis Group. Publishing with Cogent OA ensures:
• Immediate, universal access to your article on publication
• High visibility and discoverability via the Cogent OA website as well as Taylor & Francis Online • Download and citation statistics for your article
• Rapid online publication
• Input from, and dialog with, expert editors and editorial boards • Retention of full copyright of your article
• Guaranteed legacy preservation of your article
• Discounts and waivers for authors in developing regions