The Effects of Green Tea Extract on Soy Bread Physical
Properties and Total Phenolic Content
Chanun Somboonvechakarn
Advised by: Dr. Yael Vodovotz
The Ohio State University
Table of Content
Abstract………... 2
Introduction………..3
Objectives………... 5
Materials and methods.………... 5
-Extraction of green tea………... 5
-Soy bread making process………. 6
-Green tea soy bread making process………. 7
-pH test……… 7
-Color analysis……… 8
-Texture analysis………. 8
-Water Activity………... 8
-Total Phenolic Determination……… 9
-Statistical analysis……….. 9
Results and discussion……….. 10
Future Studies……….………...15
Conclusion……… 16
Acknowledgement……… 16
Abstract
Soy and green tea contain antioxidants that may be used as health promoting ingredients. Various foods currently available on the market incorporate these ingredients individually but few contain a combination of soy and green tea in one product.
Since highly acceptable soy bread has been developed, the objective was to optimize the level of green tea addition to the soy bread. The physico-chemical properties of the bread and total phenolics were used as indicators of optimal quality.
A 900 gram loaf of plain soy bread was used as control. 0, 50, 100 and 150 mg of green tea extract per 100 g of soy flour were added. pH, water activity (aw), color (Lab values) and hardness (Instron) were measured in all samples. The total phenolics in soy bread extracts were determined spectrometrically according to the Folin- Ciocalteu colorimetric procedure and expressed as mg of gallic acid equivalents (GAE) per gram dry weight.
aw, pH and average bread hardness of the crumbs did not show significant differences across the control and the green tea extract fortified soy bread; with the average aw of 0.94, pH of 5.6 and average bread hardness of 3.8 kgf. A decrease in b (decrease in yellowness) and L (increase in darkness) values of the crumbs was observed upon increased addition of the green tea extract. Total phenolics in all samples ranged from 27.45 ± 1.82 mg GAE/g dry weight to 30.38 ± 0.84 mg GAE/g, demonstrating high total phenolic content but no significant changes between treatments.
Results showed that the green tea fortified soy bread was similar to the regular soy bread in terms of the texture, pH and moisture. The amount of green tea per 100 g of
flour was too small for a significant increment in total phenolics. However, green tea extract darkened the bread crumbs and reduced visual appeal. Color intensity is an important factor relative to total phenolics in future development of the product. Apart from the color intensity, the addition of the extract did not aversely affect the physico-chemical quality of the soy bread. Sensory acceptability of the product is planned for future studies.
Introduction
In the food market today, both soy and green tea are popular choices for health conscious consumers because of their health benefits and also their reasonable price compared to other dietary supplements such as Ginseng and Ginko leaves. Soy and green tea both contain antioxidants and phenolic compounds related to anti-aging properties, and may be related to cancer prevention.
Isoflavones presented in soy have been widely studied for their antioxidant properties. Health benefits of consumption of soy protein and soy products are discussed with reference to: reduction in risk for cardiovascular disease; menopausal symptoms; and prevention of cancer (Potter, 2000). Green tea, a natural antioxidant is linked to prevention of cancer, cardiovascular disease and anti-obesity effects (Doss, 2005). Catechins, polyphenol compounds in green tea are excellent antioxidants that are enhanced by the presence of metals (Hai and others, 2006). Studies show that 2 grams of green tea have equivalent antioxidant activity to 109-147 mg epigallocatechin gallate (EGCG), 14 muM for catechin and 22 muM for vitamin C (Jung, 2004). Although the popularity of green tea and soy is growing in the United States, there are few, if any that
incorporate these two ingredients. A baked product with these two ingredients may prove a valuable means of enhancing isoflavones and catechins consumption in Western consumers.
There have been many researches experimenting various tea extracts in bread. Various types of tea extracts were added to bread with good success (Rong and Zhou, 2005). The moisture content of bread, an important property that affects bread quality, was unaffected upon addition of tea powders as compared with the control bread (Jung and others, 2005). However, crude protein and ash content of bread with added tea powders were higher than the control group. Compared to the control and other tea powders, the green tea loaf had the highest water holding capacity but loaf volume and specific volume were the lowest (Jung and others, 2005). Sensory analysis indicated that flavor preference was highest for green tea loaf, while preference for color was dominant for the control group (Jung and others, 2005). Stability of the catechins during bread making was studied upon addition of 50, 100 and 150 mg of green tea extract to 100 g of the bread flour (Rong and Zhou, 2004). Results showed that green tea catechins were relatively stable in dough during storage but EGCG was most susceptible to degradation (Jung, 2004). It is calculated that a serving of 53g of the final bread product contains 28mg of tea catechins, which is equivalent to 35% of the amount infused from 2g green tea bags (Rong and Zhou, 2004).
Dr. Vodovotz’s laboratory has developed and commercialized soy. The effect of green tea extract on white bread properties has been studied previously, but no such data is available for addition of green tea to soy bread. This new product might be an alternative to consumers who seek the health benefits of both green tea and soy.
Objectives
1. To create a food product incorporating combination of soy and green tea. 2. To optimize the level of green tea addition to the soy bread relative to
physicochemical properties of the bread and total phenolics.
Materials and methods
The control of this project was the normal soy bread while 50, 100 and 150 mg of green tea extract per 100 g of soy flour were added.
Extraction of green tea
The green tea extract was provided by Herbal One Co. Ltd., Bangkok, Thailand. The Japanese Sencha variety of green tea was used. The following procedure was used by Herbal One Co. Ltd. to obtain the green tea extract. 30 kilograms of washed green tea leaves were mixed with 400 liters of water, then heated to 80 °C for 3 hours. To obtain a liquid concentrate that can be pumped, evaporation at 60 °C was carried out for four hours. The end point of evaporation was achieved when no change to the soluble solids content was observed. The final soluble solids content was 22.5%, compared to the initial value of 4.5%. The evaporated liquid was cooled to room temperature and then pumped to the spray dryer to produce a powdered green tea extract. To atomize the solution, high shear forces were applied by the pressure nozzle, which spinned the liquid at high velocity through a small orifice. This process was accomplished at 300°C for approximately 2 hours to obtain 2 kilograms of green tea powder extract. The extract was stored in the Food Science Department at The Ohio State University.
Soy bread making process
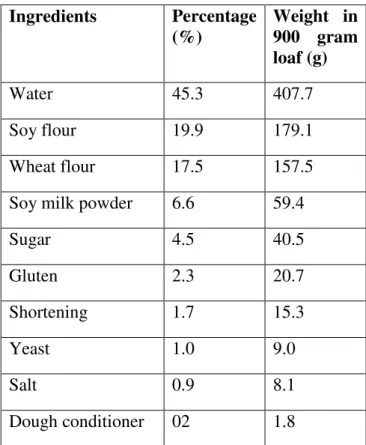
The process of making soy bread and green tea soy bread was carried out in the OSU Department of Food Science and Technology. Table 1 outlines the formulation of the soy bread.
Table 1. Ingredients of soy bread in descending order
Ingredients Percentage (%) Weight in 900 gram loaf (g) Water 45.3 407.7 Soy flour 19.9 179.1 Wheat flour 17.5 157.5
Soy milk powder 6.6 59.4
Sugar 4.5 40.5 Gluten 2.3 20.7 Shortening 1.7 15.3 Yeast 1.0 9.0 Salt 0.9 8.1 Dough conditioner 02 1.8
The soy bread preparation first involved mixing the yeast, 2.0g sugar and 43.6 g of water at 35 °C in a 5-quart KitchenAid Mixer. After 5 minutes, wheat flour, gluten, dough conditioner and 149.2 g of water at 10 °C were added to the mixer at 3000 rpm. The processed was stopped when the dough obtained a satiny look and the temperature reached 30 °C. Soy flour, soy milk powder, 38.5 g of sugar, salt, dough conditioner,
melted shortening and 214.8 g of water at 10 °C were added to the mixer at 3000 rpm. After the dough temperature reached 30 °C, the dough was hand-kneaded for approximately 20 times or until the dough was firm. The dough was then placed in a non-stick baking pan, then proofed at 48 °C for 1 hour. A container of water was placed in the proofing oven to keep a high humidity. The proofed dough was then baked at 160 °C in a jet air oven for 50 minutes to produce bread. Bread was cooled on a cooling rack for 40 minutes before it was cut and packaged in a plastic bag.
Green tea soy bread making process
As green tea was water soluble, the addition of green tea to the product would occur at the mixing process, specifically together with the soy flour, soy milk powder, sugar, salt and shortening. The process of mixing and baking of green tea soy bread followed the process of baking soy bread exactly, except the addition of green tea.
The pH, water activity, color, texture analysis and total phenolic content tests were conducted in the OSU Food Science Department within 2 days after baking the bread.
pH test
5 g of homogenized soy bread and green tea soy bread samples were dissolved in 10 g of water. The pH was measured with a pH meter (Corning Incorporated, Corning, NY). 5 samples from each loaf were analyzed.
Color analysis
For each loaf, from 10 different points, 5 readings were made for both bread crumb and crust with the portable Minolta Chromameter CR 300 (Minolta, Osaka, Japan). The Lab values follow the Hunter Lab color scale.
Texture analysis
Texture analysis was performed using an Instron Universal Testing Machine (5552, Instron Corp., Canton, MA). On the test days, bread samples of 22 mm thickness were obtained from the center of the bread. The compression plunger (35 mm i.d.) was positioned about 1 mm above the surface of the bread samples. Samples were compressed to approximately 10 mm (40% compression) at a speed of 100 mm per minute. The compression curves of the bread crumb were recorded automatically by the BlueHill software (MerlinTM, Version 5, Instron Corp., Canton, MA). The force readings at 40% compression were taken as a measure of bread firmness. The hardness, springiness and gumminess values calculated by the software were recorded. 10 slices were analyzed from each loaf.
Water activity
Water activity of soy bread and green tea soy bread was measured at 25°C using a Decagon Aqualab meter TE8255 (Decagon Devices, Pulman, WA). Both crust and crumb samples were placed into cells and analyzed. 10 samples from each loaf were analyzed.
Total phenolic determination
Extraction procedure- 1000 mg grounded dry homogenized soy bread and green tea soy bread were weighed in a test tube and mixed with 10 ml of 80% methanol. Suspension was vortexed, and centrifuged for 10 minutes. The mixture was sonicated for 5 minutes, then shaked at 120 rpm at 70°C for 2 hours. It was then centrifuged for 10 minutes. Supernatants were collected and filtered.
Folin- Ciocalteu procedure- Total phenolic content was estimated by the Folin- Ciocalteu colorimetric method, based on the procedure of Singleton and Rossi (1965), using gallic acid as a standard phenolic compound. 100 ul of the filtered extracts were mixed with 400 ul of 80% methanol and 2.5 ml of 0.2 N Folin-Ciocalteu phenol reagent. After 5 minutes, 2ml of 7.5% sodium carbonate were added. The absorbance of the resulting blue-colored solution from yellow solution was measured at 765 nm spectrometrically after 30 minutes in the dark at room temperature. Quantitative measurements were performed, based on a standard curve of gallic acid (Tawaha, 2007). The total phenolic content was expressed as gallic acid equivalents (GAE) in mg/g of dry material.
Statistical Analysis
ANOVA of different tests (p≤0.05) of soy bread was analyzed by SPSS version 14.0 (SPSS, Inc., Chicago, IL).
Results and discussions
Figure 1. pH of homogenized soy bread samples (n=5)
Figure 3.1. L values of soy bread crumbs (n=10)
Figure 3.2. a values of soy bread crumbs (n=10)
0 0.5 1 1.5 2 2.5 3 3.5 4 0mg/100g 50mg/100g 100mg/100g 150mg/100g
am ount of gre e n te a e xtract adde d (m g/100g flour)
a
v
a
lu
e
Figure 4.1. Hardness of soy bread crumbs (n=10)
Figure 4.2. Gumminess of soy bread crumbs (n=10)
0 5 10 15 20 25 0m g/100g 50m g/100g 100m g/100g 150m g/100g amount of green tea extract added (mg/100g flour)
G u m m in e s s ( N )
Figure 4.3. Springiness of soy bread crumbs (n=10)
0 2 4 6 8 10 12 0m g/100g 50m g/100g 100m g/100g 150m g/100g
amount of green tea extract added (mg/100g flour)
S p ri n g in e s s ( m m )
Figure 5. Total phenolics of homogenized soy bread (n=3) 0 5 10 15 20 25 30 35 0 mg 50 mg 100 mg 150 mg
Amount of green tea extract added (mg/ 100 g flour) T o ta l p h e n o li c s ( m g G A E / g d w )
Table 2.1 ANOVA of pH, water activity and color analysis of soy bread
Amount of green tea ( mg/ 100 g flour) pH Water Activity of Crumbs L a b 0 5.69 a 0.9467 a 58.85 a 2.79 a 23.74 a 50 5.62 b 0.9434 a 53.15 b 2.34 a 17.07 b 100 5.57 c 0.9439 a 51.68 b 2.89 a 15.92 b 150 5.54d 0.9427 a 51.37 b 3.18 a 15.50 b a-d
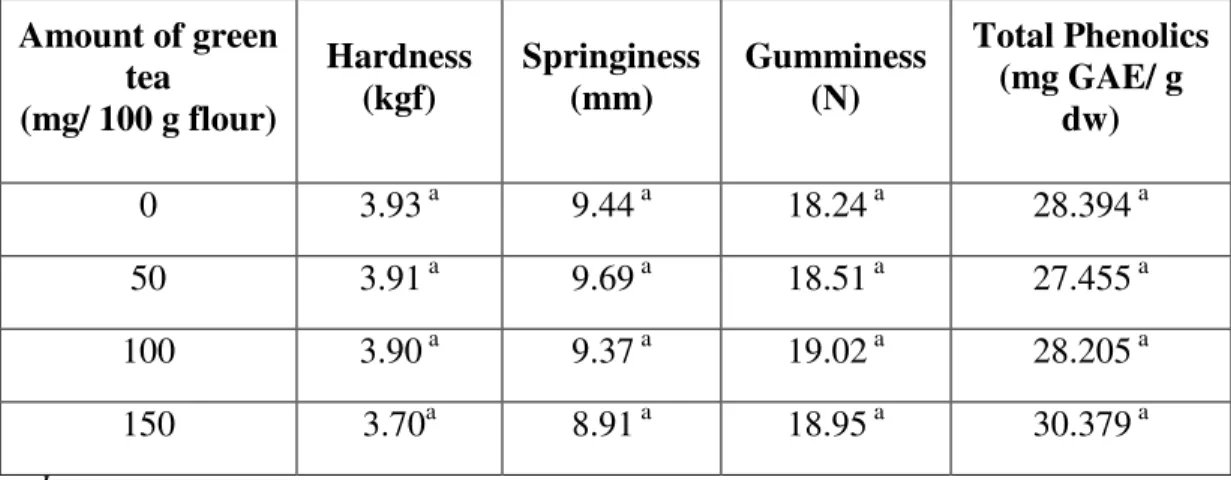
Table 2.2 ANOVA of texture analysis, and total phenolic content of soy bread Amount of green tea (mg/ 100 g flour) Hardness (kgf) Springiness (mm) Gumminess (N) Total Phenolics (mg GAE/ g dw) 0 3.93 a 9.44 a 18.24 a 28.394 a 50 3.91 a 9.69 a 18.51 a 27.455 a 100 3.90 a 9.37 a 19.02 a 28.205 a 150 3.70a 8.91 a 18.95 a 30.379 a a-d
Means in the same column without common superscripts differ (P<0.05)
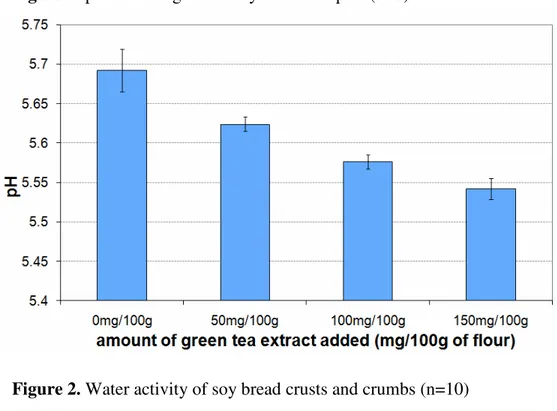
Figure 1 showed that there was a significant difference in pH with increasing amount of green tea extract added. Tea contains many phenolic acids such as gallic acid and isoferulic acid (Hodgson and others, 2004). Therefore, the decrease in pH with increasing amount of green tea extract added occurred in this experiment.
Figure 2 demonstrated that water activity of the soy bread crusts and crumbs was unaffected by the addition of the green tea extract. The moisture content of regular bread was found to be unaffected with different tea extracts (Jung and others, 2005).
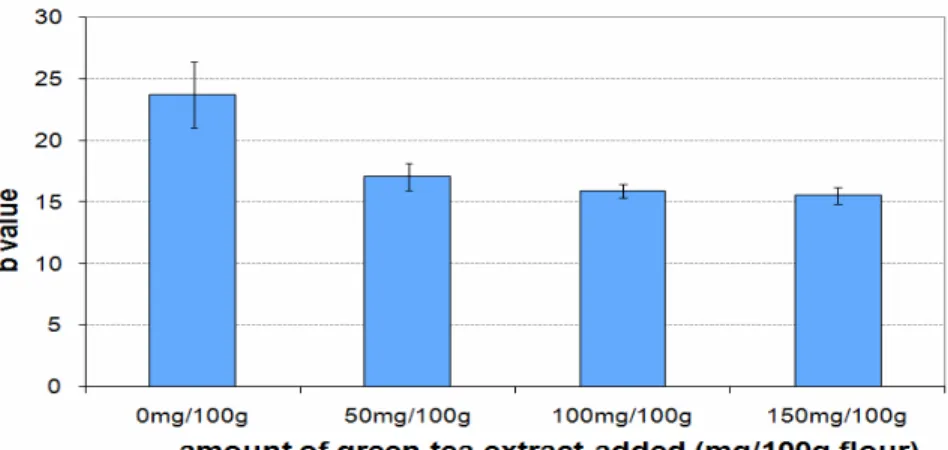
Figure 3.1, 3.2, and 3.3 showed the color results of the bread crumbs. There was no significance difference in a value with increasing amount of green tea extract added (Fig 3.2). Positive a value indicates redness, while negative a value indicates greenness (HunterLab, 1996). L and b values of the crumbs decreased significantly with increasing amount of green tea extract in the bread (Fig 3.1 and 3.3). Lower L value indicated increasing darkness and lower b value suggested decreasing yellowness (HunterLab,
1996). The addition of the green tea extract to the soy bread increased the darkness of the crumbs and the bread faded from bright yellow to medium brown.
Figure 4.1 to 4.3 showed the texture analysis results. There were no significant differences in hardness, springiness and gumminess with the increasing amount of green tea extract added to the soy bread.
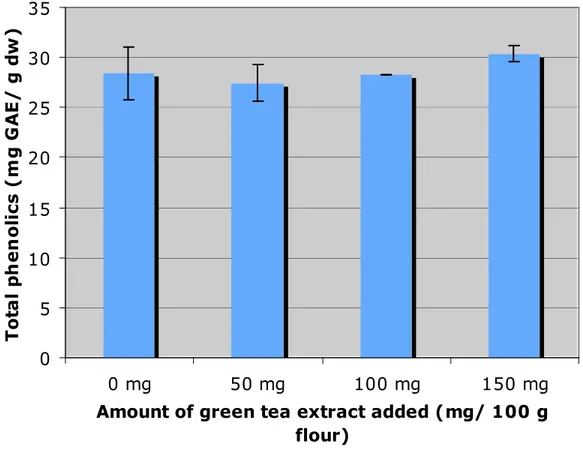
Figure 5 showed the total phenolic content of the soy bread with different treatments. There was no significant difference in total phenolics with green tea extract addition. This result contradicted with the pH values obtained in the experiment. The significant decrease in pH indicated that the amount of phenolic acids increased with the addition of the green tea extract. pH scale is a log scale, therefore, significant decrease of pH should result in large number of ions. Total phenolic content was expected to increase significantly. There were two possible reasons that could account for this result. Firstly, Folin-Ciocalteu colorimetric method might not be suitable for this experiment. Different compounds havee different reactions to the Folin-Ciocalteu phenol reagent, and there are possible interferences from other chemical components such as vitamin C and sugars (Kahkonen and others 1999). Secondly, the ingredients interaction might be the cause for the results. Phenolic compounds could possibly be binded to other compounds presented in the system.
Future Studies
Further experiments should be conducted to measure the antioxidant activities of the soy bread and the green tea soy bread. If Folin-Ciocalteu colorimetric assay was not a suitable method, other methods such as radical scavenging and High Performance Liquid
Chromotography (HPLC) could be used to determine the antioxidant activity and/or measure the phenolic content in the food component.
Bioavailability should also be measured. In the food industry today, many food companies try to corporate many ingredients rich in antioxidants in the products. However, it would totally be futile if the bioavailability of the target compounds in the food products was low. Antioxidants are good for human health, but there is no point for consumption if they are not absorbed into the body.
Other future studies of this project include sensory analysis and also the interactions between ingredients in the product.
Conclusion
Apart from darkened crumbs, the green tea extract did not adversely affect the soy bread physical properties. The water activity was unaffected, as well as the texture. However, the pH decreased significantly with the addition of the tea extract in contradiction with the insignificant changes in total phenolic content.
This concept can be further developed in the food industry. The target consumers would be health conscious people who seek the benefits of both green tea and soy bread.
Acknowledgments
The author gratefully acknowledges the guidance of Dr. Yael Vodovotz. Financial support from the Undergraduate Research Scholarship, and assistance from Cory Ballard are also sincerely acknowledged.
References
1. Beta T, Nam S, Dexter JE,Sapirstein HD. 2005. Phenolic Content and Antioxidant Activity of Pearled Wheat and Roller-Milled Fractions. Cereal Chem. 82(4):390-393
2. Doss MX. 2005. Trapping of growth factors by catechins: a possible therapeutical target for prevention of proliferative diseases. J Nutri Biochem. 16(5): 259-266. 3. Hai NY, Jun JY, Sheng RS. 2006. Effects of EGC on PC-3 cell cytoplasmic
membrance in the presence of Cu2+. J Food Chem. 95(1):108-115.
4. Hodgson JM, Chan SY, Puddey IB, Burke V, Ward NC, Croft KD. 2004. Phenolic acid metabolites as biomarkers for tea and coffee derived polyphenol exposure in human subjects. British Journal of Nutrition. 91(2): 301-306.
5. HunterLab. 1996. [online] HunterLab Color Scale. [cited 20 March 2007].
6. Jung RK, Ok JC, Ki HS. 2005. Quality properties of loaf bread added with fermented tea powder. J of Korean Society of Fd Sci and Nutrition. 34(6):869-874
7. Jung SK. 2004. Study on antioxidant potency of green tea by DPPH method. J of Korean Society of Fd Sci and Nutrition. 33(7): 1079-1084
8. Kahkonen M, Hopia A, Vuorela H, Rauha J, Pihlaja K, Kujala T, Heinonen M. 1999. Antioxidant Activity of Plant Extracts Containing Phenolic Compounds. J Agric Food Chem 47; 3954-3962
9. Potter SM. 2000. Soy- New Health Benefits Associated with an Ancient Food. Nutrition Today 35(2): 53-60.
10. Rong W, Zhou W. 2004. Stability of Tea Catechins in the Breadmaking Process. Journal of Agricultural and Food Chemistry 52(26): 8224-8229.
11. Singleton V, Rossi J. 1965. Colorimetry of Total Phenolics with Phosphomolybdic-phosphotungstic Acid Reagents. Am. J. Enol. Vitic.16: 144-158.
12. Tawaha K, Alali F, Gharaibeh M, Mohammad M, El-Elimat T. 2006. Antioxidant Activity and Total Phenolic Content of Selected Jordanian Plant Species. Food Chemistry (2007). doi: 10.1016/j.foodchem.2007.01.064