IMPROVED MATERIAL IDENTIFICATION METHODS THROUGH
TARGETED DATA MINING
T. G. Fawcett1, C. E. Crowder1, S. N. Kabekkodu1, J. A. Kaduk2 1 International Centre for Diffraction Data
2 Poly Crystallography Inc., Naperville IL 60540 ABSTRACT
By using data mining techniques specifically focused on the process of phase identification, trace and minor phases can be identified and then quantitatively analyzed. The data mining attempts to intelligently mimic the thought process of experts in materials and analytical methods to
combine several “data clues” for a successful identification process. The clues can come from the diffraction experiment, but also physical properties, chemical composition, other analytical data, visual observations, or the users knowledge of the specimen and specimen preparation methods used. The method described is generic and is particularly useful in identification and quantitation of trace and minor phases where the diffraction data by itself may not be statistically sufficient but combined with other observations can be definitive.
INTRODUCTION
New methods have been developed for trace material identification by powder diffraction analysis. The new methods are fundamentally based on two major developments. The first are the data mining capabilities available with large collections of data within a relational database format, and specifically the data available in crystallographic and powder diffraction databases. The second development embodies the expert knowledge of international scientists, field experts, and database editors who have systematically standardized, classified and categorized the
world’s literature with a focus on material identification. The first development allows user to have a standardized and edited collection of reference data with comprehensive coverage based on hundreds of thousands of data entries and millions of data fields. The second development allows the user to systematically study and examine unknown materials, using expert knowledge, without having to be an expert themselves in all fields of science relating to solid state chemistry. Two additional changes have made these new methods both practical and efficient. Modern pattern fitting and data display techniques (pattern fitting, Rietveld, LeBail, Pawley and cluster methods), available today in most commercial data analysis software, enables a user to isolate and accurately measure the low intensity peaks associated with trace and minor phases. Modern computers allow one to search and classify these peaks in a matter of seconds.
Common texts (Pecharsky and Zavalij, 2009; Klug and Alexander, 1974; The United States Pharmacopeia, 2000) cite the limit of detection for an average X-ray diffraction experiment to be approximately 5 to 10 weight percent for individual components within a crystalline matrix. This is based on the fact that diffraction methods are bulk analysis methods where the component patterns are additive. Below 5-10 weight percent the analyst usually struggles with issues of particle statistics, overlapping peaks, absorption and low intensity peaks all of which act to lower the statistical confidence of the identification. (Jenkins and Snyder, 1996; Dinnebier and
overlapping peaks into their individual components (Walenta and Fullman, 2004; Windburn et. al., 2000 Kaduk, 2000) while advances in focusing optics and energy discriminating detectors enhance our ability to accurately measure low intensity data. With high resolution benchtop equipment or the use of synchrotron radiation it is not uncommon to measure hundreds of resolvable peaks within the practical scanning range of most powder diffraction experiments. In fact there are now many examples within the publication literature (Kagami and A. Takese, 2009; Kern 2009) of trace phase identification with high resolution laboratory data.
We will present methods that can be used with laboratory data to practically lower the detection capability by almost a factor of ten over the historically cited limits. The method is generic and can be used with any modern laboratory diffractometer. If applied to high resolution, high intensity sources, such as those available at one of the global synchrotron sources, detection limits can be further lowered.
EXPERIMENTAL
Data sets were obtained during ICDD Instructional Clinics. Specimens were selected by the ICDD and data collection was performed using instrumentation made available to clinic
attendees by the clinic sponsors. ICDD gratefully appreciates the contributions of Bruker-AXS, PANalytical B.V. and Rigaku America in providing access to state of art laboratory
diffractometers. The optics, detectors and the capabilities of the diffractometer used varied considerably. Data sets were collected at the clinics for several years. During this time period Jade, EVA, HighScore Plus, PDXL Search/Match programs were used. These programs have very sophisticated data analysis capabilities, however, we deliberately selected the most automated option available when performing search/match.
Nearly all the data collected for this study were produced from specimens that were lightly ground in a mortar and pestle and filled into a shallow cavity mount using zero background holders. However we have tested the method on data that were prepared through capillary mounts on both a high resolution diffractometer and a synchrotron.
For data mining, two large relational databases were chosen, Release 2010 PDF-4+ and Release 2010 PDF-4/Organics. For material identification a variety of programs were used. Residual analysis were performed by a variety of techniques that included inspection of peak listing tables and using enhanced graphics available in the above mentioned software packages. In some cases Rietveld residuals were analyzed and Rietveld analyses were successfully performed by GSAS, Jade and HighScore Plus.
METHOD
The focus of the method is to use information that the user typically has in their possession to data mine potential material candidates to a subset of ~10,000 materials from the known literature of hundreds of thousands of materials. Once the subset is established descriptive statistics within the relational database can be applied to two or more experimental observations to derive a unique phase identification. This allows the user to use a minimal set of parameters that they derive from the diffraction experiment to identify an unknown.
There are three general catagories of information used in the method Category 1. Typical information derived from a diffraction pattern
‐ Peak positions, often expressed as an interplanar spacing
‐ Peak intensity, preferably integrated intensities
‐ Peak profile
‐ Noise profiles and contributions
‐ Background profiles and contributions
Category 2. Information that can be derived or calculated from an analysis of the pattern
‐ Magnitude and types of experimental errors in both the intensity and position ‐ Indexed Candidate unit cells for the unknowns
‐ Location and intensity of unidentified peaks from a phase analysis
Category 3. Typical Information that may be known by the user
‐ State of the specimen (solid, slurry, polymer etc)
‐ Appearance of the specimen – particle shapes, colors, and morphology
‐ Other analytical data available on the sample (IR, nmr, elemental composition, MW, density…) Source of the sample (commercial, mineral, synthetic) History of the sample
In routine powder diffraction analyses, the search/match procedures used by nearly all global software distributors, heavily rely on processing information in categories 1 and 2. Candidate identifications typically are sorted through a figure of merit process that weighs several factors. These include the number of peaks matched, matches of the intensities and a calculation of the number of peaks found in the analysis area versus the number possible. Most software packages provide the user an ability to change the weighing scheme within the evaluation parameters. A material will be positively identified when these criteria are met. For very sound and practical reasons, automated software will rarely identify phases where there is a question on the
significance or magnitude of the intensity or when there are only a few peaks present. In fact it can be easily shown that without additional criteria basing an identification of one or two d-spacing would not be statistically valid.
The development of relational databases has enabled the user to use all the information in category 3, and more, as active filters for phase identification. This significantly changes the reliability of using a few peaks in an identification method.
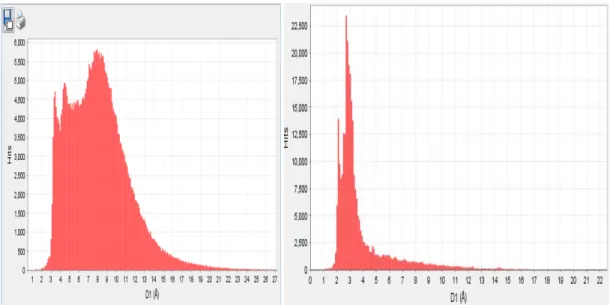
Figure 1. D-spacing distribution for approximately 700,000 materials. The graph on the left is a distribution of 403,773 data entries in Release 2010 PDF-4/Organics and the graph on the right is a similar distribution for 301,282 data entries in Release 2010 PDF-4+. Both graphs display the position of the single most intense peak of the diffraction pattern for each entry. Figure 1 shows the d-spacing distributions for two large relational database products, Release 2010 PDF-4/Organics and Release 2010 PDF-4+. The graph was plotted with approximately 0.1 Å increments from 0 to ~25 Angstroms. If we hypothetically use a single peak identification you can see that the user would not have a unique answer but in many cases have thousands to tens of thousands of choices. If we choose a single peak location along this distribution and vary the uncertainty of the peak position one could get the descriptive statistics shown in Table 1. If a second position is combined with the first (Table 2) or if another filter is applied, such as chemistry or a subfile (Table 1), the distribution is changed dramatically as shown.
PDF-4/Organics PDF-4+ PDF-4+
d-spacing (esd) 406,773 Entries 301,282 Entries Forensic File
4.1 (1) Å 213,066 163,720 6,964 4.1 (0.1) Å 31,110 16,550 817 4.11 (0.01) Å 3,488 1,746 77 4.111 (0.001) Å 510 465 26 4.1111 (0.0001) Å 38 10 0 4.11111 (0.00001) Å 10 7 0
Table 1. Descriptive statistics of d-spacing populations using a search of the strongest 3 lines of all entries. The Release 2010 PDF-4+ Forensic subfile is an expert edited file of 11,335 entries.
Combined
d-spacing d-spacing Entries
4.1(1) Å 7.1 (1) Å 985
4.1(0.1) Å 7.1 (0.1) Å 305 4.11 (0.01) Å 7.11 (0.01) Å 4 4.111 (0.001) Å 7.111 (0.001) Å 0
Table 2. Descriptive statistics demonstrating combined d-spacings using PDF-4+. The search statistics are based on the strongest 3 lines of a pattern and the statistics are based on a match of both of these lines within the standard deviation in parentheses.
These descriptive statistics have been explored previously and have been practically used in Search/Match processes, both manual and automated, for decades. The original Hanawalt search was based on paired d-spacing comparisons of the strongest three lines (J. D. Hanawalt et. al. 1938, J. D. Hanawalt, 1986, Frevel et. al. 1976) and was used when the PDF contained
thousands to tens of thousands of entries. This would have produced a statistical profile similar to using a subfile today. In the above example a combination of d-spacings at 4.11(1) and 7.11(1) would produce four candidate matches. The user would then examine the entire pattern of these four references with the experimental data to determine the best fit for the unknown
identification. The Fink Indexing method (Biglow and Smith, 1965) was based on the
distribution of long d-spacings, taking advantage of the statistical distributions shown in Figure 1. With databases now being in the hundreds of thousands of entries, permuted indexes of up to 8 lines can be used (Faber et. al. 2004) or the entire pattern can be utilized in the search match process (P. Caussin et. al. 1998, Nusinovici and Winter; 2004). However, statistical analyses based on a few strong lines excels when searching for trace and minor phases where one may only have a small number of statistically valid peaks in the experiment to use in the
identification.
In Tables 1 and 2, it is important to realize the practical limits of accuracy and precision in typical x-ray powder diffraction experiments. Numerous international round robins (Masciocchi and Artioli, 1996; Schreiner and Fawcett, 1984; Wong-Ng and Hubbard, 1987) have
demonstrated that d-spacings can be routinely measured to part per thousand precision ( (i.e 4.11 (1) to 4.111(1) Å)) with a well aligned diffractometer and prudent application of correct
specimen preparation techniques. In fact in many commercial search match systems, the vendors routinely supply a d-spacing comparison between the experiment and references that
demonstrate accuracy in this range. To achieve high levels of accuracy at a part per million, internal standards, such as a NIST SRM, need to be used (Fawcett et. al., 2004; Fawcett et. al. 1988). With routine d-spacing measurements of parts per thousands, the use of a subfile or other appropriate filters to practically reduce the candidate list becomes self evident.
It is very common for the user to know the general class or type of material he or she is
in these cases by the use of a subfile derived from either precise analytical definitions or the experience of field experts. In the Powder Diffraction File the experience of field experts are used in the metals and alloys, zeolite, minerals, forensics and pharmaceutical subfiles. The inorganic and organic subfiles are examples of a subfile produced by analytical definition. The excipients subfile is defined by commercial utility. As will be shown in the examples,
knowledge of the subfile can have a strong influence on the ability to obtain accurate material identifications.
RESULTS
Mineral from Bou Bekker, Morroco
This mineral was analyzed using two commercial search/match software programs. Both
programs easily and readily identified the major three phases as azurite (Cu3(OH)2(CO3)2), barite (BaSO4) and quartz (SiO2). They also identified that the barite best matched a reference of a Pb doped barite. X-ray fluorescence analysis did confirm that Pb, Ba and S were all present in bulk concentration. Both automated programs stopped at this point and did not identify any additional phases.
As shown in Figure 2 this identification process identified the bulk of the total scattering
intensity from the specimen, accounted for the great majority of the observe peak positions, and accounted for all major peaks with a relative intensity above ten. The results were fast and reliable with the answer consistent with the fact that this was a mineral sample and major
elements in the compound reflect the major elements identified by an X-ray florescence analysis. The statistics provided in the software of both commercial vendors indicated a high figure of merit for these identifications. It is at this point, after identification of the major phases by a reliable commercial software program, that we apply the trace identification methodology.
Figure 2. X-ray diffraction pattern of a mineral from Bou Becker, Morroco. The major phases three
of information. The nalysis has established a practical error range that can be applied to further analyses. An
eaks identified shows that they are within 0.03 Å of the cited
e for matching is 0.03 Å ) Azurite is a major phase
te visual appearance of green crystals on the rock and a ll pattern comparison of the reference entry with the experimental data. The identification of
.93(3) Å in a mineral specimen lead to the identification of fluorite (CaF2). Fluorite known to fluoresce under a ultraviolet light. The sample fluoresced when illuminated. When
nd
Na,Al,K,Fe)3(Al,Si)4O10(OH)2). Platelets were clearly observed in the mineral, however precise
ith the malachite and zurite. Curious as to why copper was not identified by XRD, the experimental pattern was
ray
identified were included in a Rietveld refinement. The five phases found after the first three phase identifications ranged in
eight hase solution starting from a three phase solution.
identified are azurite, quartz and Pb substituted barite. The data simulation using these phases is shown below the experimental data in red.
An examination of the match of the three phases with the peak list extracted from the experimental data now reveals that there are several unidentified peaks still remaining to be identified. In addition the analysis has given the user an important piece
a
examination of the dozens of p
reference materials. So the critical information obtained is as follows- 1) The specimen is a mineral
2) The experimentally derived d-spacing rang 3
4) There are unidentified peaks at 9.86, 5.94 and 1.93 Å that are the strongest intensity unidentified peaks remaining in the pattern.
The critical information can all be input into the data mining software of PDF-4+. The
combination of a mineral with a d-spacing of 5.94(3) Å, results in the identification of malachi (Cu2(OH)2CO3). This is confirmed by the
fu
the malachite/azurite combination would be expected by most mineralogists, they are heavily associated minerals in geologic deposits.
The peak at 1 is
the full pattern was compared to the experimental data several other peaks of fluorite were fou in the data.
The peak at 9.86(3) Å in a mineral did not lead to a unique identification. However nearly all candidate materials were chemically and structurally similar layered silicates
((
chemical analysis or an internally standardized and calibrated specimen would be required to distinguish among the silicate candidates with varying cation stoichiometries.
During the optical examination of the specimen, using a 10X zoom on a digital camera it was observed that there appeared to be thin veins of copper (Cu) associated w
a
reexamined. The major peaks of both copper (Cu) and cuprite (Cu2O) are observed in the x-data as subtle shoulders in the tails of overlapping peaks of the pattern.
For final confirmation of the analysis all 8 materials
concentration from 0.3 to 5.0 weight %. The methodology described above resulted in an p
A Vanadium Phosphate Catalyst for the Oxidation of Butane to Maleic Anhydride
A poorly performing catalyst was analyzed in hopes of discovering the cause for its lower yie The initial analysis quickly identified (VO)2P2O7 which was the expected catalyst composition and thi
lds. s component accounted for most of the total diffraction intensity in the pattern. There were several weak intensity peaks left in the pattern but the analysis effectively stopped at this point.
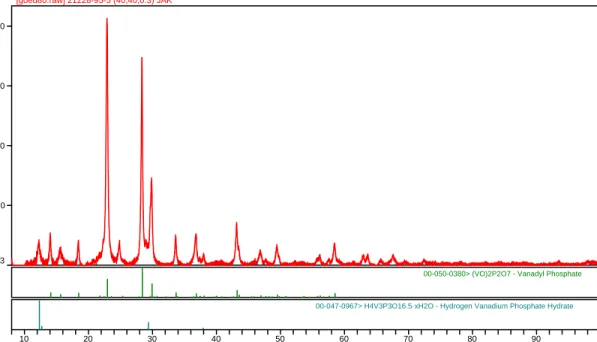
Figure 3. X-ray diffraction pattern of an oxidation catalyst. The stick figures below the pattern
an e residuals x10^3 5.0 10.0 15.0 20.0 In tens it y (Count s )
00-050-0380> (VO)2P2O7 - Vanadyl Phosphate
00-047-0967> H4V3P3O16.5·xH2O - Hydrogen Vanadium Phosphate Hydrate
10 20 30 40 50 60 70 80 90
Two-Theta (deg) [goed80.raw] 21228-95-5 (40,40,0.3) JAK
identify the d-spacings of the first two phases identified in the automated analysis.
The catalyst was originally of known chemical composition. Data mining was applied to the problem by filtering the candidate materials based on the known chemistry. A subset of “just” V, P, O and H was used with the specific d-spacings and an estimated esd to search candidate phases. The first search combined the chemistry and a strong peak at a d-spacing of 7.21 with esd of 0.05 Angstroms. This search yielded a single hit H4V3P3O16.5. xH2O, the second phase identified in Figure 1. At the time of the analysis the crystal structure was not reported in th Powder Diffraction File, it has been subsequently added. However a similar elemental search of the Inorganic Crystal Structure Database yielded the same powder pattern as above with a defined formula of H0.6 (VO)3 (PO4 )3. 7H2O. The largest intensity remaining identified peaks at 3.58 and 3.08 Angstroms were integrated into the search parameters. This process identified another vanadium phosphate phase. These phases were added to the original identified phase for a three phase Rietveld refinement. The refinement yielded additional unidentified
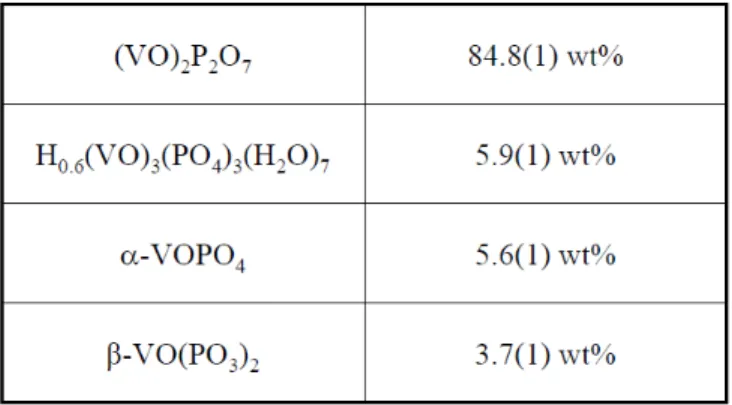
including one peak at 3.985 Angstroms. This was input into PDF-4+ identifying a fourth phase which was subsequently refined. The final concentrations are in the Table below.
Table 3. Quantitative Phase results from Rietveld refinement of the oxidation catalyst
) The chemistry was restricted to V, P, O and H
using d-spacings from Rietveld residuals and the data
our different Search/Match software programs were applied to this data set. Each program
nt rder
. s most of the diffraction intensity in the pattern and the phases
entified in the residuals contain several false positives. This consistent good performance in the
ing a peak at 2.10 Å that is the fourth most intense in the diffraction pattern.
The key information required for data mining 1) The specimen was a catalyst
2
3) d-spacings were identified by Rietveld residuals at 3.58, 3.08 and 3.985 A. 4) An esd was estimated from the major phase fit to the pattern.
The trace phase identification method
mining capability of PDF-4+ was able to take a one phase solution into a four phase analysis. Centrum Carb Smart Vitamin Pill
F
easily identified 5 phases, all in the top candidates with high figure of merit/goodness of match scores.
The phases identified were calcite (CaCO3), vitamin C (C6H8O6), monetite (CaHPO4), sylvite (KCl), and zincite (ZnO). The list of ingredients cite these materials as the major bulk compone of the pill with concentrations between 5 and 15 weight percent. The goodness of match o did change from program to program indicating slightly different evaluation criteria for the fit. This is consistent with the descriptions of the Search/Match process provided in the help files The five phase fit identifie
id
evaluation of bulk crystalline phases using modern software and databases was mimicked in prior round robin results.
Data mining for trace phases identified used the following information
1) The specimen was a ground pharmaceutical tablet. The excipients and pharmaceutical sub were us
files ed for data mining
) Remaining unidentified peaks were easily identified through both examination of d,I lists and
ase,
ss
es
ood chnique for identifiying cellulose patterns is to use data mining to create a cellulose subfile for
Iβ.
t
wt tified will be ependent on the technique used, counting statistics and resolution of the diffractometer. The
we obtained for this specific vitamin pill are typical.
n ll diffraction data. While the method is new, it is predicated on using expert knowledge and the 2) Major phase identification established an experimental esd to be applied to the unknown search
3
graphic displays
This process identified 4 additional phases, iron fumarate (Fe (C2H2O4)), magnesium oxide (MgO), vitamin B3 (C6H6N2O) and brushite (CaHPO4 2H2O). The brushite/monetite
combination represents the anhydrous and dihydrate calcium phosphate. A fifth additional ph microcrystalline cellulose, was primarily identified visually through its characteristic pattern of broad peaks at specific locations. All five of these phases were confirmed by comparing the entire reference pattern graphically to the experimental data. Magnesium oxide, despite having the fourth most intense peak in the experimental data was difficult to identify by conventional methods because only 2 peaks are present in the experimental two theta range. The second cro referencing peak is of a very low intensity so the pattern receives a low goodness of fit/merit score unless additional criteria are used. In this case the critical additional criteria is that only pharmaceutical and excipient phases were considered. This is critical because it greatly reduc the number of candidate phases that are known in pharmaceutical tablets and have a major peak at 2.10 Angstroms. The iron fumarate is very difficult to identify for two reasons a) its cross referencing major peaks are overlapped by other higher concentration patterns and b) the poor quality of the reference pattern itself. Once again application of the subfile criteria is an essential step in the identification. Vitamin B3, cellulose and brushite are weak intensity phases but we found good match with the entire pattern comparison including cross referencing peaks. A g te
easy comparison. In this case it would identify the cellulose as predominately cellulose
Overall in this example, standard methodology yields a five component solution while
application of data mining methods results in a ten component solution. Comparison with the lis of ingredients shows that these additional phases are present in 1 to 5 weight percent
composition. Specimens made from Centrum vitamin pills and other multi vitamin pills can be very good for evaluating phase identification methods. Centrum Carb Smart, and other
multivitamins that we have analyzed, contain several ingredients in bulk concentration (> 5%), minor concentrations (1-5 wt %) and trace concentrations (0.1-1.0 wt. %). In nearly all cases there will be small unidentified peaks and the number of phases iden
d
data mining results CONCLUSIONS
The authors tried to select three examples that demonstrated this method of analysis. The method is new because the tools utilized (pattern fitting, data mining, large database development, improved hardware) have just become commonly and widely available. The authors have doze of additional examples and believe this is a generic methodology that can be used with nearly a
decades old processes by which experts identify and quantify materials. The advantage of the method is that one doesn’t have to be an expert, even though being curious and observant helps
emendously.
er e l experience with synchrotron data where phases s low as 0.03 weight % have been detected.
CKNOWLEDGEMENTS
er arlsruhe, NIST, MPDS and CCDC. They analyze, standardize and lassify the world’s data.
REFERENCES
igelow W. C. , and Smith J. V., (1965) ASTM S.T.P., 372, 54
hniques and ew Enhancements in a Search/Match Program”, Adv. X-ray Anal., 31, 423-430
. See Chapter 6: Phase Identification and Quantitative Methods, John Wiley Sons Ltd., N.Y.
8) see se Analysis by Madsen I. C. and Scarlett, N. V. Y., RSC ublishing, Cambridge UK.
rganic Entries in the ICDD PDF-4/Organic 2003 Database”, Adv. X-y Anal., 47, 166-173.
g n Using 280,000 Data Sets in the owder Diffraction File” Adv. X-ray Anal., 47, 156-164.
d by the JCPDS-ICDD and U. S. National Bureau of Standards, Powder iffraction, 209-218.
, “A Fast Search Program for Powder iffraction Analysis”, J. Appl. Cryst., 9(3), 199-204
tr
We have also analyzed synchrotron data sets where we achieve both better resolution and a wid dynamic range of intensities by 1-2 orders of magnitude than shown in the examples here. W have one Vitamin pill case where 14 phases were identified in concentrations as low as 0.2 weight percent. One of the authors has persona
a
A
The authors work would not of been possible without the tireless efforts of editors and volunte editors at the ICDD, FIZ-K
c
B
Caussin, P., Nusinovici, J., and Beard, D. W. , (1988),”Specific Data Handling Tec N
Clearfield, A., Reibenspies J., and Bhuvanesh N., “Principles and Applications of Powder Diffraction” (2008)
&
Dinnebier R. E. and Billinge, S. J. L., “Powder Diffraction, Theory and Practice”, (200 Chapter 11, Quantitative Pha
P
Faber, J., Weth, C. A. and Bridge J., (2004) “A Plug-In Program to Perform Hanawalt or Fink Search, Indexing Using O
ra
Fawcett, T. G., Kabbekodu S. N., Faber, J., Needham, F. and McClune, F., (2004) “Evaluatin Experimental Methods and Techniques in X-Ray Diffractio
P
Fawcett, T. G., Crowder, C. E., Brownell, J., Zhang, Y., Hubbard, C., Schreiner, W., Hamill G. P., Huang, T. C., Sabino E., Langford, J. I., Hamilton, R. and Louer D., (1988), “Establishing an Instrumental Peak Profile Calibration Standard for Powder Diffraction Analyses: International Round Robin Conducte
D
Frevel, L. K., Adams, C. E., and Ruhberg L. R., (1976) D
Hanawalt, J. D., Rinn, H. W. and Frevel, L. K., (1938), “Identification of Crystalline Materials”, d. Eng. Chem., Anal. Ed., 10, 457-512 reprinted in Powd. Diff., (1986),1(2), 2-14
al Search/Match Methods for Powder Diffraction in 986”,Powd. Diff., 1(1), 7-13
e Chapter 13: Quantitative Analysis, Wiley InterScience, John Wiley & Sons Ltd., N.Y.
ods” presented at the 2009 Denver X-ray Conference. Abstract available at www.dxcicdd.com
In
Hanawalt, J. D., (1986), “Manu 1
Jenkins, R. and Snyder, R.L., (1996), “Introduction to X-ray Powder Diffractometry”, se
Kagami, E. and Takese, A., (2009), “Quantitative Analysis of Samples Including Known Trace Phases – Comparison of Rietveld and Calibration Curve Meth
.
tion Compounds Using Synchrotron Powder Data”, (2000), Adv. in X-Ray Anal., 42, 333-354
and raction at 0.05 wt % in highly crystalline samples. bstract available at www.icdd.com
Kaduk, J. A., “Solving Crystal Structures of Inorganic, Organic and Coordina
Kern, A., “XRPD Characterization of Pharmaceutical Solids, Quantitative Phase Analysis Lower Limit of Detection”,(2009) presented at PPXRD-8, Glasgow, Scotland, May 2009. Reports detection limits in powder diff
A .
Analysis of Powder Mixtures”, Wiley InterScience, John Wiley & Sons Ltd., N.Y., 2nd Edition.
iffraction Data: Results of a Round Robin Project”, Powder Diffraction, 11(3), 253-258. Using Full igital Traces as Input”, Adv. X-ray Anal., 37, 59-66 and references therein.
f Materials” see Chapter 13.3.3 Quantitative Analysis, Springer, N.Y., N. Y., USA, 2nd Edition,.
rrors Found in Routine X-Ray Diffraction Raw Data”, Adv. In X-ray Anal., 28, 309-314 s and 2007, (2000) published by United States Pharmacopeial Convention, Inc., Rockville, MD.
ments and Cementitous Additions”, (2004), Advances in X-ray Analysis, Vol. 47, pp 287-296.
Klug, H. P. and Alexander, L.E., (1974) “X-ray Diffraction Procedures”, see Chapter 7-2 Quantitative
Masciocchi, N. and Artioli, G., (1996) “Lattice Parameter Determinations from Powder D
Nusinovici, J. and Winter, M. J., (1993), “DIFFRAC-AT Search, Search/Match D
Pecharsky, V. K. and Zavalij, (2009), P. Y., “Fundamentals of Powder Diffraction and Structural Characteristics o
Schreiner W. N., and T. G. Fawcett, (1984), “Results of a Round Robin Study of Systematic E
“The United States Pharmacopeia, The National Formulary” USP 24, NF 19, Physical Test Determination, <941> X-ray Diffraction pp
Windburn, R. S., Lerach, S. L., Jarabek, B. R., Wisdom, M. A., Grier, D. G. and McCarthy, G. J. , (2000) “ Quantiative XRD Analysis of Coal Combustion By-Products by the Rietveld Method. Testing with Standard Mixtures”, Advances in X-Ray Analysis, Vol 42, pp 387-396. W. Wong-Ng and C. R. Hubbard, (1987), “Standard Reference Materials for X-ray Diffraction, Part II. Calibration using d-Spacing Standards”, Powder Diffraction, 2, 242-248