Dynamic Scalable Visualization for Collaborative Scientific Applications
Kai Li, Matthew Hibbs, Grant Wallace and Olga Troyanskaya{li,mhibbs,gwallace,ogt}@cs.princeton.edu Department of Computer Science
Princeton University, Princeton, New Jersey 08544
Abstract
Science disciplines are experiencing a data avalanche. As a result, scientific research is limited by data analysis and visualization capabilities. We have been working closely with Genomic and Plasma Physics researchers on effective data visualization software tools. This paper reports our research on developing software tools for high-resolution display walls to alleviate the current limitation on visualization resolution and single-user window system. In the first case, we developed a novel data visualization tools for genomic data visualization that is dynamic and scale free. In the second case, we have developed a multi-cursor window system for shared data visualization for a collaborative environment. We have deployed both software tools to the scientific researchers. Our initial feedbacks show that these approaches have made significant impact on their productivity.
1
Introduction
The Princeton Scalable Display Wall project explores how to build a high-quality, large-format display system with inexpensive commodity components and effectively utilize it in a collaborative environment. The goal is to develop techniques, software tools and applications that make a large-format display system scalable, easy to use and useful for collaborations. A recent specific focus in our work is to develop software tools for dynamic scale-free and shared visualization for scientific applications. The rationale for our focus is due to the fact that scientific disciplines have been experiencing a data avalanche and scientific research has been limited by data analysis. As a result of the technological revolution in computer industry in the 20th century, science is being transformed --- most scientific disciplines are becoming data rich [6]. To deal with the large quantities of data, many disciplines have formed data analysis arms (e.g. computational chemistry, computational physics and computational biology). The “Moore’s law curve” (doubling every 18 months) no longer refers only to the exponential improvement rate of processor performance, storage density and network bandwidth in computer industry, but also to the data growth rates of scientific disciplines. The most exciting aspect of the data
explosion is the potential to bring an equivalent explosion of knowledge in a scientific discipline. But, realizing this potential requires comprehensive data analysis and visualization of such data.
We have been working closely with researchers in genomics and plasma physics on data visualization. Our goal is to identify critical visualization limitations and to develop visualization systems to fulfill their needs. We found that there are two common limitations, though severities are different. The first issue is visualization resolution, which is caused by the embarrassingly slow rate of improvement in display resolution. During the past two decades, while compute power, storage density and network bandwidth have improved by more than three orders of magnitude, display resolution has been merely doubled. A typical genomic dataset now includes 6,000 to 50,000 gene measurements over 100 experiments [3]. Such data cannot be displayed effectively on a 2-million-pixel, 20-inch desktop display. In fusion research, physicists need to compare 100 to 200 of high-resolution data plots of experiment data. Such visualization is not possible on current desktop displays. The second limitation is that current visualization systems are designed for a single user. A fusion research lab’s control room requires intensive shared data visualization among physicists. During experiments, plasma pulses are taken with approximately 10 to 20 minutes in between each ~10 second pulse [12]. For every plasma pulse, up to 10,000 separate measurements versus time are acquired at sample rates from kHz to MHz, representing about a gigabyte of data. Such data will be analyzed and hundreds of data plots will be produced by the scientists in near real time. Throughout the experimental session, hardware / software plasma control adjustments are made as required by the experimental science. These adjustments are debated and discussed amongst the experimental team, based on hundreds of data plots produced by scientists. Decisions for changes to the next pulse are informed by data analysis conducted within the between-pulse interval. Traditionally, scientists walk around the control room to visualize and compare data plots on individual desktop displays. What the scientists want is a large-scale, shared visualization system that can be manipulated by multiple users simultaneously. In genomic research, although real-time data analysis is not a concern, there is
a strong demand for collaborative discussions among computational and laboratory researchers while visualizing and comparing large genomic datasets.
A scalable display wall system is a good platform for high-resolution shared data visualization [6,9]. The Princeton scalable display wall prototype is built with an array of 24 projectors, as shown in Figure 1, displaying about 20 million pixels per frame [2]. The screen of the display wall is 18’ by 8’. The scale is two orders of magnitude larger than a desktop display. Such a wall-size display system provides a group-oriented, collaborative visualization environment and can be used in a laboratory or a control room for shared data visualization. Our research explores how to develop software tools for a display wall system to overcome the two limitations.
Figure 1: Princeton’s second-generation display wall built with a 24-projector array with a total resolution of 6144 × 3072 pixels. The display screen is a black screen of 18’ × 8’. The projector array is driven by a 24-PC cluster with PC graphics cards and controlled by a console PC. The system also connects to input devices including Gyromouse, PDA wireless inputs, video cameras, HDTV feed and a distributed sound server.
This paper describes the two visualization software tools we developed for display walls and reports the initial
feedbacks from the scientists. The first is a novel visualization system for dynamic scale-free visualization of large genomic datasets. The visualization system explores several methods for visualization-based analysis of genomic data to exploit the high resolution and the large scale of a display wall system. We are deploying the visualization software to the biologists at the Lewis-Sigler Institute for Integrative Genomics at Princeton University. The second is a multi-cursor window system that allows multiple users to manipulate windows concurrently on a shared collaborative display system. We have deployed this software system to the shared display wall system in the NSTX control room (for Tokamak fusion experiments) at the Princeton Plasma Physics Laboratory. Our initial feedback shows that high-resolution, large-scale, shared data visualization can greatly improve the productivity of genomic and fusion researchers.
2
Dynamic Scale-Free Visualization
of Large Genomic Datasets
We have been working with genomic scientists on visualization of large-scale microarray data to facilitate analysis and discovery of biological information. Microarray data sets are created by measuring the activity level of genes in an organism under a variety of conditions, resulting in matrices that contain hundreds of measurements for each gene in the genome. Simple organisms such as yeast have about 6,000 genes, while humans have about 30,000. Biologists analyze this data to identify the biological function of genes by searching for patterns that imply that a group of genes behave together to perform a task. Understanding these functions and relationships between different genes is critical not only to fundamental biology, but also to medicine, as causes of many diseases such as cancer are very complex and thus have to be studied on the whole-genome scale. While many purely numerical methods are used for this analysis, the high level of noise in this data and the lack of a gold-standard for verification of results cause data visualization to be a key component of analysis. However, normal desktop resolutions only allow the data for about 100 genes to be viewed in detail simultaneously. This seriously hampers efforts in finding correlations across disparate genes, as well as the ability to analyze multiple aspects of the data concurrently. Furthermore, desktop displays and current visualization systems do not support collaborative research. As genomics is inherently a collaborative science that often requires biologists to work closely with statisticians and computer scientists, and often clinicians, effective visualization systems should enable dynamic analysis of the data by multiple researchers.
To address this problem we have been developing applications that allow genomic data to be viewed on large high-resolution displays [7]. The resolution of the Princeton display wall prototype system is 6144 × 3072, which has the ability to view all raw yeast gene data at once horizontally or one half of those vertically. Our initial experience shows that the display wall improves the visualization ability on a normal desktop display by at least an order of magnitude.
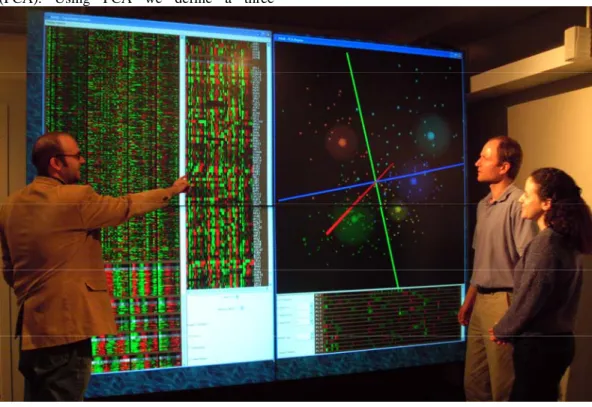
By utilizing the large scale and high resolution of the display wall, we can look at multiple views of each microarray dataset, enabling more detailed analysis of relationships between genes and groups of genes. One example of this is the use of Principal Component Analysis (PCA). Using PCA we define a
three-dimensional space that we project the data onto. This groups genes with similar measurements close to each other. Whereas these groupings can be dense and hard to distinguish on a desktop display, they become easier to distinguish when viewed on a large display. Figure 2 shows our system displaying a yeast cell cycle dataset on a tiled display wall. On the left is a display of raw data measurements and on the right is our PCA projection. Our system also enables noise-robust visualization via rank-based analysis, cluster quality analysis via outlier detection and visualization, and both PCA and hierarchical visualization-based analysis of cluster relationships.
Figure 2: Our system in use on a large-scale display wall. The high resolution enables display of more information simultaneously and the large scale creates an environment conducive for collaboration between multiple researchers.
Our implementation of these analysis methods is both scalable and modular. Although all of the visualizations share a common data structure for dynamic linking, each visualization is displayed in its own panel, allowing for easy addition or removal of new visualization components. Each of the panels is fully scalable for use on both desktop/laptop displays as well as large display walls, enabling biologists to work with their own computer or with the laboratory display wall.
A key feature of our system is that all of its components are dynamically linked to each other, so that selections, colorations, etc. are shared among views. This allows users to evaluate their data in a comprehensive manner,
taking advantage of the high-resolution and large scale of the display wall (Figure 2). The ability to use these visualizations on large, high-resolution displays allows researchers to view greater portions of their datasets simultaneously. The large format of the display also creates an environment where multiple users can interact collaboratively. Such collaborations are especially critical in fields like genomics where computational and biological researchers work side-by-side in analysis and interpretation of the data.
Initial response to our system is extremely positive. In fact, based on their initial experience with the system and the display wall, the Lewis-Sigler Institute for Integrative
Genomics at Princeton University just purchased a large-scale display wall for use by all the groups in the institute. Furthermore, we have developed a smaller, lower-cost, medium-scale display wall for laboratory use, to enable individual groups or small institutes to have access to the technology.
3
Shared Visualization for Control
Room Collaboration
As part of the FusionGrid [12] project, we have been working closely with Fusion scientists at several DOE Energy Research labs investigating the requirements for technology to improve collaboration within fusion control rooms. As mentioned in the introduction, fusion control rooms are dynamic environments where large amounts of data must be periodically generated and analyzed, and group decisions must be made and carried out within short time intervals. Since the fusion experiments are precious and costly, it is crucial that fusion scientists make the best decisions possible during the 10-20 minute between-shots time interval. Typically, over 20 scientists will be working in the control room. They each analyze a certain aspect of the collected data from the current plasma pulse (shot) and produce related data plots for group analysis. As a collective effort, hundreds of data plots would be produced for analysis and team discussion to determine the parameters for the next experiment. What we have learned from the fusion researchers is that the fusion control room requires not only a large-scale shared display for shared data visualization of hundreds of high-resolution data plots, but also the ability for scientists to move display information simultaneously from their workstations to the shared display.
A large-format display system for a collaborative environment should allow users to share information seamlessly and effortlessly. The goal is to virtually connect displays together such that display information can be moved seamlessly from one display to another for collaboration purposes, independent of platforms, operating systems and applications. Such a system should also allow multiple users to work within the shared display space simultaneously.
Unfortunately, existing window systems are single cursor based, assuming a single user per display [5,10]. Although window systems such as X windows [9] and
Microsoft Windows allow remote clients to show windows on a shared display, multiple clients have to time share the single cursor, each taking her turn to control windows or enter inputs into a single focused window. The serial input procedure is a barrier for control room collaboration where a large number of users need to show results generated from multiple applications simultaneously in order to make time-critical decisions.
We have developed a multi-cursor X window manager that provides multiple simultaneous cursors and multiple focused windows at the desktop level [13]. The window system allows multiple users to concurrently interact with all components of a desktop environment including applications, window position and size, and system menus. As an initial prototyping effort, we have taken the approach of extending an X11 window display server instead of designing a new window manager from scratch. To extend an X11 window display server, we made several assumptions including:
• A cursor can only grab the focus of one window at a time;
• If multiple cursors interact with the same single-user application, the event stream is the subsequent interleaving of cursor events;
• If multiple users control the same cursor, their interactions will be combined and interleaved; and
• Cursors must be easily distinguishable from one another and their associations with applications must be easily distinguishable.
The multi-cursor X window system has two key advantages over the multi-user collaborative application approach [1,4,9]. First, it allows shared data visualization from multiple legacy applications instead of one application or a specific set of applications. Second, it allows multiple users to share a display system in a completely distributed fashion.
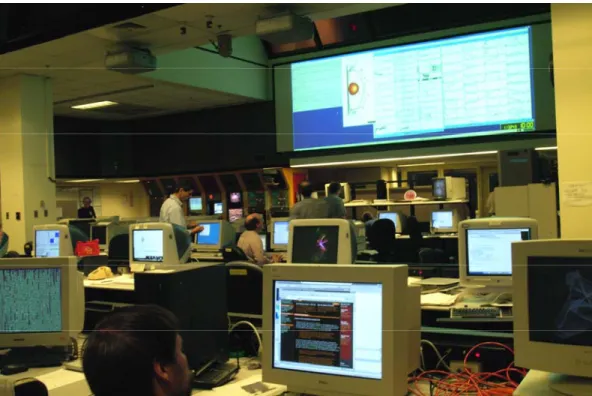
We have deployed an initial version of the multi-user shared display system to the control room at the Princeton Plasma Physics Lab (PPPL) shown in Figure 3. This incorporates the multi-cursor window manager in conjunction with application-sharing. Feedback from the control room users has been positive and they have come to rely on the shared display for their daily work activity.
Figure 3: Shared Display Wall deployed in the NSTX control room of Princeton Plasma Physics Lab. Tens of data plots from multiple scientists are shown on the shared display. A camera shot of the plasma and also a log are also shown on the left.
The initial feedback from the scientists is extremely positive. The scientists said that the shared visualization has already become a critical part of the control room. Side-by-side comparisons of data plots enabled by our software and the display wall have substantially improved the productivity of their experimental research.
4
Conclusions
Effective visualization methods that utilize large-scale displays are becoming increasingly necessary for effective analysis of scientific data. With the explosion of noisy and heterogeneous experimental data in the sciences, visualization-based analysis of such data is increasingly critical, as it enables accurate interpretation of such data by experts. In addition, the sciences are becoming increasingly collaborative, and large-scale displays create an environment where multiple researchers (potentially from different fields) can work side-by-side in analysis and interpretation of the data. Here we described effective systems for data visualization that we developed for genomics and for plasma physics. These systems have proven highly beneficial to the researchers in the field, and have the potential of being adopted in other laboratories.
5
Acknowledgements
This work was supported in part by NSF grant
CNS-0406415 and EIA-0101247, by DOE grant DE-FC02-99ER25387 and ANI-9906704, and by Intel Research Council. We would like to thank Scott Klasky and William Tang for their continuing support in the shared data visualization work and deployment of the visualization system at the control room of Princeton Plasma Physics Lab and David Botstein and his group for input on genomics visualization.
6
Reference
[1] R. Bentley, T. Rodden, P. Sawyer, and I. Sommerville. An Architecture for Tailoring Cooperative Multi-User Displays. CSCW, 1992.
[2]
H. Chen, R.Sukthankar, G. Wallace and K.
Li. Scalable Alignment of Large-Format
Multi-Projector Displays using Camera
Homography Trees, IEEE Visualization
2002.
[3] M.B. Eisen, P.T. Spellman, P.O. Brown and D. Botstein. Cluster analysis and display of genome-wide expression patterns. Proc Natl
Acad Sci U S A 1998 Dec 8, 95(25):14863-8.
[4] S. Elrod, R. Bruce, R. Gold, D. Goldberg, F. Halasz, W. Janssen, D. Lee, K. McCall, E. Pedersen, K. Pier, J. Tang, and B. Welch. Liveboard: a large interactive display
supporting group meetings, presentations, and remote collaboration. SIGCHI, 1992.
[5] D. C. Engelbart. A research center for augmenting human intellect. Proceedings of FJCC, 33(1):395{410, 1968.
[6] J. Gray and A. Szalay, “Where the Rubber Meets the Sky: Bridging the Gap between Databases and Science,” Technical Report, MSR-TR-2004-110, October 2004.
[7] M. Hibbs, N. Dirksen, K. Li and O. Troyanskaya, Visualization Methos for Statistical Analysis of Microarray Clusters. Submitted for publication.
[8] K. Li, H. Chen, Y. Chen, D.W. Clark, P. Cook, S. Damianakis,G. Essl, A. Finkelstein, T. Funkhouser, A. Klein, Z. Liu,E. Praun, R. Samanta, B. Shedd, J.P. Singh, G. Tzanetakis and J.Zheng, “Building and Using A Scalable Display Wall System,”.IEEE Computer
Graphics and Applications, 20(4): 671-680,
July/August 2000.
[9] Microsoft. Netmeeting.
http://www.microsoft.com/windows/netmeeting/ .
[10] R. Raskar, J. van Baar, P. Beardsley, T. Willwacher, S. Rao, C. Forlines, “iLamps: geometrically aware and self-configuring projectors,” Proceedings of ACM
SIGGRAPH 2003.
[11] R. Schei²er and J. Gettys. The X window system. ACM Transaction on Graphics, 5(2):79{109, 1986.
[12] SciDAC. FusionGrid.
http://www.fusiongrid.org/
[13] G. Wallace, P. Bi, K. Li, O. Anshus, “A MultiCursor X Window Manager Supporting Control Room Collaboration,” Princeton University, Computer Science, Technical Report TR-707-04, July 2004.