3D Visualization of the Research Results
Eva Pajorová and Ladislav HluchýInstitute of Informatics, Slovak Academy of Sciences, Bratislava, Slovakia
Abstract. Our research in institute is oriented on high performance computing like GRID and Cloud computing. A lot of international projects oriented on main research or in energy execution and in natural disasters damages execution utilize the HPC (High Performance Computing) as is grid or cloud computing. Within such solution raises requirement of visualization service for presentation of the intermediate or final research results. Our basic aim of our research resolved in projects is the creation visual service for the modeling and 3D rendering of research simulations results. We have developed some 3D visualization tools for present simulation results for applications on the field of astronomical main research and research in natural disasters or disasters in public buildings, before fire, floods, blackout and bombs. But also we have developed visualization in the field of energy execution results with a big data. Paper presents some of 3D visualization tools, whose have been developed in our institute.
Keywords: Big data, high performance computing, grid, 3D visualization tool
1
Introduction
Astronomical simulations, natural disasters, energy and crisis simulation is a very complicated, challenging problem sensitive to the input big data required. Therefore, intense research and development of sophisticated software systems and tools is extremely important for such simulations [6]. For our - Slovak forests, original methodology for forest vegetation classification and new fuel models have been developed and proper forest fire simulations related to the locality Krompla (National Park Slovak Paradise), where the large destructive fire appeared and its reconstruction have been analyzed. These efforts induced the end of better auxiliary tools for 3D visualization of obtained simulation results and for animation of the forest fire spread [3].
Advance in sciences and engineering has put high demand on tools for high-performance large-scale visual data exploration and analysis. For example,
astronomical scientists can now study evolution of all solar systems on lot of astronomical simulations. These simulations can generate large amount of data, possibly with high resolution (in three dimensional space) and long time series.
Single-system visualization software running on commodity machines cannot scale up to the large amount of data generated by these simulations. To address this problem, there have been developed a lot of different Grid-based visualization frameworks for time-critical, interactively controlled file-set transfer for visual browsing of spatially and temporally large datasets in a Grid environment. Lot of frameworks for grid and cloud based visualization are solved such problem. We can travel during evolution of sophisticated grid based visualization frameworks with a new one actualized functionalities. For example „Reality Grid“, „Uni - Grid“, „Terra Grid [6] “.The Uni – Grids [1] project developed a Grid Service infrastructure compliant with the Open Grid Service Architecture (OGSA). It is based on the
UNICORE Grid software
initially developed in the German UNICORE and UNICORE Plus projects [2]. The paper presents a design and utility of 3D visualization tools which are solving in our Institute.2
Astronomical simulations
The design is tested on the astronomical simulations in the scope of collaboration between Astronomical Institute of SAS, Catania Observatory and Adam Mickiewicz University in Poznan. The simulation was ported to EGEE by Institute of Informatics SAS [4].
For a long time computing of Intensive Parametric Studies one of a main problem is to control if executions converge to the correct way. Client naturally wants to see the intermediate results. Such problem calls for correct way of submission representing a reduction of the number of jobs as a visual control of the results in time while the application is running. The described tool is able to visualize the partial results of the application. The user can completely control the job during execution, and can change the input parameters while execution is still running. Both tools - tool for submission, designed before and continued sequence visualization tool provided complete solution of the specific main problem in Grid environment.
Visualization is designed as a plug in module. Client asking for visualization is as a Visualization client. Outputs data on the storage element are as an inputs data for visualization jobs. Configuration file will be included by Visualization tool (VT) for the application. Therewith can be activated control script. Workers to modify data to the visualize formats, but not only, workers also to prepare the typical visualization scenes. Client can to render such scenes on the browser and he can make the visual control and to modify executions. Multiple visualizations generated from a common model will improve the requirements creation, reviewing and understanding process. Visual representations, when effective, provide cognitive support by highlighting the most relevant interactions and aspects of a specification for a particular use. The goal of scientific visualization is to help scientists view and better understand their data. This data can come from experiments or numerical simulations. Often the size and complexity of the data makes it difficult to understand by direct inspection. Also, the data may be generated at several times during an experiment or simulation and understanding how the data varies with time may be difficult. Scientific visualization can help with these difficulties by representing the data so that it may be viewed in its
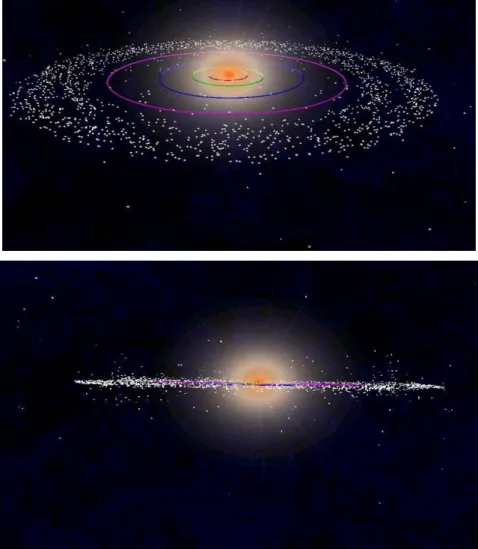
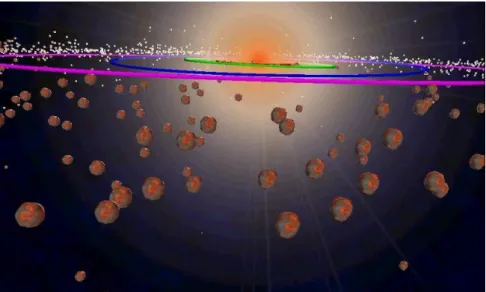
entirety. In the case of time varying data, animations can be created that show this variation in a natural way. Using virtual reality techniques, the data can be viewed and manipulated naturally in a true three dimensional environment (e.g. depth is explicitly perceived and not just implied). All these techniques can allow scientists to better understand their data. Viewing the data in this way can quickly draw the scientist's attention to interesting and/or anomalous portions of the data. Because of this, we encourage scientists to use scientific visualization from the beginning of their experiments and simulations and not just when they think they have everything operating correctly. This also allows the scientists to develop a set of visualization tools and techniques that will help them understand their data as their research matures. In depend of our astronomical example; in order to understand immediately the evolution of the investigated proto-planetary disc we have developed a Visualization Tool (VT). Examples as output from VT you can see on figures 1 and 2.
Fig. 2. The final results of evolution the Protoplanetary disk
3
Simulations of Natural Disasters
Natural disaster simulation and execution with a huge data usually spend long execution time. Good solution for execution is represented by grid and actually on cloud computing. In both infrastructures visualization has the main position as a way to control the execution process. Visual control has in all infrastructure very useful position. The simulation was realized as a sequence of parameter studies, where each sub-simulation was submitted to the grid as a separate parameter study. The job management was rather time consuming due to the analysis of failed jobs and to their re-submission. Visualization is included as a visual control process. For example, understand the fire spread we have developed a Visualization Tool (VT). The VT is composed of several modules, which are responsible for creating scenes and converting data to, the “visualize” format. The components generating rendering scenes are easy to exchange, according to the requirements of the given application. In case of our gratified application the output data of the simulation located on the SE can be used directly as the input for the VT. The final product of the VT includes a set of files containing data in the VRML (Virtual Reality Modeling Language) format. These output files can be rendered by many available VRML web-browsers. The whole visualization process is maintained through a visualization script, whose basic function is invoking the individual VT components in successive steps, transferring data, and handling error events. The script is written using the Bourne shell scripts and all VT modules are implemented in the C++ language. The VT can be embedded into the framework described above, or can be used separately as a stand-alone program. By using the VT the client can stop the execution process, change the input parameters and restart the execution process again. In grid environment, such architecture can be used for all applications from different science spheres which have the character of a
parametric study. Actually, the research community needs not only “traditional” batch computations of huge bunches of data but also the ability to perform complex data processing; this requires capabilities like on-line access to databases, interactivity, fine real-time job control, sophisticated visualization and data management tools (also in real time), remote control and monitoring. The user can completely control the job during execution and change the input parameters, while the execution is still running. Both tools, the tool for submission designed before and continued sequential visualization tool, provide complete solution of the specific main problem in Grid environment. Example of big fire is shown in figure 3.
Fig.3. Visualization from big fire on Krompla hill.
4
Crisis Simulations
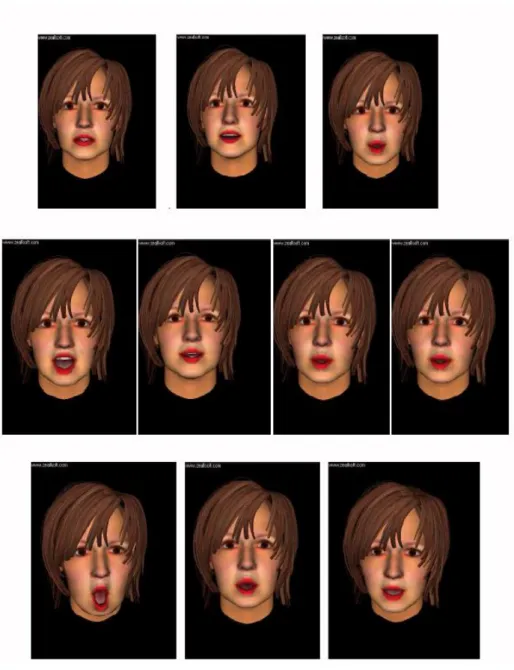
In crisis time like are fires, bombs, floods ...many deaf people are using lip reading as a main communication form. A viseme is a representational unit used to classify speech sounds in the visual domain and describes the particular facial and oral positions and movements that occur alongside the voicing of phonemes. A design tool for creating correct speech visemes is designed. It's composed of 5 modules; one module for creating phonemes, one module for creating 3D speech visemes, one module for facial expression and module for synchronization between phonemes and visemes and lastly one module to generate speech triphones. We are testing the correctness of generated visemes on Slovak speech domains. Our developed tool is one of the actually developed software tools which ensure smooth link between regular distance learning and training of hearing impaired. For this, additional Sing Language (SL) information will be
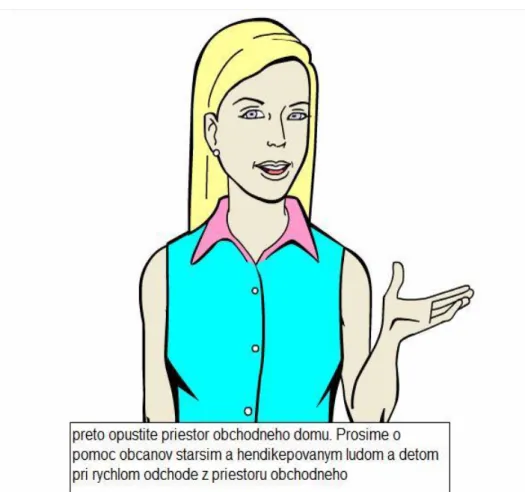
inserted in the main data stream of the video warning message. The corresponding SL information will be represented by video sequences with two SL interpreters; one will be contour image and second will be virtual speaking head. Both will be visualized scaled down in one of the lower corners of the main image. In order to significantly reduce this additional information, the contour images will be used instead of the full video. They are obtained after processing of the consecutive TV frames of the SL interpretation. The contour images represent very well the movements of the interpreter’s hands and give very good vision of his/her face expression, which is of high importance for the sign comprehensibility. This approach permits hearing impaired people orientate himself during crisis situations like are fire, flood, bombs in big halls, in big store, in railway station, cinemas and exhibition grounds. In Crisis time the monitors included in public areas have changed mode. They change normal mode to crisis mode and they are starting to generate the warning messages [14]. A tool is able to complete warning messages with text windows included on bottom of the monitor; see figure 4. Text window is included on bottom of the monitor. Slovak speech visemes you can see on figure 5.
Fig. 5. The main of Slovak speech visemas.
5
Energy-water Management Simulations
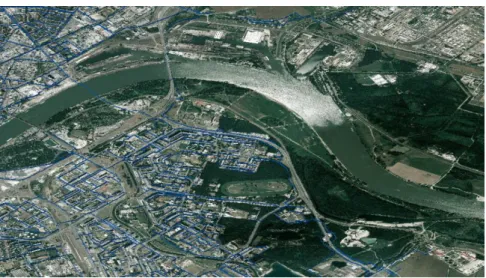
Environment, that provides sufficient information for 3D calculations and simulations in water management required to design a 3D virtual terrain of Bratislava and its surroundings and the water supply pipes, water towers and 3D view nodes. According
to the thirds coordinate of an annotation type (.dgn) files to transfer, we received the shape-files, thus obtained 3D coordinates. We used them to create a digital 3D model - TIN of the Bratislava and surroundings terrain. See figure 6.
Fig. 6. 3D model -"TIN" of Bratislava and surroundings
In such an environment we've created from the 3D model to which we show orto-photomap of Bratislava and surroundings. The advantage of 3D visualization is that pipes for the purpose of displaying the results of the simulations we can tap to display not just beneath the surface, where it is located, but also on the surface of the ground in fact [1], where you can watch the results of the simulation figure 7.
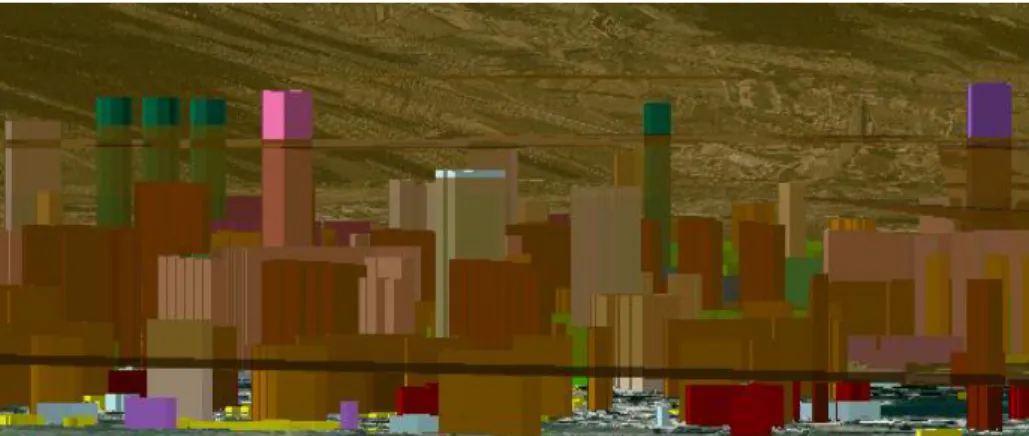
An important component for the display of water pressure and the flow rate of water loss, are high-rise buildings. In order to make it easier to differentiate the amount of buildings, so we knew on a virtual model of the building so that buildings appear with one floor are displayed in a different color than the building with two floors and three floors, as well as other buildings, etc. So we have achieved a virtual model of the environment and the surroundings of Bratislava with water pipes, water - towers and nodes and also with the buildings, the amount of which is colorfully differentiated. 3D virtual model are designed to provide an adequate environment for displaying the results of calculations already in the water economy [2]. See figure. 8.
Fig.8 Virtual model of Bratislava and surroundings, with the water pipes and buildings In this environment the proposed 3D model displaying calculation results from the simulation calculated with the simulation program EPANET [8] on the computer clusters. To view a simulation of the water pressure within 24 hours after we have chosen 3D display using transparent 24 - TINs - models, created from HGL01 up to HGL24 output data. From these results we have created 24 transparent 3D TIN - models. Each TIN is the level of water pressure due to the high-rise buildings. If any of the extra tall buildings overlap the transparent TIN, it means that its level is over the normal water pressure. See figure 9.
Water flow rates during 24 hours we display from Flow01 to Flow24 outputs data. To view the flow of water during the 24 hours we have chosen one color scale. In the framework of this color range are graded from minus maximum value till plus the maximum value; a total of 8 fields. See in the figure 11.
Outputs, which we have test till yet, have been the executed during the 24 hours, where they were too small differences in the data which is also reflected on the display. In the future we want to display multiple simulation outputs from EPANET cluster executions, before for more time range. Also we will try to find the best form of 3D display and animation outputs.
Fig. 9. A sample of 3D visualization of the simulation results computed by EPANET-water pressure during 24 hours.
Fig.10. Examples showing the results of the simulation of water flow during the 24 hours, calculated by the simulation program EPANET and computing on clusters.
6
Conclusions
This paper proposed a developed 3D Visualization tools for the visualization output research results from simulations in different research fields. In a future we plan to innovate and expand our new one visualization tools, which meets in maximum the requirements of clients.
Acknowledgements. The article is supported by the project: Centre of water supply risk of a large city, Nr. 26240220082 and VEGA 2/0054/12.
References
1. The Reality Grid Project on the web: http://www.realitygrid.org/Uni Grid on web: http://www.unigrids.org/
2. Glasa, Ján et al.: Analysis of forest fire behavior by advanced computer fire simulators. Communications Scientific Letters of the University of Žilina, vol. 2, p. 26–31 (2011) 3. Astaloš, Ján et al.: Slovak Participation in the World LHC Computing Grid. In: 6th
International Workshop On Grid Computing For Complex Problems, Bratislava: GCCP, L. Hluchý, P. Kurdel, J. Sebestyénová (eds.), Bratislava : Institute Of Informatics SAS, pp. 21– 27 (2010)
4. Wilkins-Diehr, N.,Gannon, D., Klimeck, G., Oster, S., Pamidighantam, S.: TeraGrid Science Gateways and Their Impact on Science. IEEE Computer 41(11):32–41 (2008) 5. Cruz, M.G., M.E. Alexander, R.H. Wakimoto: 3D Nature, LLC. Using VNS (Manual). 6. Arvada, C.O.: 3D Nature, LLC. Assessing canopyfuel stratum Emerging 16 Technology
characteristics in crown fire from fuel types of North America. International Journalof Wildland Fire 12:39–50 (2003)
7. Orland, B.: SmartForest: a 3-D interactive forest visualization and analysis system. In: Proceedings, Decision Support 2001 - Resource Technology 94, pp. 181–190, Bethesda, MD: American Society for Photogrammetry and Remote Sensing (1994)
8. Software: EPANET.| Drinking Water Research | US EPA , EPANET is software that models water distribution piping systems. EPANET is public domain software that may be freely copied and distributed. http://www.epa.gov/nrmrl/wswrd/dw/epanet.html