University of Zurich Main Library Strickhofstrasse 39 CH-8057 Zurich www.zora.uzh.ch Year: 2015
Impaired implicit learning and feedback processing after stroke Lam, J M ; Globas, C ; Hosp, J A ; Karnath, H-O ; Wächter, T ; Luft, A R
Abstract: The ability to learn is assumed to support successful recovery and rehabilitation therapy after stroke. Hence, learning impairments may reduce the recovery potential. Here, the hypothesis is tested that stroke survivors have deficits in feedback-driven implicit learning. Stroke survivors (n=30) and healthy age-matched control subjects (n=21) learned a probabilistic classification task with brain activation measured using functional magnetic resonance imaging in a subset of these individuals (17 stroke and 10 controls). Stroke subjects learned slower than controls to classify cues. After being rewarded with a smiley face, they were less likely to give the same response when the cue was repeated. Stroke subjects showed reduced brain activation in putamen, pallidum, thalamus, frontal and prefrontal cortices and cerebellum when compared with controls. Lesion analysis identified those stroke survivors as learning-impaired who had lesions in frontal areas, putamen, thalamus, caudate and insula. Lesion laterality had no effect on learning efficacy or brain activation. These findings suggest that stroke survivors have deficits in reinforcement learning that may be related to dysfunctional processing of feedback-based decision-making, reward signals and working memory.
DOI: https://doi.org/10.1016/j.neuroscience.2015.11.051
Posted at the Zurich Open Repository and Archive, University of Zurich ZORA URL: https://doi.org/10.5167/uzh-117095
Journal Article Accepted Version
The following work is licensed under a Creative Commons: Attribution-NonCommercial 4.0 International (CC BY-NC 4.0) License.
Originally published at:
Lam, J M; Globas, C; Hosp, J A; Karnath, H-O; Wächter, T; Luft, A R (2015). Impaired implicit learning and feedback processing after stroke. Neuroscience, 314:116-124.
Impaired implicit learning and feedback processing
after stroke
Judith M. Lam a, Christoph Globas b, Jonas A. Hosp b, Hans-Otto Karnath a,c, Tobias Wächter
a *, Andreas R. Luft b,e*
a
Center of Neurology and Hertie Institute for Clinical Brain Research, University of Tübingen, Otfried-Müllerstr. 27, 72076 Tübingen, Germany
b
Division of Vascular Neurology and Neurorehabilitation, Department of Neurology, University of Zürich, Frauenklinikstrasse 26, 8091 Zürich, Switzerland
c
Department of Psychology, University of South Carolina, Columbia, SC 29016, USA
d
German Center of Neurodegenerative Diseases (DZNE), Hoppe-Seyler-Str. 3, 72076 Tübingen, Germany
e
cereneo Center for Neurology and Rehabilitation, Vitznau, Switzerland
*both contributed equally. email addresses:
[email protected], [email protected], [email protected], [email protected], tobias.waechter@[email protected], [email protected]
Running title: Stroke and reinforcement learning
Correspondence:
Andreas R. Luft, MD, Department of Neurology, University of Zürich,
Frauenklinikstrasse 26, 8091 Zürich, Switzerland, Tel: +41 44 255 5400, Fax: +41 44 255 4649, [email protected]
Abstract
The ability to learn is assumed to support successful recovery and rehabilitation therapy after stroke. Hence, learning impairments may reduce the recovery potential. Here, the hypothesis is tested that stroke survivors have deficits in feedback-driven implicit learning. Stroke survivors (n=30) and healthy age-matched control subjects (n=21) learned a probabilistic classification task with brain activation measured using functional magnetic resonance imaging in a subset of these individuals (17 stroke and 10 controls). Stroke subjects learned slower than controls to classify cues. After being rewarded with a smiley face, they were less likely to give the same response when the cue was repeated. Stroke subjects showed reduced brain activation in putamen, pallidum, thalamus, frontal and prefrontal cortices and cerebellum when compared with controls. Lesion analysis identified those stroke survivors as learning-impaired who had lesions in frontal areas, putamen, thalamus, caudate and insula. Lesion laterality had no effect on learning efficacy or brain activation. These findings suggest that stroke survivors have deficits in reinforcement learning that may be related to dysfunctional processing of feedback-based decision-making, reward signals and working memory.
Keywords: stroke, classification learning, reinforcement learning, fMRI, reward, feedback
Introduction
Ischemic brain injury is the major cause of disability in adults by affecting motor function, speech and cognition (Rosamond et al., 2007). For stroke patients, neurorehabilitative training is an effective intervention to increase independency in daily life activities (Bowen et al., 2002, Brady et al., 2012, Veerbeek et al., 2014). This training-induced reduction of impairments is mediated in part by plastic reorganization of cortical circuits (Nudo, 2003, Schaechter, 2004) and depends on the brains ability to learn (Krakauer, 2006, Dominguez-Borras et al., 2013, Russell et al., 2013). Thus, many training principles for successful skill learning are also used in rehabilitation therapy (French et al., 2007, Orrell et al., 2007, Boyd et al., 2010, Ausenda and Carnovali, 2011).
The delivery of feedback is an important modulator of learning as pleasant and rewarding stimuli may reinforce and increase the effectiveness of learning (Wachter et al., 2009, Lam et al., 2013). Adding rewarding feedback to rehabilitative training improved its effectiveness in stroke patients that suffer from motor deficits (van Vliet and Wulf, 2006, Subramanian et al., 2010) and spatial neglect (Malhotra et al., 2013). Feedback is encoded in fronto-cortical-striatal circuits that are interlinked with structures involved in reward processing (e.g. hippocampus and amygdala) and modulation of attention (e.g. temporo-parietal cortical areas) (Mesulam, 1999, Russell et al., 2013). Patients with lesions in the basal ganglia demonstrate learning deficits and show reduced rehabilitation success (Boyd et al., 2009).
The objective here is to assess the integrity of feedback-based learning in stroke patients using an implicit probabilistic classification task (Knowlton et al., 1996) that was recently validated for healthy volunteers.
Materials and Methods
Subjects and TaskTwenty-one healthy elderly subjects (control) and 30 stroke survivors were recruited via advertisements. An analysis of the data of control subjects was published previously (Lam et al., 2012). Stroke patients were included if they had suffered an ischemic stroke six or more months before enrollment. The presence of stroke was confirmed by MRI and diagnosed by an experienced stroke-neurologist (CG). Exclusion criteria for all participants were visual impairments, a Mini Mental Status exam (MMS) < 27 points and Beck’s Depression Index (BDI) > 11 points. In addition to the MMS and BDI, the Student opinion scale (SOS) and a quality-of-life questionnaire were collected. In all patients, structural MRI scans of the ischemic lesion were performed. Ten of the 21 control subjects and 17 of the 30 stroke survivors underwent fMRI testing. The study was approved by the Ethics Committee of the University of Tübingen, Germany. All participants provided written informed consent.
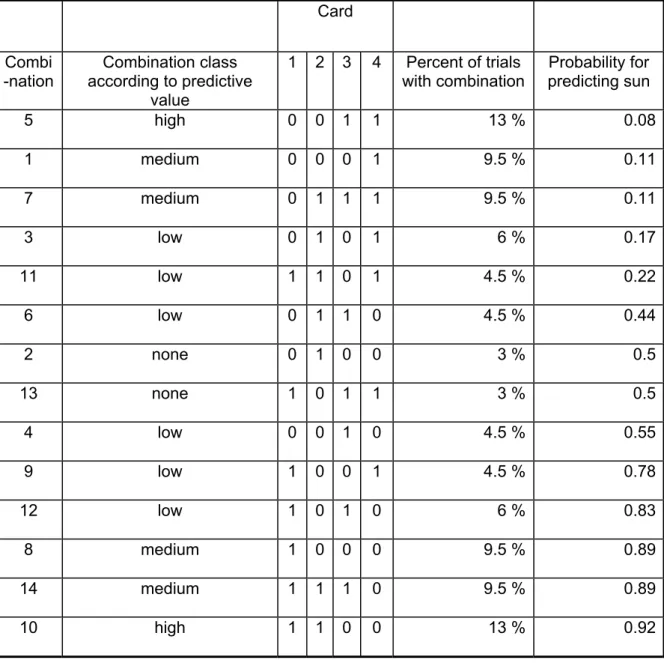
The weather prediction task (WPT) was performed as described by Knowlton and coworkers (1996). The task is a two-alternative forced-choice classification task in which participants learn probabilistic associations between 14 different combinations of four playing cards and two weather outcomes, sun and rain. Each card is associated with an outcome with a pre-specified probability (for sun: card 1 - 80%, card 2 - 54%, card 3 - 43%, card 4 - 20%, vice versa for the outcome rain). Either one, two or three cards are presented composing 14 different combinations that predict the weather with a certain probability. Table 1 shows for each combination of cards the probability and how often the combinations were presented during the 150- trial training period. Predictive probability was classified as high, medium or low. This
stratification was done because some combinations were presented less frequently than others. By grouping we obtained prediction classes of approximately equal frequency.
Each trial consisted of the presentation of a card combination and the response of the subject – („sun“ or „rain”) by pressing one of two buttons followed by feedback in form of a smiley or a frowney face. For example, for card combination 10 (Table 1) 92% of the trials required a „sun“ response and 8% a rain response to see only smileys. Otherwise, frowneys were shown. The paradigm was implemented using Matlab (Mathworks Inc, Natick, MA, USA) and Psychtoolbox (www.psychtoolbox.org).
The WPT was verbally explained and briefly trained before the experiment (on average 20 trials). This practice ensured that participants became used to the procedure. Neutral faces were shown as feedback during practice trials. Participants were instructed not to talk with the investigator during the entire experiment. After presentation of a card combination, the subject had to respond within 4 seconds or the trial was scored as “incorrect”. After 3 seconds, a prompt („Please press a button“) appeared on the screen. After pressing either the „sun“ or the „rain“ button, feedback was shown for 2 seconds. After every 50 trials a one-minute break was allowed. One experiment included 150 trials.
[Table 1 approximately here] Analysis of behavioral data
Trials in which the subject responded identical to a preceding trial where the same card combination had been rewarded with a smiley (same response after smiley, SAS) were counted. The two trials could have been subsequent or several trials apart. As a measure of reinforced memorization of a card combination, the ratio of
the number of SAS and all smiley trials was calculated (= SAS / (SAS + OAS); OAS: opposite response after smiley). Vice versa, to examine if subjects remembered to change their response behavior after seeing a negative feedback (i.e. a frowney), we counted „opposite response after frowney“ (OAF) and „same response after frowney“ trials.
Trials were scored as “correct” when subjects chose the optimal response that is the more probable weather (sun or rain) for the card combination presented, e.g. for card combination 10 (Table 1) all trials in which the response was „sun“ were counted as “correct”. This count was not identical to the number of responses that resulted in smiley feedback since feedback was probabilitstic according to probabilities shown in Table 1. Behavioral data were analyzed by plotting the percentage of correct responses for every 30 trials to obtain a learning curve.
Additionally, reaction times between presentation of the card combination and the subject’s response were recorded and compared between groups. Trials in which subjects did not respond were scored as “incorrect”. The percentage of missed responses was calculated and compared between groups.
For statistical testing Prism version 5.0 (GraphPad Inc., San Diego, CA, USA) and JMP (version 10, SAS Institute Inc., Cary, NC, USA) were used. Learning curves were compared between groups using repeated measures ANOVA. Sphericity was assessed using Mauchly‘s test and Greenhouse-Geisser (G-G) correction was applied if the test was significant. SAS/(SAS+OAS) ratios were compared using ANOVA with group as between-subject factor and pattern as within-subject factor including the interaction of the two.
Functional magnetic resonance imaging (fMRI)
A 3 Tesla scanner (Trio-Tim with 8-channel phased-array head coil, Siemens, Erlangen, Germany) was used. Visual cues were presented via a projection system installed in the scanner room. Responses were collected using an MRI-compatible button-box.
The WPT was performed in participants naïve to this task as described above except that the intertrial interval was 5 seconds, subjects had to respond within 4 seconds and did not receive written prompts. A control task was included before the WPT to record brain activity related to visual processing and movement comparable to the WPT. In the control task, one, two or three cards were shown. Subjects were asked to respond with the right button when two cards were presented and the left button when one or three cards were shown. Thirty practice trials were performed outside the scanner in which neutral faces were shown as feedback to avoid learning before the definitive experiment began. Brain activity during WPT was measured during three blocks of 50 trials each separated by 30 seconds of fixation. Fifty trials of the control task were performed before the WPT.
A high-resolution T1-weighted scan was acquired for anatomical localization. Functional imaging was performed using a gradient-echo planar T2*-weighted sequence with blood oxygenation level (BOLD)-contrast (TR=2.4 s, TE=30 ms, flip angle=90°). Thirty-eight slices (slice thickness 3 mm) were acquired to cover the entire brain.
fMRI Analysis
We used Brainvoyager QX (version 2.2, Brain Innovation BV, Maastricht, The Netherlands) to transform the anatomical data into Talairach space and process the fMRI data. Talairach transformation involves two steps. First, the brain is rotated so
that the anterior-posterior commissure plane is horizontal. Then the brain is warped into the standard space after defining its boundaries (anterior, posterior, superior, inferior, right, and left). Visual inspection of the Talairach transformation was done by two investigators (JML and CG) to ensure a plausible result without tissue shrunken or stretched into lesioned areas. BOLD-weighted EPI datasets were corrected for slice acquisition timing and head motion. Motion correction parameters were used as confound predictors in first-level GLM analyses. Datasets were registered to Talairach space in correspondence to the anatomical dataset. Images were spatially (Gaussian kernel, full-width at half-maximum of 8 mm) and temporally (3 cycles, GLM-Fourier-high-pass-filter) smoothed.
The statistical analysis modeled each trial as two events, one before (presentation)
and one after the button press (feedback). Two random effects general linear models
were computed, one for each type of event:
1. Presentation: This model included group (stroke/control), predictive value
(high/medium/low probability, Table 1), and sun/rain as independent variables.
2. Feedback: This model included group (stroke/control) and smiley/frowney as
independent variables.
T-tests were used to construct statistical maps for contrasts of independent variables. The statistical threshold was Bonferroni-corrected for multiple comparisons. Talairach coordinates of the center, the number of voxels above the statistical threshold and average p-values were measured for each cluster of activation that was equal or larger than 10 voxels (10 x 3mm x 3mm x 3mm).
Lesion analysis
MRI datasets with right-sided lesions were flipped so that the lesion was on the left side for all subjects. For each individual, the boundary of the lesion was then manually delineated by one experimenter (JML) on every consecutive axial slice showing the lesion using MRIcron software ((Rorden et al., 2007),
http://www.mccauslandcenter.sc.edu/mricro/ mricron/). The extension and location of
the lesion shapes were verified by a stroke-neurologist (CG).
We employed two types of statistical voxel-wise lesion-behavior mapping (VLBM) analyses. First, using the t-test statistic implemented in the MRIcron toolset we computed a voxel-based lesion symptom mapping (Rorden et al., 2007) relating lesions to a measure of learning performance, i.e the memory index SAS/(SAS+OAS). We controlled for multiple comparisons by using the False Discovery Rate (FDR) correction. Second, we performed a subtraction analysis (Rorden and Karnath, 2004) between two subgroups of stroke patients, namely good learners (n=20) versus poor learners (n=10). Poor learners were those with memory index one standard deviation or more below the mean of the control sample for card
combination “92% sun” (i.e. memory index ≤ 0.6). The resulting subtraction graphs
display the frequency (in percent) by which an area is more frequently lesioned in poor compared to good learners (e.g. a value of 10% indicates that a voxel is lesioned 10% more frequently in poor learners than in good learners). To evaluate the resulting statistical maps with respect to cortical and subcortical gray matter structures, we used the Talairach daemon ((Lancaster et al., 2000),
Results
Sample characteristics
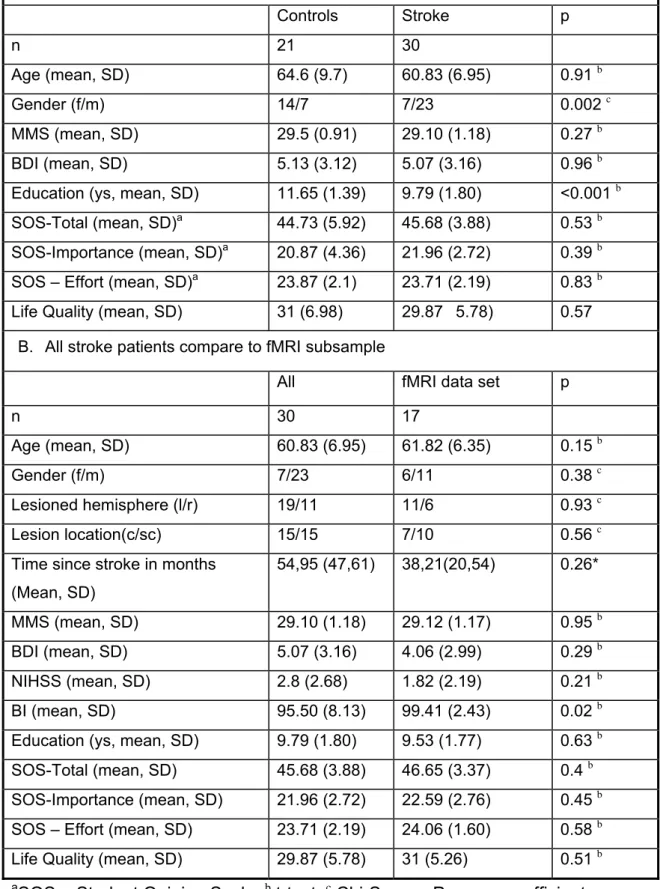
Stroke and control subjects did not differ in age, Mini Mental Status, Becks Depression Inventory, Motivation and Life satisfaction Index. There were more male subjects in the stroke group but more females among controls. Control subjects reported significantly more years of education than stroke participants (Table 2A). fMRI subsets of neither stroke nor control groups differed from the respective full datasets in demographic, stroke-related or outcome-related variables (Table 2B).
[Table 2 approximately here] Classification learning
Stroke subjects remembered card combinations poorly. The percentage of „same response after smiley“ trials (SAS / SAS + OAF), an index of positive feedback-related memory, was overall significantly lower in stroke than in control participants
(ANOVA, interaction effect of pattern × group: F=2.27; p=0.048). Post hoc tests
revealed significant differences for the card combinations „92% sun“ (p=0.016) and “89% sun” (p=0.037, uncorrected for multiple comparisons, Figure 1A). As reported previously (Lam et al., 2013), learning in control subjects is proportional to the degree predictive value of card combinations and the pleasant context (sun) is learned more effectively than rain (Figure 1A). This modulation of predictive value and context was absent in stroke subjects.
To display the temporal evolution of performance, learning curves are shown for the “92% sun”-card combination (Figure 1B). Controls improved their performance, i.e. the number of correct responses, faster than stroke survivors and reached a higher
Negative feedback (frowney faces) was less effective in supporting learning consistent with previous work (Lam et al., 2013). No differences between stroke and control subjects were found for the “opposite after fronwney-indes” (OAF/OAF+SAF;
ANOVA, interaction effect of pattern × group: F=0.191; p=0.966; Figure 1C).
[Figure 1 approximately here]
In all statistical models age, gender, side and location of lesion were initially included as independent variables but were removed after they showed no significant effects. Reaction times between presentation and response did not differ between stroke and control subjects in the entire sample (mean±SD, control: 1.65±0.49, stroke: 1.66±0.37, p=0.96) as well as for the subsets of participants undergoing fMRI (control: 1.42±0.39, stroke: 1.53±0.36, p=0.44).
The percentage of missed responses, i.e., when subjects did not press a button within 4 sec, was low and did not differ between groups (entire sample: mean±SD, control: 0.76%±1.52%, stroke: 0.62%±1.05%, p=0.70; fMRI subset: control: 0.47%±1.52%, stroke: 0.82%±1.05%, p=0.42).
Brain activation during classification learning
During presentation, i.e., the period from seeing the card combination to pressing the response button, overall brain activation in stroke subjects was reduced as
compared with controls. The model analyzing presentation included predictive value
(pattern class), sun/rain and group as independent variables. Neither of the two-way
interactions (predictive value × group, sun/rain × group) yielded significant voxels.
The F-test for group, however, revealed a large number of significant voxels. We
therefore computed a t-test for the contrast control > stroke that resulted in highly
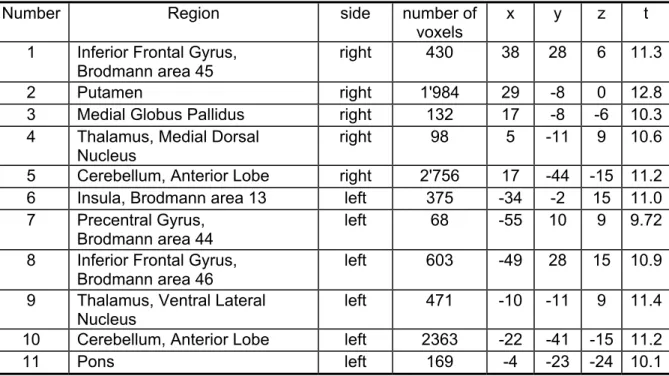
significant voxels (corrected for multiple comparisons, p < 0.00005) in the following brain regions: right-sided inferior frontal gyrus, putamen, thalamus and cerebellum;
and left-sided precentral and inferior frontal gyri, insula, thalamus, pons and cerebellum (Table 3, Figure 2). Estimated beta values for these regions were not correlated with the individual learning performance as measured using the SAS/(SAS+OAS) ratio. No region was found to be more active in stroke than in control subjects.
[Table 3, Figure 2 approximately here]
Within the stroke cohort, activation during presentation was found in right
cerebellum, frontal lobe (BA 9, 10), parietal lobe (BA 7) and cingulate gyrus (BA 32; random effects corrected for multiple comparisons, p<0.05).
During feedback, i.e., the period from pressing the response button to seeing the next card combination, smiley feedback produced less brain activation in stroke than
in control subjects. The model analyzing feedback events included group and
smiley/frowney as independent variables. The interaction group × smiley/frowney (F-test) revealed large areas of activation in both cerebral hemispheres and in the
cerebellum. Hence, two t-tests contrasting the groups (control > stroke) for either
smiley or frowney trials were computed. Smiley feedback was associated with stronger activation in the right putamen and bilaterally in the cerebellar anterior lobe (Figure 3, Table 4). No between-group differences were found for frowney-feedback. Correlations between estimated beta values for each region and the index of how well smileys were remembered, i.e., SAS/(SAS-OAS), were not significant. Comparing these underactive regions in each stroke subject with the individual lesion showed no overlap except in one stroke survivor.
Within the stroke cohort, activation during feedback was found in bilateral
cerebellum, bilateral parietal (BA 7, 40), left frontal (BA 8, 9, 47) and temporal lobes (BA 21, random effects corrected for multiple comparisons p<0.05).
Lesion side and location
An overlay of all lesions showed that the brain region most commonly injured (n=13) was the premotor cortex (center Talairach coordinates: x=-22, y=-8, z=34, Figure 4A). Indices of learning or memory did not differ between patients with left-sided (n=11) and right-sided lesions (n=6). Random effect models found no difference in brain activation between these groups. The VLSM analysis performed on the continuous measures indexing learning performance (the memory index SAS/(SAS+OAS)) did not reveal any significant voxel after controlling for multiple comparisons. In a subtraction analysis we then contrasted good (n=20) with poor learners (n=10) as defined by a value worse than one standard deviation below the mean of the control sample, respectively (i.e. for memory index: 0.8, STDEV = 0.2). For the memory index the subtraction plot (Figure 4B) revealed that patients with poor memory often (40%) had lesions in anterior prefrontal cortex (BA 10), putamen, caudate, temporal cortex and insula.
Discussion
The weather prediction task involves learning probabilistic associations between a visual cue and a dichotomous response. Based on a model of feedback-based decision-making (Hiroyuki, 2014) constituents of an internal model (predictive value of cues/affective coupling of outcomes) are modulated by positive or negative feedback to initiate a learning process. We have previously shown that healthy individuals learn best if the predictive value of a cue is high and the estimated outcome is associated with a pleasant content. Learning is better if subjects are rewarded instead of being punished, even if feedback is given in the form of weak stimuli such as smiley and frowney faces (Wachter et al., 2009, Lam et al., 2013). Stroke patients regardless of their age, gender or lesion location showed reduced learning. The deficit was more severe for card combinations with high predictive value, pleasant content (i.e. sun) and a rewarding feedback (i.e. smiley) indicating a deficiency to form an internal model adjusted to rewarding feedback. To explain this deficit, we analyzed brain activation during learning using functional magnetic resonance imaging, with separated measurements of presentation and feedback phase of each trial (Lam et al., 2013).
During presentation, stroke survivors show reduced activation of brain regions related to decision-making (inferior frontal and precentral gyrus, putamen, pallidum, thalamus, insula and brainstem), especially with respect to prediction of outcomes and the anticipation and evaluation of rewarding feedback (Liu et al., 2011). Whereas, the ventral putamen is thought to represent the experienced value of an outcome, the insula mediates a successive affective experience and the medio-dorsal thalamus is involved in regulation of activation and arousal related to feedback (Sescousse et al., 2013). Thus, the reduced activation of these regions
during the presentation phase would explain the deficit in the perception of predictive value and affective content of cues after stroke (Figure 1A). In line with this argumentation, ischemic damage to ventral putamen, dorsal thalamus, left insula and frontal cortex is associated with poor reward sensitivity and a high degree of self-reported apathy (Rochat et al., 2013) and patients with basal ganglia lesions have deficits in reward-based reversal learning (Bellebaum et al., 2008).
During feedback presentation, activation was reduced in putamen and the anterior cerebellar lobe bilaterally (Table 4). Reduced activation was not a result of the lesion itself as demonstrated by the comparison of lesion superposition maps and fMRI results.
Whereas the putamen is crucial for anticipating the value of an outcome/feedback, the role of the cerebellum for feedback-based implicit learning is less clear. Apart from its well defined function for training-induced adjustment of movements by integrating sensory feedback (Seidler et al., 2002), it has been suggested that higher-level feedback - such as reward - can reach the cerebellum to be integrated into learning processes (for review see (Ramnani et al., 2004). In line with this hypothesis, Thoma and coworkers (Thoma et al., 2008) reported deficits in reinforcement learning in patients with cerebellar dysfunction. Whereas the cerebellar mossy and and climbing fiber network may be specifically apt to integrate reinforcement signals (Swain et al., 2011), a MRI resting state analysis suggested the cerebellum to be functionally connected with the nucleus accumbens (Cauda et al., 2011), an area known to receive feedback and reward-related signals. Furthermore, an interplay between cerebellum and forebrain may be involved in integrating information about feedback, its value and strength (Swain et al., 2011).
Lesion side did not affect learning behavior, although this observation may be compromised by small and disproportionate samples sizes. Therefore laterality effects were removed by mapping all lesions to one hemisphere. The subsequent voxel-wise subtraction analysis showed that poor learners frequently had lesions in insular and striatal areas, but especially often within the inferior pre-frontal cortex (BA 10). Implicit learning is frequently impaired after prefrontal lesions (Barker et al., 2004, Chase et al., 2008) and probabilistic classification learning is facilitated by direct current stimulation of the prefrontal cortex (Kincses et al., 2004). The prefrontal cortex is thought to integrate information about the assumed value and prediction of outcomes into the processes of decision-making and the re-adjustment on this information based on related feedback (Liu et al., 2011).
In a classical model of working-memory, the prefrontal cortex contributes to bind information from a number of sources into coherent episodes, shifting between different tasks or retrieval strategies and shifting attention in response to a meaningful input (Baddeley and Della Sala, 1996). In addition, dorsofrontal regions (Brodmann‘s areas 44-46) - that showed a reduced activation during the representation phase in the fMRI analysis - are also involved in working memory processes (Seamans and Yang, 2004), especially the interference in repetitive response tendencies (Forstmann et al., 2008). Thus, a deficiency in working memory could alternatively explain the impairment of classification learning in stroke patients independent from feedback systems. Although we did not explicitly assess working memory, a severe dysfunction of attentional processes is unlikely, as reaction times and the percentage of missed responses were not different between stroke patients and controls.
Finally, controls had a slightly higher level of education when compared to stroke survivors. Thus, a confounding effect of this difference on behavioral data can not be excluded. However, in the subgroup of individuals that underwent fMRI investigation, there was no significant difference with respect to years of education.
Although classification learning in stroke patients is significantly impaired, there is a fair degree of overlap in performance when compared to controls at the level of single individuals. Despite to this overlap in behavioural performance, fMRI analysis revealed a clear and robust difference in activation between stroke survivors and controls for both, presentation and feedback phase. However, correlations between estimated beta values for each significantly different brain region and the individual memory index were not statistically significant. This finding can be explained by the small sample size (n=17), especially as behavioral performance and the extent of brain activation revealed by fMRI may be loosely correlated within the aging brain (Minati et al., 2007).
Conclusion
This study shows a reduced activation of brain regions involved in feedback-based decision-making and working memory in stroke survivors when compared to healthy age-matched subjects. This may contribute to the deficits in probabilistic classification learning after stroke observed here, both for associating card combinations with weather outcomes as well as for remembering single trials that had previously been rewarded with smiley faces. Learning deficits may negatively impact recovery and rehabilitation after stroke and further studies are needed to test these potentially severe consequences.
Funding
This work was supported by a grant from the Hertie Foundation and the P&K Pühringer Foundation.
References
Ausenda C, Carnovali M (2011) Transfer of motor skill learning from the healthy hand to the paretic hand in stroke patients: a randomized controlled trial. Eur J Phys Rehabil Med 47:417-425.
Baddeley A, Della Sala S (1996) Working memory and executive control. Philos Trans R Soc Lond B Biol Sci 351:1397-1403; discussion 1403-1394.
Barker LA, Andrade J, Romanowski CA (2004) Impaired implicit cognition with intact executive function after extensive bilateral prefrontal pathology: a case study. Neurocase 10:233-248.
Bellebaum C, Koch B, Schwarz M, Daum I (2008) Focal basal ganglia lesions are associated with impairments in reward-based reversal learning. Brain 131:829-841.
Bowen A, Lincoln NB, Dewey M (2002) Cognitive rehabilitation for spatial neglect following stroke. The Cochrane database of systematic reviews CD003586.
Boyd LA, Edwards JD, Siengsukon CS, Vidoni ED, Wessel BD, Linsdell MA (2009) Motor sequence chunking is impaired by basal ganglia stroke. Neurobiology of learning and memory 92:35-44.
Boyd LA, Vidoni ED, Wessel BD (2010) Motor learning after stroke: is skill acquisition a prerequisite for contralesional neuroplastic change? Neurosci Lett 482:21-25. Brady MC, Kelly H, Godwin J, Enderby P (2012) Speech and language therapy for aphasia
following stroke. The Cochrane database of systematic reviews 5:CD000425. Cauda F, Cavanna AE, D'Agata F, Sacco K, Duca S, Geminiani GC (2011) Functional
connectivity and coactivation of the nucleus accumbens: a combined functional connectivity and structure-based meta-analysis. J Cogn Neurosci 23:2864-2877. Chase HW, Clark L, Myers CE, Gluck MA, Sahakian BJ, Bullmore ET, Robbins TW (2008)
The role of the orbitofrontal cortex in human discrimination learning. Neuropsychologia 46:1326-1337.
Dominguez-Borras J, Armony JL, Maravita A, Driver J, Vuilleumier P (2013) Partial recovery of visual extinction by pavlovian conditioning in a patient with hemispatial neglect. Cortex; a journal devoted to the study of the nervous system and behavior 49:891-898.
Forstmann BU, van den Wildenberg WP, Ridderinkhof KR (2008) Neural mechanisms, temporal dynamics, and individual differences in interference control. J Cogn Neurosci 20:1854-1865.
French B, Thomas LH, Leathley MJ, Sutton CJ, McAdam J, Forster A, Langhorne P, Price CI, Walker A, Watkins CL (2007) Repetitive task training for improving functional ability after stroke. Cochrane Database Syst Rev CD006073.
Hiroyuki N (2014) Multiplexing signals in reinforcement learning with internal models and dopamine. Curr Opin Neurobiol 25:123-129.
Kincses TZ, Antal A, Nitsche MA, Bartfai O, Paulus W (2004) Facilitation of probabilistic classification learning by transcranial direct current stimulation of the prefrontal cortex in the human. Neuropsychologia 42:113-117.
Knowlton BJ, Mangels JA, Squire LR (1996) A neostriatal habit learning system in humans. Science 273:1399-1402.
Krakauer JW (2006) Motor learning: its relevance to stroke recovery and neurorehabilitation. Current opinion in neurology 19:84-90.
Lam JM, Wachter T, Globas C, Karnath HO, Luft AR (2012) Predictive value and reward in implicit classification learning. Human Brain Mapping.
Lam JM, Wachter T, Globas C, Karnath HO, Luft AR (2013) Predictive value and reward in implicit classification learning. Human brain mapping 34:176-185.
Lancaster JL, Woldorff MG, Parsons LM, Liotti M, Freitas CS, Rainey L, Kochunov PV, Nickerson D, Mikiten SA, Fox PT (2000) Automated Talairach atlas labels for functional brain mapping. Human Brain Mapping 10:120-131.
Liu X, Hairston J, Schrier M, Fan J (2011) Common and distinct networks underlying reward valence and processing stages: a meta-analysis of functional neuroimaging studies. Neurosci Biobehav Rev 35:1219-1236.
Malhotra PA, Soto D, Li K, Russell C (2013) Reward modulates spatial neglect. Journal of neurology, neurosurgery, and psychiatry 84:366-369.
Mesulam MM (1999) Spatial attention and neglect: parietal, frontal and cingulate contributions to the mental representation and attentional targeting of salient extrapersonal events. Philosophical transactions of the Royal Society of London Series B, Biological sciences 354:1325-1346.
Minati L, Grisoli M, Bruzzone MG (2007) MR spectroscopy, functional MRI, and diffusion-tensor imaging in the aging brain: a conceptual review. J Geriatr Psychiatry Neurol 20:3-21.
Nudo RJ (2003) Adaptive plasticity in motor cortex: implications for rehabilitation after brain injury. J Rehabil Med 7-10.
Orrell AJ, Eves FF, Masters RS, MacMahon KM (2007) Implicit sequence learning processes after unilateral stroke. Neuropsychol Rehabil 17:335-354.
Ramnani N, Elliott R, Athwal BS, Passingham RE (2004) Prediction error for free monetary reward in the human prefrontal cortex. NeuroImage 23:777-786.
Rochat L, Van der Linden M, Renaud O, Epiney JB, Michel P, Sztajzel R, Spierer L, Annoni JM (2013) Poor reward sensitivity and apathy after stroke: implication of basal ganglia. Neurology 81:1674-1680.
Rorden C, Karnath HO (2004) Using human brain lesions to infer function: a relic from a past era in the fMRI age? Nat Rev Neurosci 5:813-819.
Rorden C, Karnath HO, Bonilha L (2007) Improving lesion-symptom mapping. J Cogn Neurosci 19:1081-1088.
Rosamond W, Flegal K, Friday G, Furie K, Go A, Greenlund K, Haase N, Ho M, Howard V, Kissela B, Kittner S, Lloyd-Jones D, McDermott M, Meigs J, Moy C, Nichol G, O'Donnell CJ, Roger V, Rumsfeld J, Sorlie P, Steinberger J, Thom T, Wasserthiel-Smoller S, Hong Y, American Heart Association Statistics C, Stroke Statistics S (2007) Heart disease and stroke statistics--2007 update: a report from the American Heart Association Statistics Committee and Stroke Statistics Subcommittee.
Circulation 115:e69-171.
Russell C, Li K, Malhotra PA (2013) Harnessing motivation to alleviate neglect. Frontiers in human neuroscience 7:230.
Schaechter JD (2004) Motor rehabilitation and brain plasticity after hemiparetic stroke. Prog Neurobiol 73:61-72.
Seamans JK, Yang CR (2004) The principal features and mechanisms of dopamine modulation in the prefrontal cortex. Prog Neurobiol 74:1-58.
Seidler RD, Purushotham A, Kim SG, Ugurbil K, Willingham D, Ashe J (2002) Cerebellum activation associated with performance change but not motor learning. Science 296:2043-2046.
Sescousse G, Caldu X, Segura B, Dreher JC (2013) Processing of primary and secondary rewards: a quantitative meta-analysis and review of human functional neuroimaging studies. Neurosci Biobehav Rev 37:681-696.
Subramanian SK, Massie CL, Malcolm MP, Levin MF (2010) Does provision of extrinsic feedback result in improved motor learning in the upper limb poststroke? A
Swain RA, Kerr AL, Thompson RF (2011) The cerebellum: a neural system for the study of reinforcement learning. Front Behav Neurosci 5:8.
Thoma P, Bellebaum C, Koch B, Schwarz M, Daum I (2008) The cerebellum is involved in reward-based reversal learning. Cerebellum 7:433-443.
van Vliet PM, Wulf G (2006) Extrinsic feedback for motor learning after stroke: what is the evidence? Disability and rehabilitation 28:831-840.
Veerbeek JM, van Wegen E, van Peppen R, van der Wees PJ, Hendriks E, Rietberg M, Kwakkel G (2014) What is the evidence for physical therapy poststroke? A systematic review and meta-analysis. PloS one 9:e87987.
Wachter T, Lungu OV, Liu T, Willingham DT, Ashe J (2009) Differential effect of reward and punishment on procedural learning. J Neurosci 29:436-443.
Tables
Table 1: Card combinations with their predictive value and presentation frequency. Card Combi -nation Combination class according to predictive value 1 2 3 4 Percent of trials with combination Probability for predicting sun 5 high 0 0 1 1 13 % 0.08 1 medium 0 0 0 1 9.5 % 0.11 7 medium 0 1 1 1 9.5 % 0.11 3 low 0 1 0 1 6 % 0.17 11 low 1 1 0 1 4.5 % 0.22 6 low 0 1 1 0 4.5 % 0.44 2 none 0 1 0 0 3 % 0.5 13 none 1 0 1 1 3 % 0.5 4 low 0 0 1 0 4.5 % 0.55 9 low 1 0 0 1 4.5 % 0.78 12 low 1 0 1 0 6 % 0.83 8 medium 1 0 0 0 9.5 % 0.89 14 medium 1 1 1 0 9.5 % 0.89 10 high 1 1 0 0 13 % 0.92
Table 2. Demographic and stroke-related parameters.
A. Control sample compared to stroke sample
Controls Stroke p n 21 30 Age (mean, SD) 64.6 (9.7) 60.83 (6.95) 0.91 b Gender (f/m) 14/7 7/23 0.002 c MMS (mean, SD) 29.5 (0.91) 29.10 (1.18) 0.27 b BDI (mean, SD) 5.13 (3.12) 5.07 (3.16) 0.96 b Education (ys, mean, SD) 11.65 (1.39) 9.79 (1.80) <0.001 b
SOS-Total (mean, SD)a 44.73 (5.92) 45.68 (3.88) 0.53 b SOS-Importance (mean, SD)a 20.87 (4.36) 21.96 (2.72) 0.39 b SOS – Effort (mean, SD)a 23.87 (2.1) 23.71 (2.19) 0.83 b
Life Quality (mean, SD) 31 (6.98) 29.87 5.78) 0.57 B. All stroke patients compare to fMRI subsample
All fMRI data set p
n 30 17
Age (mean, SD) 60.83 (6.95) 61.82 (6.35) 0.15 b
Gender (f/m) 7/23 6/11 0.38 c
Lesioned hemisphere (l/r) 19/11 11/6 0.93 c
Lesion location(c/sc) 15/15 7/10 0.56 c
Time since stroke in months (Mean, SD) 54,95 (47,61) 38,21(20,54) 0.26* MMS (mean, SD) 29.10 (1.18) 29.12 (1.17) 0.95 b BDI (mean, SD) 5.07 (3.16) 4.06 (2.99) 0.29 b NIHSS (mean, SD) 2.8 (2.68) 1.82 (2.19) 0.21 b BI (mean, SD) 95.50 (8.13) 99.41 (2.43) 0.02 b Education (ys, mean, SD) 9.79 (1.80) 9.53 (1.77) 0.63 b SOS-Total (mean, SD) 45.68 (3.88) 46.65 (3.37) 0.4 b
SOS-Importance (mean, SD) 21.96 (2.72) 22.59 (2.76) 0.45 b SOS – Effort (mean, SD) 23.71 (2.19) 24.06 (1.60) 0.58 b Life Quality (mean, SD) 29.87 (5.78) 31 (5.26) 0.51 b a
Table 3. Regions activated during the presentation phase in control > stroke subjects (random effects model)
Number Region side number of
voxels
x y z t 1 Inferior Frontal Gyrus,
Brodmann area 45
right 430 38 28 6 11.3
2 Putamen right 1'984 29 -8 0 12.8
3 Medial Globus Pallidus right 132 17 -8 -6 10.3 4 Thalamus, Medial Dorsal
Nucleus
right 98 5 -11 9 10.6
5 Cerebellum, Anterior Lobe right 2'756 17 -44 -15 11.2 6 Insula, Brodmann area 13 left 375 -34 -2 15 11.0 7 Precentral Gyrus,
Brodmann area 44
left 68 -55 10 9 9.72
8 Inferior Frontal Gyrus, Brodmann area 46
left 603 -49 28 15 10.9 9 Thalamus, Ventral Lateral
Nucleus
left 471 -10 -11 9 11.4 10 Cerebellum, Anterior Lobe left 2363 -22 -41 -15 11.2
11 Pons left 169 -4 -23 -24 10.1
Table 4. Regions activated by smiley feedback in controls > stroke subjects (random effects model)
Number Region side number of
voxels
x y z t
1 Putamen right 322 29 -14 0 6.7
8 2 Cerebellum, Anterior Lobe right 2278 22 -41 -15 7.6 4
3 Putamen right 282 23 13 9 7.0
0 4 Cerebellum, Anterior Lobe left 898 -25 -44 -15 7.3 6
Figure Legends
Figure 1. Stroke subjects remember card combinations less than controls. (A) The percentage of trials in which subjects gave the same response to a card combination like in a previous trial in which the same combination was rewarded („same response after smiley“ – SAS), relative to all smiley trials (SAS + „opposite response after smiley“, OAS) was higher in control than in stroke subjects. The difference was most pronounced for card combinations with high predictive value (92% sun and rain). (B) The percentage of trials for which subjects responded with „sun“ – the optimal response (=“correct response“) – increases in control more than in stroke patients during training over 150 trials. (C) No differences between stroke and control subjects were found for negative feedback, i.e. the “opposite after frowney-index” (OAF/OAF+SAF).
Figure 2. For presentation (seeing the card combination until pressing the response button), the differences in brain activation between groups (control > stroke subjects) are found in areas involved in reward processing, working memory and motivation (compare Table 3).
Figure 3. For smiley feedback (pressing the response button until seeing the next card combination, trials in which smileys were shown), the differences in brain activation between groups (control > stroke subjects) are found in areas involved in reward processing and motivation (compare Table 4).
Figure 4 Lesion overlay of fMRI subsample of stroke patients (A) The degree of overlap (number of lesions overlapping) is color-coded from violet (n=1) to red (n=max. number of subjects). The same slice positions are presented as in Figures 2 and 3. Talairach y-coordinates of the coronal sections are provided. Subtraction plot of poor learners minus good learners (B) Lesion differences between good and poor learners are illustrated by a color-coding the frequency (in percent) by which an area is more frequently lesioned in poor compared to good learners. Poor learners were defined as those patients memory index were one standard deviation below the mean of control sample. Talairach z-coordinates of the axial sections are indicated.