NBER WORKING PAPER SERIES
THE U.S. LEFT BEHIND:
THE RISE OF IPO ACTIVITY AROUND THE WORLD
Craig Doidge
G. Andrew Karolyi
René M. Stulz
Working Paper 16916
http://www.nber.org/papers/w16916
NATIONAL BUREAU OF ECONOMIC RESEARCH
1050 Massachusetts Avenue
Cambridge, MA 02138
March 2011
Doidge is at the Rotman School of Management, University of Toronto. Karolyi is at the Johnson
Graduate School of Management, Cornell University. Stulz is at the Fisher College of Business, Ohio
State University, ECGI, and NBER. Taylor Nadauld and Rose Liao provided excellent research assistance.
Doidge thanks the Social Sciences and Humanities Research Council of Canada for financial support.
The views expressed herein are those of the authors and do not necessarily reflect the views of the
National Bureau of Economic Research.
NBER working papers are circulated for discussion and comment purposes. They have not been
peer-reviewed or been subject to the review by the NBER Board of Directors that accompanies official
NBER publications.
© 2011 by Craig Doidge, G. Andrew Karolyi, and René M. Stulz. All rights reserved. Short sections
of text, not to exceed two paragraphs, may be quoted without explicit permission provided that full
The U.S. Left Behind: The Rise of IPO Activity Around the World
Craig Doidge, G. Andrew Karolyi, and René M. Stulz
NBER Working Paper No. 16916
March 2011
JEL No. F3,G3
ABSTRACT
During the past two decades, there has been a dramatic change in IPO activity around the world. Though
vibrant IPO activity, attributed to better institutions and governance, used to be a strength of the U.S.,
it no longer is. IPO activity in the U.S. has fallen compared to the rest of the world and U.S. firms
go public less than expected based on the economic importance of the U.S. In the early 1990s, the
declining U.S. IPO share was due to the extraordinary growth of IPOs in foreign countries; in the 2000s,
however, it is due to higher IPO activity abroad combined with lower IPO activity in the U.S. Global
IPOs, which are IPOs in which some of the proceeds are raised outside the firm’s home country, play
a critical role in the increase in IPO activity outside the U.S. The quality of a country’s institutions
is positively related to its domestic IPO activity and negatively related to its global IPO activity. However,
home country institutions are more important in explaining IPO activity in the 1990s than in the 2000s.
The evidence is consistent with the view that access to global markets helps firms overcome the obstacles
of poor institutions. Finally, we show that the dynamics of global IPO activity and country-level IPO
activity are strongly affected by global factors.
Craig Doidge
University of Toronto
105 St. George St.
Toronto, Ontario M5S 3E6
Canada
G. Andrew Karolyi
Johnson Graduate School of Management
Cornell University
348 Sage Hall
Ithaca, NY 14853
René M. Stulz
The Ohio State University
Fisher College of Business
806A Fisher Hall
2100 Neil Avenue
Columbus, OH 43210-1144
and NBER
It is widely believed that a vibrant market for initial public offerings (IPOs) is an asset of the U.S. Black and Gilson (1998) and many others argue that the existence of such a market plays a critical role in facilitating entrepreneurship and venture capital in the U.S. economy. This view permeates corporate finance textbooks. For example, Megginson and Smart (2009) write: “Given its role in providing capital market access for entrepreneurial growth companies, the U.S. initial public offering market is widely considered a vital economic and financial asset.” The law and finance literature shows that IPO activity depends on country-level laws and governance institutions. It also shows that IPO activity is higher in common law countries compared to countries with other legal origins. From this perspective, IPO activity has been vibrant in the U.S. because of better laws and better governance institutions.
In this paper, we show that there has been a striking evolution over time in IPO activity across countries. We build a comprehensive sample of 29,361 IPOs from 89 countries constituting almost $2.6 trillion (constant 2007 U.S. dollars) of capital raised over 1990 to 2007. Although the worldwide share of IPO activity by U.S. firms still ranks near the top, during the 2000s, U.S. IPOs have not kept up with the economic importance of the U.S. In the 1990s, the yearly average of the number of U.S. IPOs comprised 27% of all IPOs in the world while the U.S. accounted for 27% of world Gross Domestic Product (GDP). Since 2000, the U.S. share of all IPOs has fallen to 12% whereas its share of worldwide GDP has averaged 30%. The average size of a typical IPO in the U.S. is larger than that in the rest of the world so that IPO proceeds may be a more relevant metric. Yet, in the last five years of our sample, IPO proceeds raised by U.S. firms drop to 16.2% of world IPO proceeds, despite the fact that the stock market capitalization of the U.S. relative to that of the world averages 41% during this period.
Some of the decrease in the importance of U.S. IPO activity compared to worldwide IPO activity is due to lower IPO activity by U.S. firms, but much of it is explained by the considerable growth of IPOs in other countries that occurs throughout the sample period. To a large extent, this growth is fueled by the emergence of global IPOs, which include both IPOs in which some of the shares are sold outside the home country of the firm going public, and foreign IPOs in which of all the shares are sold outside the home country. In 2007, proceeds raised in global IPOs accounted for 61% of total IPO proceeds, which is
double the fraction raised in 1990. U.S. firms have never been active participants in the global IPO marketplace. This newer global IPO phenomenon is an important tool linked to the globalization of capital markets.
The law and finance literature that started with La Porta, Lopez-de-Silanes, Shleifer, and Vishny (hereafter LLSV, 1997, 1998) focuses on how differences in countries‟ laws and governance institutions can explain differences in IPO activity across countries. However, these papers study domestic IPO activity in a world with limited financial globalization. Hence, it is an open question as to how IPO activity is related to home country laws and governance in a world with dramatically reduced barriers to international investment and trade in financial services. Indeed, a newer literature, which includes Shleifer and Wolfenzon (hereafter SW, 2002), Doidge, Karolyi, and Stulz (hereafter DKS, 2007), and Stulz (2009) addresses the impact of financial globalization on IPO activity and suggests that home country laws and governance institutions may have opposite effects on domestic compared to global IPOs. That is, global IPOs can be used to overcome the adverse effects of poor home country institutions. In addition, we would expect that home country institutions should be less important in a more global world as firms can benefit from institutions and resources from other countries in their governance, even if they do not go public through a global IPO (Stulz, 1999). For instance, because of globalization, firms that go public in their own country can now use foreign accounting firms, law firms, and investment banks. The IPO literature emphasizes the importance of certification of the issuing firm (Ritter and Welch, 2002) and the use of foreign advisers and monitors can help certify the quality of the issuing firm in a more credible way than local advisers and monitors. We would expect the effect of globalization to be more powerful in the second half of our sample period and hence expect that home country laws and governance institutions are less relevant in the 2000s compared to the 1990s.
We investigate three separate questions to try to understand cross-country IPO activity around the world, its evolution over time, and the role of financial globalization. First, our sample makes it possible for us to conduct a comprehensive analysis of the role of country institutions for the cross-country
2000s, so that we can examine whether the role of institutions has changed over time as the world became more financially globalized. Finally, we investigate the relation between global IPO activity by firms from a country and the institutions of that country, expecting that global IPO activity will be negatively related to a country‟s laws and governance.
There are many theories of the decision to go public (see Ritter, 2003 for a review), but most of these theories ignore differences in laws and governance across countries. SW (2002) provide the archetypal model of how a country‟s laws and governance affect the benefits and costs of going public for the owners of firms and hence affect the likelihood that a firm will go public in a given country. In their model, the problem for public firms is that the controlling shareholder can extract private benefits at the expense of minority shareholders. However, minority shareholders buy shares at the IPO at fair value so that any expected private benefit consumption reduces IPO proceeds. At one extreme, laws and governance are so poor that any money provided by outside shareholders is consumed in private benefits. In such a situation, no IPO is possible. At the other extreme, if laws and their enforcement are so strong that no private benefits are consumed, firms that go public have high values and all entrepreneurs with positive NPV projects can go public. In reality, countries are between these extremes. Private benefits are lower in countries with good laws and good governance, so that in these countries the equity of firms is worth more and more firms benefit from going public.
Stulz (2009) adds an intermediate period to the SW model, where the entrepreneur has information that outside shareholders do not have about whether it makes sense to continue undertaking the firm‟s project. The entrepreneur benefits from continuing the project even when its NPV has become negative because he can extract private benefits upon completion of the project. Because of this problem, firms raise less capital at the IPO unless they find ways to credibly commit to continuing the project only if it has a positive NPV. Stulz shows that a credible disclosure commitment can perform that role, but that laws must make it possible for outside shareholders to act if the news disclosed is adverse about the project.
We test these predictions from the SW (2002) and Stulz (2009) models using several different country-level proxies for laws, governance, and disclosure (hereafter “institutions”). Countries with better institutions have more domestic IPO activity, measured as either the annual number of domestic IPOs scaled by the lagged number of domestic listed firms or as the annual proceeds raised in domestic IPOs scaled by lagged GDP. Firms can supplement country institutions through commitments to firm-level governance. DKS (2007) show that firms‟ investments in corporate governance depend critically on a country‟s economic development, financial development, and openness. When economic and financial development is high, investment in governance is cheaper and more effective, so that a country‟s institutions are less important. We account for a country‟s per capita GDP, stock market capitalization to GDP ratio, and stock market turnover to measure the level of economic and financial development. Our results hold after controlling for these measures of economic and financial development.
The free flow of capital globally allows firms to raise funds publicly outside their country of domicile. By all measures, finance became much more global when one compares the 2000s before the global financial crisis of 2008-2009 to the 1980s. In the 1980s, many countries with viable stock markets were actually closed to capital flows (see Karolyi and Stulz, 2003). Very few of these countries were still closed or had substantial obstacles to capital flows in the 2000s. In the models of DKS (2007) and Stulz (2009), financial market globalization allows firms to borrow the institutions of foreign countries. Firms from countries with weaker institutions should benefit more because they can raise capital on better terms. Therefore, we expect that such firms are more likely to go public with a global IPO and to raise more proceeds in foreign markets. Measuring annual global IPO activity by firms in a given country as either the number of global IPOs to the total number of IPOs or as global IPO proceeds to total IPO proceeds, we find strong support for the prediction that countries with weaker institutions have more global IPO activity. These findings are robust to controlling for other important determinants of IPO activity.
The importance of home country institutions for the extent of IPO activity can change over time with improved technology and with growing financial globalization. The models of SW (2002) and DKS
institutions for domestic IPO activity will diminish in importance. Specifically, DKS predict that the role of institutions for IPO activity, conditional on the level of financial and economic development, is lower when global markets are more accessible. To test this prediction, we compare the impact of the national institutions variables on IPO activity in the 1990s and the 2000s. The institutions of the country in which a firm is located are less important for explaining domestic IPO activity in the 2000s compared to the 1990s. For instance, while common law countries have significantly more IPO activity in the 1990s than other countries, they do not in the 2000s. We also offer some evidence that home country institutions became a less important factor for the decision to pursue a global IPO in the 2000s when global markets became more accessible for more firms from many more countries. But these results are weaker than those for domestic IPO activity.
The literature on time-series variation in IPO activity focuses mostly on changes in growth opportunities and market conditions. Ritter‟s (2003) survey points out that extreme swings in the volume of IPOs are of considerable interest and that the volume seems to be “hypersensitive to changes in market conditions” (p. 293). Lowry (2003) addresses why IPO volume fluctuates so much and concludes that changes in aggregate capital demands of private firms and in investor optimism are the primary determinants. Pagano, Panetta, and Zingales (1998) find that, for a sample of Italian IPOs, the predominant reason firms go public is to rebalance their capital structure and to exploit mispricing, rather than to raise capital for financing investments. Loughran and Ritter (1995) also find support for the market timing explanation for U.S. IPOs, while Henderson, Jegadeesh, and Weisbach (2006) find similar results internationally. To capture changing local and global market conditions, we control for country-level Tobin‟s q (adjusted by the industry composition in that country), a global measure of q, as well as domestic and global world IPO factors.
Our tests and findings are new, but our effort is related to and adds to several recent papers. First, LLSV (1997), La Porta, Lopez-de-Silanes, and Shleifer (hereafter LLS, 2006), and Djankov, La Porta, Lopez-de-Silanes, and Shleifer (hereafter DLLS, 2008) show that legal protections for minority investors through rules and enforcement, as well as securities laws mandating disclosure and facilitating private
enforcement, are associated with more IPO activity (on average, between 1996 and 2000). We use their legal protection and securities law measures, but we also capture the important dynamics of IPO activity over time in conjunction with changing investment opportunities and with financial globalization, especially in the 2000s. Further, we distinguish between domestic and global IPOs. Kim and Weisbach (2008) use a broad sample of 17,226 IPOs from 38 countries to examine firms‟ motives for going public. They find that IPO proceeds are predominantly used to finance investments and that there are few differences in the use of IPO proceeds between firms in common law and civil law countries. Caglio, Weiss Hanley, and Marietta-Westberg (2010) show that global IPOs account for a significant fraction of total IPO proceeds. They show that characteristics of firms that choose a global offer are different from those that choose a domestic offer and that global IPOs originate from countries with lower bond and stock market development.
The remainder of this paper is organized as follows. Section I describes our data and calibrates it with other databases on IPO activity around the world. Section II provides a number of new empirical facts about how cross-country IPO activity is changing over time. We then evaluate in a panel framework how important institutions, financial and economic development, and market conditions are for the variation in domestic IPO activity in Section III. Financial globalization and the role of institutions in influencing the expansion of foreign and global IPOs are examined in Section IV. Conclusions follow.
I. The IPO sample and country-level data.
A. IPO data.
We obtain IPO data from the Securities Data Company‟s (SDC) Global New Issues Database. For each IPO, this database provides information on the issuer, the issue date, total proceeds, the number and type of shares offered, the offer price, whether the issue is domestic only or contains an international tranche, and whether or not a tranche is offered to public or private investors. We begin by downloading all transactions in SDC where the IPO flag is set to “yes.” Because SDC has very limited coverage for
The initial count is 38,724 observations. We eliminate transactions with a single domestic tranche that SDC flags as a private placement (57 observations). There are 526 cases where there is more than one transaction reported in SDC for the same firm within a narrow window of time. Many of these are global IPOs where the domestic and international tranches have different issue dates, usually within a few days of each other. We drop 235 observations with a gap of 30 days or more between issue dates. Following Kim and Weisbach (2008), we remove 48 transactions that do not contain any information on proceeds raised. The data for some IPOs is recorded over multiple lines in SDC, even if there is only one tranche in the offering. We consolidate these issues into one line and drop 1,347 observations. Some foreign, and all global offers, are also recorded over multiple lines in SDC. We consolidate that information into one line and drop the 3,638 duplicate records. We also drop 93 transactions that do not have SIC codes, leaving us with 33,306 observations, each of which represents a unique IPO.
To construct our final sample, we exclude an additional 3,945 IPOs. We drop 3,856 IPOs by REITs and investment funds, 44 IPOs where the country of origin has no data (more details below, but they include tax havens like the British Virgin Islands, Cayman Islands, etc.), and 45 IPOs from 16 countries for which there were no domestic IPOs (only global IPOs) during the 18-year sample period.1,2 The final sample contains 29,361 IPOs from 89 different countries of which 24,122 are purely domestic and 5,239 are foreign only (international offerings with no domestic tranche) and global offers (both domestic and foreign tranches included).
We perform two experiments to lend assurance that our SDC sample is a reliable representation of IPO activity around the world. In one experiment, we collected data from the World Federation of Stock Exchanges (WFE). Each year, the WFE surveys their member, affiliate, and correspondent exchanges on a wide range of statistics, including what they call “investment flows”. This includes new companies that list and the new capital that they raise via shares. The WFE provides a list of definitions and calculation methods that the exchanges must follow to increase the comparability of the information across
1 The following SIC codes were used to screen out REITs and investment funds: 6722, 6722, 6726, 6798, and 6799. 2 Countries with no domestic IPOs are: Angola, Barbados, Cambodia, Dominican Republic, Faroe Islands, Georgia,
exchanges (see www.world-exchanges.org/statistics). We obtained this data for 2001 through 2005 for each country and compared it with our IPO counts and proceeds totals from SDC. The general finding is that SDC and WFE have comparable coverage and reporting for many countries. North American and U.K. totals are close, as are those for most Asian countries, such as Singapore, China, and Hong Kong. There are patterns of SDC under-reporting of counts and proceeds in Australia, India, Italy, Spain, Sweden, and Switzerland. Of course, there may be good reasons for these differences, such as the inclusion of investment funds and REITs in the WFE samples. Additional complications arise in the WFE‟s data with the consolidation of exchanges, such as NYSE Euronext and OMX Nasdaq, as they centralize their reporting relationship with the WFE. The WFE does not report the composition of IPOs by type.
We also collected IPO data from Bloomberg and from the home-market exchanges for four randomly chosen countries (Brazil, Canada, Germany, and Malaysia) from the early 1980s through 2007. In each case, we also obtained information on domestic and foreign IPOs, but only by counts not proceeds. For Germany from 1997 to the present, the SDC counts are almost identical to those reported by the Deutsche Börse on their website. Those for Bloomberg are higher (about 50% discrepancy on average); they report more than double the count in 2005-2006 relative to the Deutsche Börse and SDC.3 For Malaysia, the IPO counts in Bloomberg are very similar to those from the Bursa Malaysia website and SDC (less than 5% discrepancy on average). The WFE reports a much higher count for Brazil‟s Bovespa than Bloomberg and SDC, though the latter two are similar (about 30% discrepancy on average). Finally, for Canada, the Bloomberg counts are on average 40% lower than for SDC which are, in turn, about 20% higher than those reported to the WFE. The biggest count discrepancies occur during 2000 and 2001.
3 Each of the 81 German IPOs listed in Bloomberg in 2005 were manually checked and several firms (e.g.,
Bertelsmann, IC Immobilien, Marenave Schiffahrts, and Qsil) were not on the Deutsche Börse website. These firms had announced plans to do an IPO, but subsequently announced that they would defer the IPO due to restructuring
B. Country level data.
In our regressions, the dependent variable is a measure of IPO activity. For each country, each year, we compute the number of IPOs (“IPO counts”) as well as the total proceeds raised in IPOs (“IPO proceeds”). To compute the IPO counts and proceeds, we distinguish between domestic IPOs and global IPOs. To benchmark IPO activity across countries that differ in size, we scale the IPO counts and proceeds raised each year by the lagged number of publicly-listed domestic companies and by lagged GDP, respectively, in the country of domicile. These data are obtained from the World Bank‟s World Development Indicators (WDI) Database. Listed domestic companies include domestically incorporated companies listed on the country‟s stock exchanges at the end of the year and do not include investment companies, mutual funds, REITs or other collective investment vehicles. GDP is reported in current U.S. dollars converted from domestic currencies using the end-of-year official exchange rate for that country.
An important set of data in our work are country-specific institutional variables related to the quality of investor legal protections and securities laws related to disclosure requirements and enforcement standards. From LLSV (1998), it is well-known that common law countries have better institutions. We therefore use the common law dummy introduced by LLSV (1998) and extended in DLLS (2008). It equals one if the origin of commercial law in a country is English common law, and zero, otherwise (“Common law”). A popular index of legal protections for minority investors is the anti-director rights index (“Anti-director”) of LLSV (1998) and updated and revised by DLLS (2008) based on laws that apply to firms in 2003. The index is formed on a six-point scale based on a set of variables meant to capture the stance of corporate law towards shareholder protection.4 DLLS (2008) build an index of anti-self-dealing (“Anti-self dealing”) to address the ways in which the law deals with corporate anti-self-dealing in a more theoretically grounded way. It is assembled by means of a 2003 survey of Lex Mundi law firms in 72 countries and includes components related to ex ante private control of self-dealing, such as disclosures that counterparties in a transaction must disclose before approval is granted by disinterested
4 Spamann (2010) also re-codes the original anti-director rights index used in LLSV (1998). He does not report data
shareholders as well as similar ex post disclosures (such as access to evidence) for independent reviews of transactions after completion toward possible rescission or follow-on suits.
LLS (2006) show that securities laws that mandate prospectus disclosure and prospectus liability benefit stock market development, including the breadth, size, and liquidity of the market. They devise measures based on a survey of attorneys in 49 countries in 2000. These measures are especially useful for our study as they relate closely to the security issuance process in IPOs. They build a disclosure requirements index (“Disclosure”) with components related to requirements for prospectuses, and for providing information on compensation of directors and key officers, the issuer‟s ownership structure, related-party transactions with directors, officers or large blockholders, and the presence of contracts outside the ordinary course of business. The liability standard index (“Burden of proof”) comprises measures of four liability standards in cases against issuers and directors, distributors, and accountants. The index of public enforcement (“Public enforcement”) is based on five broad aspects of public enforcement: the basic characteristics of the supervisory body for securities markets, the scope of its powers to regulate markets, its investigative powers, its power to issue noncriminal sanctions for violations of securities laws against issuers distributors, and accountants, and whether, to whom, and when criminal sanctions for violations of securities laws apply. Finally, LLS build an all-encompassing investor protection index (“Investor protection”) which is the first principal component of the burden of proof, disclosure, and the anti-director rights index from LLSV (1998).
We also include a measure of the rule of law (“Rule of law”) from the World Bank‟s World Governance Indicators database5 and political risk (“Political risk”) from the International Country Risk Guide (ICRG) database built by The PRS Group, Inc. In contrast to the LLSV and DLLS variables, these variables are measured every year. The former captures perceptions of the extent to which agents have confidence in and abide by rules related to contract enforcement, property rights, the police and the courts as well as likelihood of crime and violence. It is based on a survey of public and private sector experts and is available for over 200 countries since 1996, including annually from 2002. The political risk
variable from ICRG includes components related to government stability, socioeconomic conditions, internal and external conflicts, corruption, law and order, democratic accountability and bureaucratic quality. It is scored on a 100-point scale and is available annually from 1990. This political risk variable serves as a proxy for the quality of country governance. To the extent that countries with high political risk are countries where public firms are more at risk of predation from the state (Stulz, 2005), we would expect IPO activity to be weaker in such countries.
A key mechanism through which poor institutions limit IPO activity in the literature we have discussed is that they require more co-investment by insiders at the IPO. Consequently, we would expect fewer IPOs in countries where ownership is optimally more concentrated. We use a measure of ownership concentration (“Ownership”) from LLSV (1998), which is computed as the average percentage of shares owned by the top three shareholders in the 10 largest, nonfinancial, private domestic firms in a country.
In our regressions, we also include measures of development. To measure the level of economic development in the country, we use the log of GDP per capita (“Log(GDP / capita)”). This variable is obtained from the WDI Database. For measures of financial market development, we use the 2008 update of the Financial Development and Structure database, originally used in Beck, Demirgüç-Kunt, and Levine (2000). We collect data for the stock market turnover ratio (“Market turnover”, the ratio of the value of total shares traded to average real market capitalization) and stock market capitalization as a percentage of GDP (“Market cap / GDP”, the value of listed shares to GDP).
To control for local market conditions as a factor in the going-public decision, we compute a country-level measure of Tobin‟s q each year. At the firm level, q is computed from data obtained from Thomson Reuter‟s Worldscope database as follows: the numerator is total assets less the book value of equity plus the market value of equity. For the denominator, we use the book value of total assets. All variables are in local currency. Using the Fama-French 17 industry classification scheme, we compute the median q and relative market value for each industry annually. The country-level measure of q (“Country q”) is the market value weighted average of the median industry qs. This measure is constructed analogously to the local growth opportunities (LGO) measure based on P/E ratios used in Bekaert, Harvey, Lundblad, and
Siegel (2007). To control for global growth opportunities, we also construct a global measure of q
(“Global q”). Each year we compute the median q and the relative market value for each global industry (includes all firms worldwide in that industry). Global q is the market value weighted average of the global median industry qs. This measure is the parallel to Bekaert et al.‟s global growth opportunities (GGO) measure.
Finally, to control for unobservable global macroeconomic and capital market factors that influence IPO activity around the world, we construct a world IPO factor. It is computed separately for domestic IPOs (“World domestic IPO rate”) and global IPOs (“World global IPO rate”) and is measured either in terms of IPO counts per listed firms or in terms of IPO proceeds per GDP. Each year, total world IPO counts (proceeds) are summed across countries and scaled by the lagged total number of listed firms worldwide (lagged total GDP). To compute the world IPO rate for a given country, the IPO activity and the scale factor (either number of listed firms or GDP) of that country is excluded.
Summary statistics, including means, standard deviations, and correlations among these measures are provided in Appendix A.
II. The rise of the IPO abroad and the fall of the IPO in the U.S.
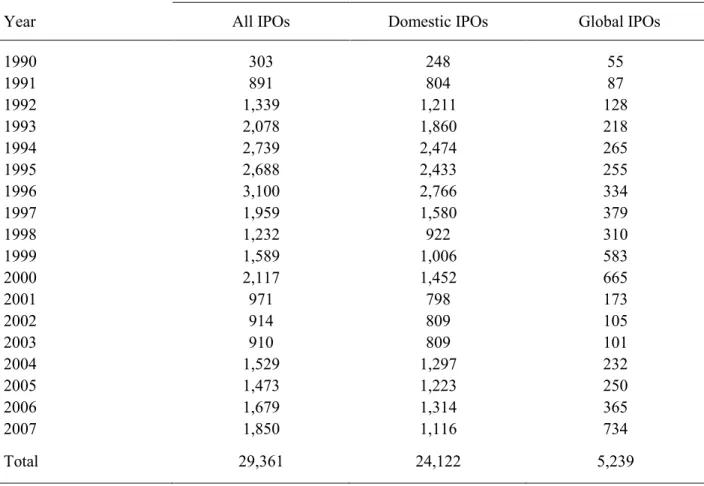
Table 1, Panel a presents the total number of IPOs and breaks it down by domestic IPOs and global IPOs by year. Annual IPO counts increased from less than 1,000 in the early 1990s to a peak of 3,100 in 1996. They fell after 1996 before reaching another peak of 2,117 in 2000. The counts fall below 1,000 for three years after 2000 before increasing again steadily to reach 1,850 in 2007. Panel a also shows that the rise and fall in annual counts until 2003 occurs for both domestic and global IPOs. The surge in overall counts after 2003 is much more dramatic for global offers. For domestic IPOs, 2007 does not exceed the earlier peaks, while the count for global IPOs in 2007 is higher than any other year in the sample period. Generally, there is more variation in global IPOs. From the peak in 2000 to the trough in 2003, global IPOs fall by 84%; in contrast, domestic IPOs fall by only 44%.
The results for IPO proceeds are presented in Table 1, Panel b. We obtain proceeds in U.S. dollars from SDC and convert them into constant 2007 values using U.S. inflation rates from the World Bank‟s WDI database. This panel shows that total annual IPO proceeds rise during the 1990s to reach a peak of $240 billion in 2000. Annual proceeds decline to $59 billion by 2003 and then rise again, reaching a peak of almost $280 billion in 2007. Domestic IPO proceeds are less volatile over the period, so that changes in annual proceeds from global IPOs are the more important factor in the steady rise of total IPO proceeds during the 1990s and especially in the rapid expansion after 2003, reaching $189 billion in 2007. Indeed, total proceeds raised in global IPOs account for almost 68% of all IPO proceeds in 2007. Global IPOs include a domestic tranche and international tranches. The last column of Panel b shows proceeds raised in the international tranches of global IPOs. As a percentage of total proceeds raised in global IPOs, proceeds raised in international tranches have increased over the 2000s, reaching a peak of 90% in 2007.
There are some important differences in the evolution of counts and proceeds in both domestic and global IPOs. In the 1990s, there is a dramatic increase in counts that is driven by an increase in domestic IPOs. The number of domestic IPOs peaks in 1996 and does not come close to that peak again in subsequent years. In fact, after 2000, the count never exceeds even half the peak reached in 1996. In contrast, however, domestic IPOs proceeds have elevated values in the mid-1990s, but the proceeds raised in 2006 dwarf those of earlier years. There is a steady increase in the number of global IPOs until 2000. The count then drops, but increases again after 2003 and peaks in 2007. Proceeds raised in global IPOs increase throughout the 1990s to reach a peak in 2000, collapse to a trough in 2003, and then increase sharply to reach the peak of 2000 again in 2007, although the percentage of global IPO proceeds raised in international tranches is much higher in 2007 compared to 2000. In summary, before the 2008-2009 financial crisis, global IPOs matched their previous peak of 2000. Domestic IPO counts did not match their previous peak of 1996, but domestic IPO proceeds are the highest in our sample in 2006.
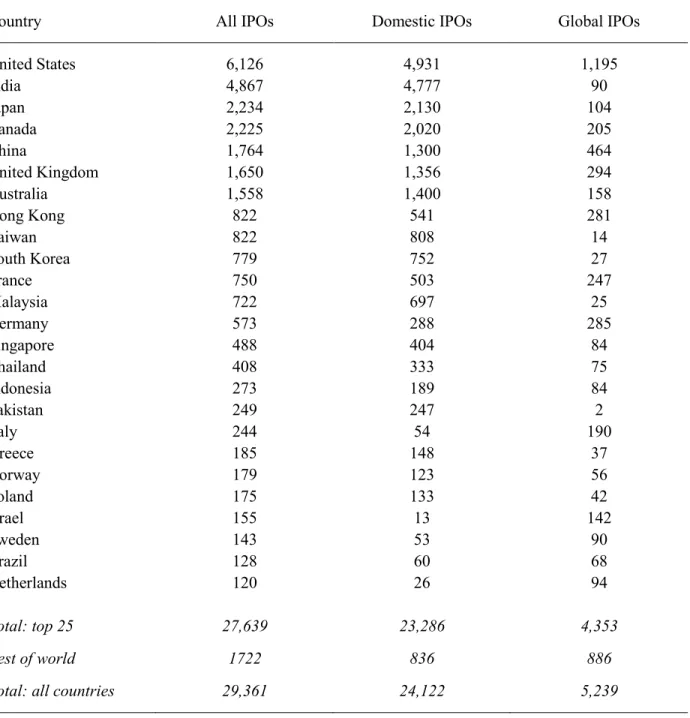
The cross-country pattern in annual IPO counts is exhibited in Table 2, Panel a. Developed countries with the largest economies and capital markets in the world, such as the U.S. (6,126 IPOs), Japan (2,234), Canada (2,225), U.K. (1,650), Australia (1,558), and Hong Kong (822), have high overall counts, but a
number of emerging countries such as India (4,867), China (1,764), Taiwan (822), and South Korea (779), have high counts as well. Fifteen countries are in the top twenty-five countries both for counts and proceeds. Panel b shows that the U.S. total of $648 billion constitutes almost 25% of the total worldwide IPO proceeds of $2.55 trillion. The other major markets include China ($254 billion, 10%), Japan ($204 billion, 9%), U.K. ($196 billion, 8%), and are followed by France (5%), Germany (4%), Canada (3%), and Italy (3%). However, some countries that are in the top 25 for counts are not in the top 25 for proceeds (Greece, Israel, Malaysia, Pakistan, and Poland), whereas some countries are in the top 25 for proceeds but not for counts (Bermuda, Mexico, Russia, Spain, and Switzerland).
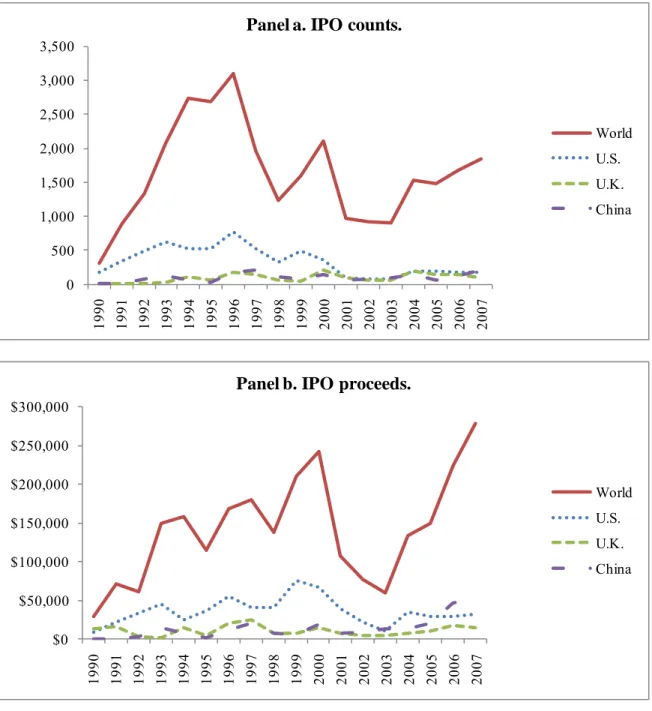
The country-by-country averages hide dramatic changes in the frequency of IPOs across countries. In addition to showing the counts for all IPOs across the world, Figure 1 shows the counts for the U.S., the U.K., and China (Panel a). The U.S. dominates the U.K. and China in counts until 2001 when the counts are roughly the same and stay that way to the end of the sample period. The U.S. counts peaked in 1996, but the number of U.S. IPOs has been small compared to that peak since 2001. If at one point the U.S. was the “land of the IPO,” it is not in the 2000s if one focuses on IPO counts. One way to see this is that the U.S. share of total IPO counts exceeds 20% in each of the first ten years of the sample except for 1994 when it is 19%. It never exceeds 13% after 2001. In the 1990s, the U.S. share of total IPO counts towers over the share of the U.K. and China, as each country‟s share is below 10% each year in the 1990s. Though the shares of these countries increase in the 2000s, the U.S. share stops towering over their shares, mostly because the U.S. share is so much lower in the 2000s. Though we do not show this on the figure, Japan, Australia, Taiwan, and Korea all experienced substantial increases in counts as well.
There has also been a dramatic shift in the composition of IPO proceeds over the past two decades. The U.S. share of total IPO proceeds has declined from about 30% in the 1990s to only 21% in the 2000s (through 2007, at least). Japan and the U.K. have also experienced a decline from 10% to 6% and from 9% to 6%, respectively. Among the other large markets, no major shift in market share arises (e.g., Canada, France, Italy, and Germany), except for China which more than doubles from a 6% to 14% share
($182 billion out of the $1.29 trillion). In 2006 and 2007, China‟s total IPO proceeds actually exceed those of the U.S. (see Panel b).
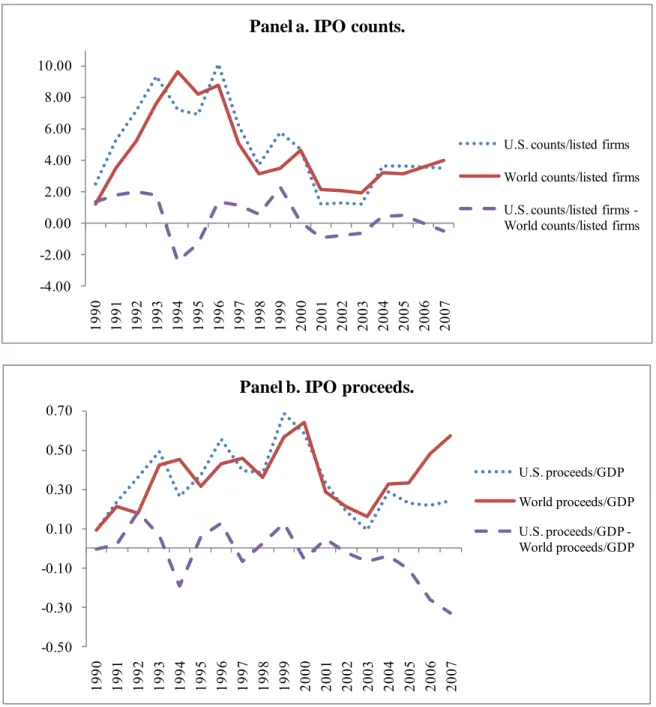
The decreased importance of U.S. IPOs occurs at different times for counts versus proceeds. The share of U.S. counts in world IPO counts decreases sharply until 1994. After that year, it increases until 1999 and then collapses starting in 2000. It stays steadily low in the 2000s. In contrast, U.S. IPO proceeds mostly follow the world‟s proceeds until 2003, when the world IPO proceeds take off and the U.S. IPO proceeds do not. One useful way to compare patterns in counts and proceeds for the U.S. and the world is to benchmark them relative to the number of listed firms and GDP, respectively. Figure 2 summarizes this evidence. It reports the ratio of IPO counts to the number of domestic listed firms (Panel a) and the ratio of IPO proceeds to GDP (Panel b) for the both the U.S. and for the world. It also reports the difference between the U.S. and the World. The U.S. tends to have higher values than the world, but not consistently, until 1999. After 2003 the ratios for the world increase while the ratios for the U.S. stagnate. If the importance of IPOs in the U.S. relative to the economic importance of the U.S. relative to the world were unchanged, we would expect these ratios to stay constant. Instead, we see that the ratios fall over time, so that the importance of IPOs in the U.S. relative to the world has not kept up with the economic importance of the U.S.
Figure 3 performs a different benchmark analysis for the U.S. by computing its share of IPO counts and proceeds relative to that of the world over time. The statistics are reported separately for all IPOs, domestic IPOs only, global IPOs only, and also for the global component of global IPOs for the analysis based on proceeds. We observe a steady decline in the U.S. share of IPO counts (Panel a) regardless of the type of IPO. For the U.S. share of the world‟s IPO proceeds (Panel b), we see that the decline arises primarily from the share of global IPO proceeds from around 10% in the 1990s to a negligible fraction after 2001. In fact, the U.S. holds a steady fraction of domestic IPO proceeds around 35% over these two decades.
The evidence in this section shows that IPOs in the rest of the world have become much more important and IPOs in the U.S. have become less important. One possible explanation could be that
foreign countries became more like the U.S., so that their IPO rates have become more similar to U.S. IPO rates. With this explanation, the characteristics of the U.S. that made it a country where IPOs were much more important than in the rest of the world became adopted by other countries, so that the U.S. is no longer unusual. Another explanation, however, is that countries have become less important because firms wanting to pursue IPOs have found ways to avoid being hindered by institutional obstacles. For instance, firms can use global markets to go public and avoid the constraints of their home country. In the next section, we explore the importance of country characteristics as determinants of IPO activity. In Section IV, we address the role of global IPOs.
III. Do national institutions and market conditions matter for IPO activity around the world?
In order to assess the importance of national institutions, like corporate laws, securities laws, their enforcement, and measures of political risk, as well as market conditions, such as equity valuations in a country, we need to benchmark IPO activity in terms of both counts and proceeds relative to the extent of potential activity. The literature has employed different approaches to gauge this potential activity. Previous work on IPO activity in a country in terms of counts has been benchmarked relative to the population in a given country (LLSV, 1997) and the number of listed companies on the major exchanges (DLLS, 2008). We choose to use the latter. IPO activity in terms of the proceeds of equity issued by newly listed firms in a country has been benchmarked relative to its GDP by LLS (2006) and DLLS (2008) and relative to the total assets of the firms involved in raising capital (Kim and Weisbach, 2008). We choose to use the former.
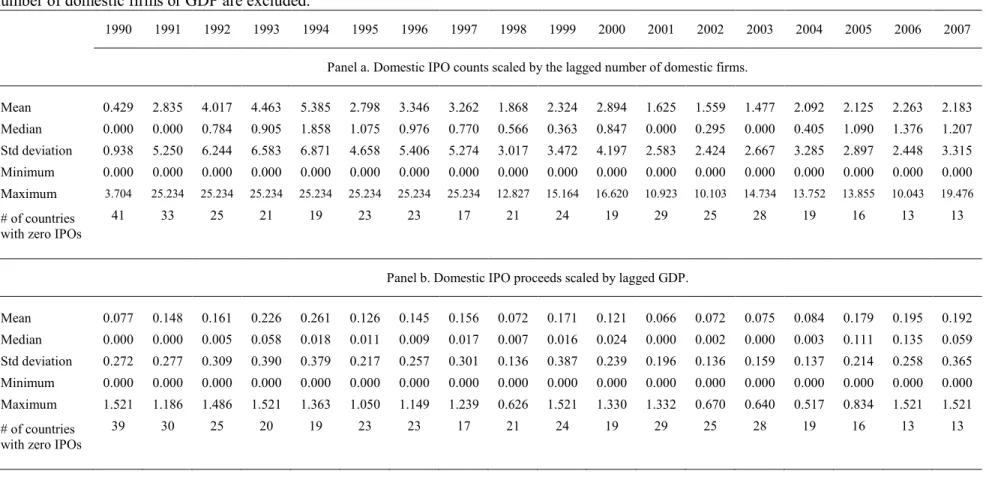
Table 3 presents summary statistics by year for domestic IPO counts as a fraction of the previous year‟s number of domestic listed firms (Panel a) and for domestic IPO proceeds as a fraction of the previous year‟s GDP in millions of U.S. dollars (Panel b). Domestic IPO proceeds include proceeds from domestic IPOs only. We multiply both ratios by 100 and winsorize them at the 1% and 99% thresholds. We restrict the analysis to the subset of countries used in Tables 1 and 2 to those that have sufficient data
on changing market conditions that we include in our regressions below.6 IPO activity by counts ranges from a low of 0.43% of listed firms in 1990 to as high as 5.38% in 1994. These are means across countries and it should be noted that there is significant dispersion in activity across countries by year and, moreover, that the number of countries with non-zero IPO counts changes over time. Fewer countries have no IPOs when IPO markets are hot around the world than when they are cold. Specifically, the number of countries that have no IPOs in a year is negatively correlated with the worldwide average of IPOs per number of listed firms.7 This evidence suggests that global market conditions play an important role in IPO activity at the country level. We will provide more such evidence in regressions that analyze the country-level IPO rate.
In Panel b, domestic IPO proceeds as a fraction of GDP ranges from as low as 0.08% in 1990 to as high as 0.26% in 1994. The time-variation in IPO proceeds across years follows closely the pattern in counts per number of listed firms, but not perfectly. This fact implies that there are interesting differences in the offering sizes of IPOs across years, part of which stem from the types of firms that go public and part of which stem from the countries of domicile that dominate IPO activity in those years. It is useful to point out that the range of this fraction is limited by the fact that proceeds (in billions of U.S. dollars) are typically small relative to the GDP of a country (also, in billions of U.S. dollars) even if scaled by 100. In particular, the maximum fraction of IPO proceeds never exceeds 2% in any year. Again, there is a large fraction of countries that are counted in these means by year for which there are no IPO proceeds.
A. The role of changing investment opportunities and market conditions.
Everything else being equal, we would expect to see more IPOs in countries with better growth opportunities, with more economic development, and with higher financial development. We include log(GDP / capita), market cap / GDP, and market turnover as measures of the level of economic and
6 An important control variable in our subsequent analysis is country q for which we require that a country have this
data available for at least one year to qualify for the summary statistics in Table 3. This restriction eliminates 35 countries (which together constitute only 300 IPOs out of our total sample of 24,122) leaving 54 countries.
7 We tested whether this relationship is statistically reliable using Tobit regressions of the percentage of countries
with non-zero counts or proceeds on the mean IPO rate across countries by count or proceeds, respectively. There is a statistically significant negative coefficient for the proceeds relationship (coefficient of -1.30, t-statistic of -2.66) and a negative, but insignificant, coefficient for the same by counts.
financial market development, and lagged country q as a measure of corporate valuations in the country. Further, the world domestic IPO rate is included to control for unobservable global macroeconomic and capital market factors that influence IPO activity around the world. Each of these variables is lagged by one year. Lagging these variables is especially important for market capitalization and turnover since these variables would be directly affected by IPO activity. We estimate this specification as a panel regression using ordinary least squares allowing the standard errors to be clustered by country.
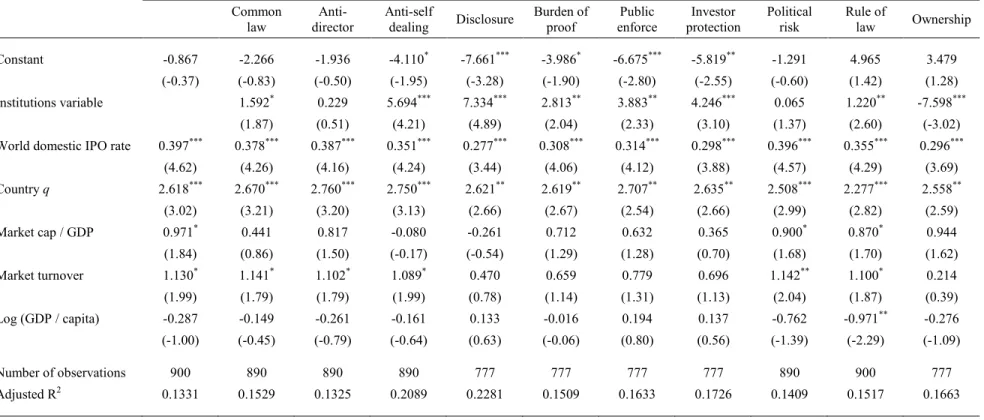
Table 4 presents the estimates for regressions that project measures of domestic IPO activity on domestic economic and financial variables as well as domestic IPO activity outside the country. The first specification in Panel a uses domestic IPO counts normalized by the lagged number of listed firms as the measure of IPO activity and the first specification in Panel b uses domestic IPO proceeds relative to lagged GDP.
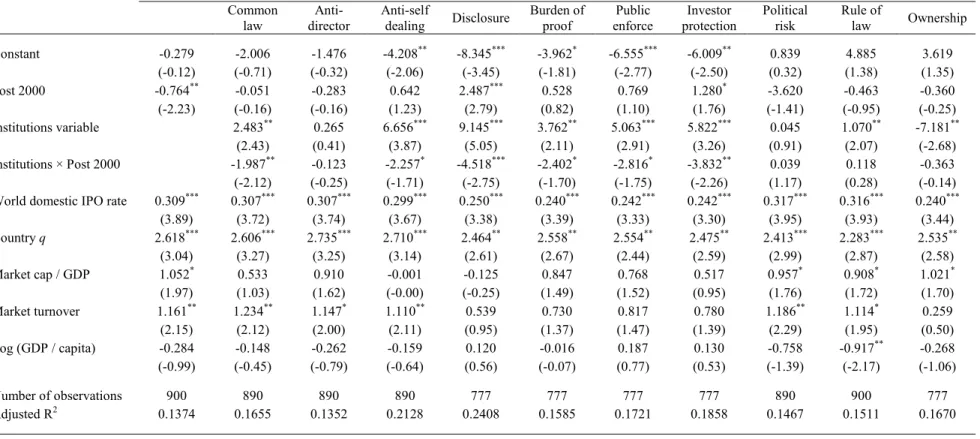
In Panel a for domestic IPO counts, the first important finding is that the world domestic IPO rate is a reliably positive and economically important factor. The coefficient of 0.397 implies that a one standard deviation increase in the world IPO activity rate (2.25%) is associated with a 0.89% increase in the IPO activity rate for a given country, or about 20.3% of its standard deviation. This is a sizeable source of common variation in IPO activity around the world. We performed several robustness checks to confirm the reliability of this result. Another statistically reliable coefficient is that for country q. The economic magnitude of that relationship is only slightly smaller than that of the world factor. Its coefficient of 2.618 implies that a one standard deviation increase in q (0.32%) is associated with a 0.84% increase in IPO activity rate, which constitutes 19% of its standard deviation. The coefficients on market cap / GDP and market turnover are positive as expected but these coefficients are only significant at the 10% level (the coefficients on the world IPO rate and country q are significant at the 1% level). Log(GDP / capita) has a negative coefficient but it is not significant. The explanatory power of this specification is 13.3%.8
8 We performed some residual diagnostics for the base specifications in both panels of Table 4. There is evidence of
significant positive skewness (coefficient of 2.15) in the residuals. In Panel a for counts, the largest negative residuals were around -7.31 whereas the largest positive residuals were around 20.9 given a mean residual of -0.80.
The first column in Panel b presents the results of the same base regression for domestic IPO proceeds normalized by lagged GDP. The results are similar to those for counts. The world domestic IPO rate factor (excluding the country of interest) is reliably positive. Its coefficient of 0.511 implies that a one standard deviation increase in the world IPO activity rate is association with an increase of 0.029%, which constitutes about 10.4% of its standard deviation.9 In this specification, the coefficient on the country q is also positive, statistically reliable, and has a larger economic magnitude corresponding to about 19% of the standard deviation of the IPO activity rate in proceeds. The coefficient on market turnover is positive but is not significant, while that for market cap / GDP is significant at the 1% level. The explanatory power of this base specification is 10.8%.
In supplementary, unreported regressions, we estimated specifications with annual U.S. dollar-denominated national index returns in excess of the Datastream World Index instead of country q. The coefficient was reliably positive yielding similar explanatory power. We also estimated specifications with and without log(GDP / capita) without much consequence. Further, we found that expanding the panel to include countries with no IPO activity during the 18-year horizon leads to similar conclusions. The next question we pursue is whether measures of the quality of national institutions can explain how domestic IPO activity differs across countries beyond these factors that relate to market conditions and the level of capital market and economic development.
B. National laws and governance institutions and domestic IPO activity.
In both panels of Table 4, the remaining specifications for the panel regressions of domestic IPO activity include one of a variety of country-level measures of laws and governance institutions. We include these variables one at a time, but have also estimated in unreported specifications various
Panel b for proceeds is similar with excess positive skewness (coefficient of 2.73) and kurtosis (coefficient of 12.71), but the ranges of extreme values for the residuals are much smaller. Later, we report on supplementary tests dealing with concerns about censored samples using Tobit regression analysis.
9 We conducted a principal components analysis (PCA) of the first several principal components of IPO activity
rates (for IPO proceeds as a fraction of GDP). The proportion of total variation across countries and years explained by the first PC was 9.61%, which is very close to the economic magnitudes we uncovered above. The second PC explained another 6.65%, the third PC, another 5.03% and the first five PCs together cumulatively explained 31.8%. These proportions were stable across different subperiods.
combinations of them. We should also state from the outset that our analysis below for domestic IPO proceeds as a fraction of GDP is robust to including domestic proceeds from global IPOs in the numerator.
In general, we find that the better is the quality of the national institutions in a country, the higher is the level of domestic IPO activity. In the second column of each panel, the addition of the common law dummy variable adds explanatory power to the base model, especially for the analysis of proceeds in Panel b (the adjusted R2 increases from 10.8% to 14.4%). The coefficient is weakly positive with a value of 1.59% for domestic IPO counts as a fraction of the number of listed firms and reliably positive with a value of 0.11% for domestic IPO proceeds as a fraction of GDP. LLSV (1997) find similar results using counts of IPOs per millions in population for a two-year period, 1995-1996. In contrast to their approach, we use a panel regression and account for country and world market conditions. The positive coefficient on anti-director rights is insignificant for both the IPO count and proceeds regressions and the adjusted R2 actually declines with its inclusion. In LLSV (1997, Table VI), the coefficient on the original anti-director rights index is reliably positive for their IPO counts regressions, but in LLS (2006, Table III), it is similarly insignificant when they measure IPO proceeds relative to GDP (for 1996 to 2000), like we do in Panel b. The anti-self-dealing index from DLLS (2008) is positive and reliably significant in both panels. For IPO counts, the coefficient of 5.69 implies that a one standard deviation higher score in anti-self-dealing (say, from that of Switzerland to Canada) is associated with an increase of 1.31%, or 31% of its standard deviation. The economic magnitude of this variable is similar for IPO proceeds. The adjusted R2 increases substantially to 20.9% (from 13.3% in the base specification) in Panel a and to 18.9% (from 10.8%) in Panel b.10
The next regressions include the securities laws measures developed in LLS (2006). We include the indexes for disclosure, burden of proof, public enforcement, and investor protection. LLS (2006) show these variables separately and together to be statistically and economically important for explaining IPO
10 In Table 6 of DLLS (2008), the anti-self-dealing variable has a reliably positive coefficient of 4.14 for their
activity measured by proceeds for the high IPO activity period of 1996-2000 (their Tables III and V). We similarly find that the coefficients on these variables are important for both IPO counts and proceeds. For example, disclosure has a coefficient of 7.334 (robust t-statistic of 4.89) in Panel a for IPO counts; this implies that a one standard deviation higher score (say, from that of Turkey to Spain) is associated with a 1.54% higher rate of IPOs to the number of listed companies, which represents about 35% of its standard deviation. The adjusted R2 for this specification in Panel a is 22.8% (from 13.3% in the base specification). The results for the public enforcement, burden of proof, and investor protection indexes are similarly reliable statistically and large economically. That the results for the disclosure index are particularly strong is important support for the key prediction in Stulz (2009) where credible disclosure commitment ex ante and ex post by means of strong securities laws is critical for the entrepreneur to maximize offering proceeds.
We obtain similar, but distinctly weaker, results for several of the other national institutions proxy variables we consider. Stulz (2005) argues that an entrepreneur has an incentive to not go public in countries were the state is predatory since it is easier for the state to prey on public companies as more information is available about them. We find no evidence to support this prediction in terms of IPO counts or proceeds. We also examine a measure of the rule of law. There is evidence of a positive relationship, but it is more reliable for IPO counts (coefficient of 1.22 with t-statistic of 2.60) than proceeds (only weakly significant) and, even then, the economic magnitude of the relationship is smaller than the LLS (2006) securities laws variables. Finally, we evaluate a measure of ownership concentration that a number of the theoretical models we work from associate with stronger laws and governance institutions. SW (2002) predict lower concentration of ownership in countries with better investor protections and Stulz (2005) associates this outcome with a less predatory government. In LLSV (1998), LLS (2006), and DLLS (2008), lower ownership concentration (computed as the stake of the top three shareholders in the largest 10 firms in a country) is associated with common law origins and higher scores on the anti-director rights, anti-self dealing, disclosure, burden of proof, and public enforcement indexes. We find that ownership is reliably negatively related to domestic IPO activity by counts and by proceeds.
There are several potential concerns with the regressions of Table 4. First, institutions could change because of a demand for IPOs, so that the quality of institutions in a country could be endogenous to IPO activity that takes place there. This concern is not plausible with the common law dummy. Yet, we find evidence of an association of common law with IPO frequency. The concern is possibly more acute with some of the other national institutions variables, such as the anti-self dealing index. In tests not reported in a table, we estimated instrumental variables regression models in which the national institutions variables were instrumented with the common law indicator variable.11 The resulting regressions lead to similar conclusions as the regressions that we report. Second, institutions affect financial and economic development. Consequently, we might be understating the influence of institutions. We estimated our regressions without the financial and economic development variables. The results are unchanged. Finally, one might be concerned that the dependent variable is censored at zero. We re-estimated our regressions using a Tobit regression model. The results in these regressions are often stronger than those reported in the table.
We saw in Section II that the landscape of IPO activity changes dramatically during our sample period. In particular, the relative importance of U.S. IPOs and non-U.S. IPOs switched. The changes we discussed in Section II raise the question of whether the relation between IPO activity and institutions is stable through time and holds up with the rapid globalization of financial markets and with the rise of IPO activity all around the world. As explained in the introduction, there are good reasons to believe that globalization decreases the importance of national institutions.
C. Comparing domestic IPO activity during the 1990s and 2000s.
Table 5 presents panel regression results that are similar to those of Table 4, except that we introduce a dummy variable that allows for a shift in the level of domestic IPO activity for the post-2000 period. This dummy variable is also allowed to interact with the national institutions variables. In Panel a, we
11 DLLS (2008) use legal origins as an instrument for legal rules in a similar two-stage estimation procedure where
the second stage explained financial development, such as IPO activity. In a survey by LLS (2008, pp. 293-294), the authors argue that such two-stage procedures are not recommended, however, since legal origins influence a broad range of rules and regulations and researchers cannot guarantee that the relevant ones are not omitted in the first
present the results for IPO counts as a fraction of the domestic number of listings and, in Panel b, for IPO proceeds as a fraction of GDP. We also investigated, but do not report, specifications in which we estimate the panel specifications separately for the two decades, an approach which allows the coefficients of the base variables in the model, such as country q, market turnover, and the world domestic IPO rate, to shift. Although there is some evidence of changes in the coefficients of the base variables between the 1990s and the 2000s, our results about the change in the importance of institutions hold equally well for both approaches.12
In the first specification, the coefficient on the Post-2000 dummy variable is reliably negative for domestic IPO counts (Panel a) and proceeds (Panel b). This is not surprising given the trends uncovered in Table 3, where the peak rates of domestic IPO activity were revealed in the 1992-1994 period. When we allow the Post-2000 dummy variable to interact with the national institutions variables, we confirm that this observation holds true: the negative coefficient on the Post-2000 dummy variable itself disappears (sometimes becomes positive), the positive coefficients on the national institutions variables remain so for the 1990s, but are negative and reliably so, when interacting with the Post-2000 dummy. In other words, the strong positive association we uncovered between domestic IPO activity rates and national institutions proxy variables earlier arises from the relationship in the 1990s. It is weaker both statistically and economically in the 2000s.
This weakening of the relationships in the 2000s arises for just about every national institutions proxy variable that we study. In the specifications for the common law dummy variable, the reliably positive coefficient implies a 2.48% higher rate of IPO counts per listed firm, but it is juxtaposed with a similarly significant, negative coefficient for the Post-2000 interaction variable, which implies a much smaller 0.49% higher rate for the 2000s. Not surprisingly, if we estimate a regression for the 2000s only, the common law dummy is not significant. A similar shift obtains for IPO proceeds in the equivalent
12 In the base model of Table 5, Panel a, for example, the coefficient on country q remains positive though it is
smaller in magnitude and loses its statistical significance. The coefficient on market cap / GDP is statistically significant in both periods, though smaller in magnitude in the 2000s, whereas that on market turnover is virtually unchanged.
specification in Panel b. An important implication of this finding is that the economic magnitudes of these relationships in the 1990s were even stronger than we realized in the previous section. Consider the positive and statistically significant coefficients for the anti-self-dealing index from DLLS (2008) that arise for the domestic IPO counts and proceeds regressions in both panels. In Panel a of Table 5, the coefficient for IPO counts of 6.566 (previously 5.694) implies that a one standard deviation higher score in the anti-self-dealing variable is associated with an increase of 1.58%, or 50% of its standard deviation, in the 1990s. The equivalent coefficient for the 2000s of 4.399 (6.656 less 2.257) implies an increase of only 1.04%, or 20% of its standard deviation.
Similar changes in the relationship across the 1990s and 2000s arise for the disclosure, burden of proof, public enforcement, and investor protection indexes from LLS (2006). Our findings are distinctly weaker for the anti-director rights and political risk variables, neither of which was reliably significant in the full sample regressions in Table 4. The ownership variable had a negative coefficient in Table 4 since it is negatively related to the strength of institutions; consequently, we would expect a positive coefficient on the interaction if the relation between ownership concentration and IPO activity weakened during the 2000s. We find no evidence in support of that prediction in Table 5a and only weak evidence in Table 5b.
The adjusted R2‟s in the specifications with the Post-2000 dummy variable and the interactions are typically higher, which suggests that capturing these changes in the role of institutions is important. At the same time, however, if we estimate regressions separately for the 1990s and 2000s, we find (not tabulated) that the regressions have more explanatory power in the 1990s than in the 2000s. Part of the story is that the unconditional variation in domestic IPO activity rates is considerably higher in the 2000s. The standard deviation of domestic IPO counts across countries and years rises from 3.03% to 5.19%.
It is interesting to note that the countries that were most important for IPO activity in the 1990s lost importance in the 2000s. The countries that were predominant in the 1990s, such as the U.K., U.S., Singapore, Australia, and Hong Kong, ceded substantial IPO share to a number of new countries with sizeable IPO activity in the 2000s, but with typically poorer institutions. This change in relative IPO
institutions remained as important, regressions using the 1990s data would predict that the countries that gained prominence in IPO activity in the 2000s would not have done so.
Each of the theories we outlined in the introduction predicts a weakening role for national institutions for domestic IPO activity that we observe. Recall from SW (2002) that firms are larger, more valuable, and greater in number with higher dividends and less diversion of profits if legal protections are better. An important corollary of their model, however, is that more open capital markets are associated with greater IPO activity in a given country and that any differences in investor protection laws across countries will diminish in importance. More open markets enable firms to take advantage of financial development, the economic development, and the institutions of foreign countries (see, among others, Coffee, 1999; Stulz, 1999; Doidge, Karolyi, and Stulz, 2007; and Stulz, 2009). In the next section we provide further evidence in support of these theories. We uncover a negative empirical association between the rates of global IPO activity around the world and the national institutions proxy variables. That is, countries with weaker institutions have higher rates of global IPO activity.
IV. The consequences of financial globalization for global IPO activity around the world.
Our evidence in Section II shows that IPOs in the rest of the world have become much more important and IPOs in the U.S. have become much less important. We have further revealed in Section III that a country‟s national institutions, whether corporate laws, securities laws, disclosure rules, or their enforcement in general, have become a less important factor for the extent of domestic IPO activity. One possible explanation is that countries‟ national institutions have become less important because firms wanting to pursue IPOs have found ever increasingly more ways made available by financial globalization to avoid being hindered by institutional obstacles. These firms have gained greater and more advantageous access to global markets for their shares irrespective of the institutions of their country of domicile. For instance, firms can use global markets to go public to avoid being constrained by their home country. Indeed, firms in many countries are pursuing IPOs in foreign markets or, at least, they are
including foreign tranches in global IPOs. Is this pursuit related to the quality of national institutions? Is there evidence that this relationship is changing over time?
A. Understanding global IPO activity.
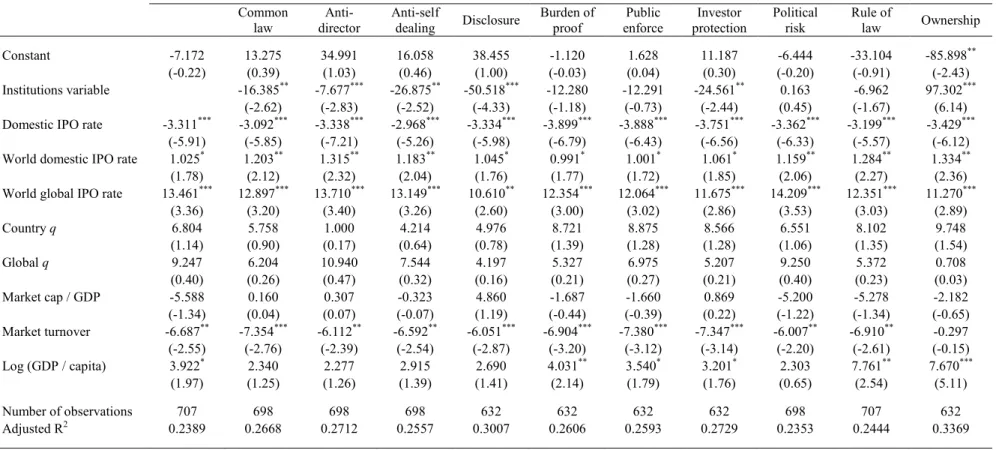
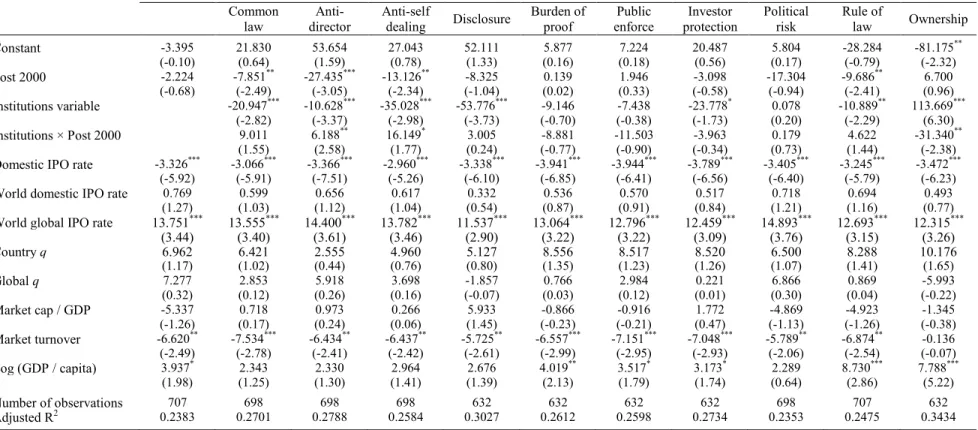
In Table 6, we report the results of panel regressions that are similar to those of Table 5, except that our variable of interest is not domestic IPO counts and proceeds, but global IPO counts and proceeds. Global counts include foreign IPOs as well as global IPOs with a domestic and international tranche. Unlike our earlier analysis, these counts are deflated by the total number of IPOs, including both domestic and global IPOs, so we are evaluating how intensively the firms in a country pursue global opportunities. Global IPO proceeds include the U.S. dollar proceeds of the foreign IPOs as well as those from the international tranches of global IPOs (the proceeds assigned to the domestic tranche are excluded). Global IPO proceeds are deflated by total IPO proceeds, including domestic and global, so again we study the intensity of the pursuit of capital raising activity outside the home country. If firms from a given country do not have any IPOs in a given year, the global IPO variables are set to missing.
We include in the base specifications several additional factors to account for the changing global economic and capital market environment. As before, it is important to control for the level of worldwide global IPO activity in order to isolate the factors that influence the unique country-level global IPO activity. However, we also want to control for the level of domestic IPO activity in the country in order to capture the extent to which the pursuit of global IPOs is a substitute or a complement activity. Slower domestic IPO activity may be associated with an increase in the intensity of global IPO activity because of the constraints imposed on emerging firms by the existence of weak national institutions at home or simply better capital-raising opportunities elsewhere. But relatively underdeveloped capital markets at home may just as easily impose capacity constraints on the demands of capital-hungry firms such that high domestic IPO and global IPO activity arise together. We compute the world global IPO rate measured in terms of global IPO counts per listed firms or of global IPO proceeds per GDP. The world domestic IPO rate is also included as is the actual domestic IPO activity rate in the country of interest
(i.e., the dependent variable in Table 4). To avoid possibly spurious findings, these variables are lagged by one year, as are all other control variables.
To capture the influence of differences in local country-specific growth opportunities and global growth opportunities, we include country q and global q in our regressions. These variables will be correlated, but we will interpret the coefficient on the global q ratio as a measure of growth opportunities that is independent of a country‟s institutions.13
In the regressions exhibited in the first columns of Panel a for global IPO counts and of Panel b for global IPO proceeds, we find that the coefficient on the global IPO factor is reliably positive and economically large. This is what we would expect to observe if there are important macroeconomic cyclical factors as well as common long-term secular forces of deregulation and liberalization of capital markets that influence global IPO activity across all markets. In Panel a, the coefficient of 13.461 implies that a one standard deviation increase in global IPO activity worldwide is associated with a 5.47% increase in global IPO counts in a country, which represents 14% of the standard deviation of global IPO activity. The equivalent coefficient for global IPO proceeds in Panel b is also significant and economically large. We also find reliable evidence that the level of domestic IPO activity is negatively related to the fraction of IPO counts and proceeds that are global. The economic importance of this relationship is even larger. For counts in Panel a, the coefficient on the domestic IPO rate is -3.311 which implies that a one standard deviation increase in domestic IPO counts per listed companies is associated with a 14.6% decrease in the fraction of IPOs that are global, which is about 38% of the standard deviation of global IPO activity. The economic importance of the negative influence of domestic IPO activity by proceeds is much smaller. We also find that market turnover is negatively related to the intensity of global IPO activity by counts and proceeds. Both of these are reliable indicators that robust
13 This is similar in spirit to the GEGO measure in Bekaert, Harvey, Lundblad, and Siegel (2007) which is defined as
the difference between the country‟s growth opportunities (GGO, measured with value-weighted global industry P/E ratios using local country value weightings) and world growth opportunities (WGO, as before but with global value weightings). We do not difference our measures, but leave them to be estimated separately. In some robustness tests, we obtained Bekaert et al.‟s actual GEGO measures directly through 2005 and confirmed (at least for our global proceeds regressions) the robustness of our main findings on national institutions to this alternative measure. We thank S