CAN THE COSTS OF THE
WORLD HEALTH ORGANIZATION
ANTENATAL CARE PROGRAMME
BE PREDICTED IN .
DEVELOPING COUNTRIES?
Guy Hutton
Thesis for the submission of a PhD
Abstract
The aims of this thesis are to identify and test alternative methods for analysing and predicting health care costs, to construct
a
framework for guiding analysts in making better cost predictions, and to identify future areas of research in this area. The thesis uses costs collected from a multi-country trial measuring the cost-effectiveness of an evidence-based programme of antenatal care. Detailed costing studies of maternity services (antenatal care, childbirth and postpartum care) were done in two trial countries (Cuba and Thailand), and also a nontrial country, South Africa.Costs are broken down and reviewed by cost components: prices, resource use, and health service use. The review initially considers the application of economic theory to public health care institutions, to identify factors likely to cause cost variation between setting. Then the review seeks empirical evidence proving or disproving the existence of these factors from the health care literature, as well as a review of the methods for analysing health care costs.
The empirical analysis first compares health service use, unit costs and cost per pregnancy between settings (between: women with different case-mix, health facilities, trial arms and 'study countries) and examines the causes of variation, before testing alternative cost prediction methods. Variations in unit cost are found to be due to several factors, including different levels of resource productivity, occupancy levels, staffing patterns, prices and exchange rates (between country), input mix and health facility size. Also, uncertainty and measurement error are considered likely to cause some variation in unit costs. Variations in health service use are due to case-mix, clinical practice, and accessibility differences. Again, not all variation is explained. Finally, a range of different cost predictions methods are tested, and their results compared with observed costs in each country. The most accurate cost prediction method is to build costs based on expected changes in resource use, health service use and morbidity rates (called the incremental cost impact approach). The direct and adjusted cross-country transfer methods (transfering costs between countries), although accurate on occasions, are less
Methodological issues and policy implications in relation to cost prediction and generalisability are discussed, including the choice of cost-prediction approach, the valuation methods (opportunity cost and currency conversion methods for cross-country predictions), the measures used for comparing the performance of cost prediction methods, and the limitations· of cost analyses to understand costs. It was concluded that caution is needed in predicting costs both within study countries due to cost variability, and in lower-resourced settings where u,nit costs and health service use are lower. Further cost analyses and testing of cost prediction methods are needed in other areas of health care to compare with the results from this thesis, and build a fuller picture of cost behaviour as well as strengths and weaknesses of alternative cost prediction methods.
Table of contents
1 INTRODUCTION •••••.••••••••••••••••••••••••••••••••••••••••••••...•..••.•..••••.•••••••••••••• r i ••• : •••••••••••••••••••••••••••••••••••••• 16
1.1 Background ... 16
1.2 Cost information in decision making ... 17
1.2.1 Why are costs important? ... ; ... 17
1.2.2 Types of cost ... 18
1.3 Cost predictions ... 21
1.3.1 What is a cost prediction? ... 21
1.3.2 The need for predicting cost. ... 22
1.3.3 Problems arising when not using primary data sources ... 23
1.3.4 Ways of advancing the field of cost generalisability ... 25
1.4 Thesis aims and outline ... ; ... 28
1.4.1 Thesis aim ... ,~ .. ; ... 28
1.4.2 Thesis outline ... ; ... ~ ... 29
2 HEALTH CARE COSTS: FOUNDATIONS IN ECONOMIC THEORY ... 33
2.1 Introduction ... ~ ... 33
2.2 The production of health care ... 33
2.2.1 Choosing 'output' in health sector analysis ... 33
2.2.2 The aim of production ... 34
2.2.3 Technical efficiency ... 36
2.2.4 Economic efficiency ... , ... 38
2.2.5 Cost curves ... 39
2.3 Breakdown of neoclassical assumptions ... 44
2.3.1 Profit-maximising behaviour ... 44
2.3.2 Price-taking ... .45
2.3.3 Factor markets are competitive ... .46
2.3.4 Homogenous output ... .46
2.3.5 Perfect information ... .47
2.3.6 Barriers to entry and exit ... .48
2.3.7 Public good characteristics ... .48
2.3.8 Conclusions ... .48
2.4 Implications for analysing cost variation ... 49
3 METHODS FOR EXPLAINING COST BEHAVIOUR ••.••••••••••••••••.•••••••••••••••••••••••••••••••••••••••••••••••••••••••.• 52 3.1 Introduction ... 52
3.2 Accounting methods ...•... 53
3.2.1 Introduction ... 53
3.2.2 Cross-setting data substitution ... 54
3.2.3 Resource and cost profiles ... 55
3.2.4 Efficiency scores ... 56 3.2.5 2-way relationships ... ~ ... .59 3.2.6 Output profiles ... 60 3.2.7 Conclusions ... 61 3.3 Statistical methods ... 64 3.3.1 Regression analysis ... 64
3.3.2 Data envelopment analysis ... 68
3.4 Comparison of methods and conclusions ... 71
4 CAUSES OF COST VARIATION ••••••••••••••••••••••••••••••.••••••••••••••••••••••••••••.•••••••••••••••••••••.•••••••••••••••.•••••• 75 4.1 Introduction ... 75
4.2 Health service use ... 76
4.2.1 Patient factors ... 76
4.2.2 Provider factors ... 78
4.3 Resource use ... 79
4.3.1 X-efficiency ... 80
4.3.2 Returns to the variable factor ... 81
4.3.3 Economies of scale ... 83
4.4 Resource price ... 87
4.4.1 Absolute price ... 87
4.4.2 Relative price ... : ... 88
4.5 Costing methods ... " •.. : ... 88
4.6 Uncertainty ... 90
4.7 Implications for cost prediction methods ... 91
5 CONTEXT AND METHODS .•••••••••••••.•.•••••.••• · •••••••••.•.•.•.••••••..•••••••••••••••••••••••.•••••••••••••••••••••••••••••••.•••• 96
5.1 The WH.O. antenatal care trial ... 96
5.2 Aim and objectives of empirical study ... 98
5.3 Methods of data collection and cost estimation ... 100
5.3.1 Overview of data requirements and data sources ... : ... 100
5.3.2 Health service use data sources ... 101
5.3.3 Unit cost estimation ... ; ... 102
5.3.4 Cost per pregnancy estimation ... ::: ... ; ... 107
5.3.5 Health service performance and description ... 108
5.3.6' Project management ... : ... 108
5.4 Analysis of robustness of costs ... 108
5.4.1 Uncertainty in health service use ... 109
5.4.2 Uncertainty in unit costs ... 1 09 5.5 Analysis of cost variation ... 111
5.5.1 Levels of cost variation ... : ... .111
5.5.2 'Significant' variation ... 113
5.5.3 Analysis of health service use variation ... 114
5.5.4 Analysis of resource use variation ... 115
5.5.5 Analysis of unit cost variation ... ~ ... 116
5.5.6 Analysis of cost per pregnancy variation ... , ... 117
5.6 Cost prediction ... 123
5.6.1 The incremental cost impact method ... 123
5.6.2 Regression analysis cost predictors ... 124
5.6.3 Direct transfer method ... 124
5.6.4 Adjusted transfer method ... 125
5.6.5 Simplified staff cost method ... 125
6 CAUSES OFV ARIATlON IN 'NATURAL' RESOURCE UNITS •••.••.••••••••.••••••••••.••••••••••••.••••••••••••••.•••. 126 6.1 Causes of variation in health service use ... 126
6.1.1 Variation between trial arms ... 126
6.1.2 Variation between individual health facilities ... 131
6.1.3 Variation between countries ... 135
6.1.4 Conclusions ... ~ ... 139
6.2 Causes of variation in resource use ... 139
6.2.1 Staff ... 140 6.2.2 Equipment ... 145 6.2.3 Drugs ... 147 6.2.4 Materials ... 149 6.2.5 Utilities ... 149 6.2.6 Buildings ... 150
6.2.7 Study limitations and conclusion ... 151
7 CAUSES OF VARIATION IN UNIT COST •••••••••••••...••••••••••.•••••••••••••••••••••••.••.••••••••••••••••••••••••••••••••••. 153
7.1 Unit cost variations within countries ... 153
7.1.1 Outpatient care ... 153
7.1.2 Inpatient care ... 162
7.1.3 Delivery care ... 166
7.1.4 Discussion and conclusions ... 167
7.2 Unit cost variations between countries ... 169
7.2.1 Sizes of cost variation ... 169
7.2.2 The impact of different prices on unit costs ... 171
7.2.3 The impact of different resource quantities on unit costs ... .174
7.2.4 Costing methods and uncertainty ... 178
8 CAUSES OF VARIATION IN COST PER PREGNANCY ... 187
8.1 Size and significance of cost per pregnancy variations ... 187
8.1.1 Cost per pregnancy results ... 187
8.1.2 Impact of uncertainty on cost per pregnancy comparisons ... : .. -' ... 193
8.2 Main causes of cost per pregnancy l'.ariation ... 194
8.2.1 Cost per pregnancy variation between trial arms ... 194
8.2.2 Cost per pregnancy variation between health facilities ... 195
8.2.3 Cost per pregnancy variation between countries ... : ... 198
8.2.4 Conclusion ... 199
8.3 Comparisons between groups of women using 2-way analysis ... 199
8.4 Multiple regression analysis ... 202
8.5 Discussion and conclusion ... ~ ... 211
9 COST PREDICTION ... 214
9.1 Application of the incremental cost impact method ... 214
9.1.1 Predicted changes to implement W.H.O. ANC progranime ... 215
9.1.2 Overall implications for cost per pregnancy ... 219
9.2 Application of cost predictors from regression analysis ... 220
9.2.1 Cost prediction within country using 'average' trial patients ... 220
9.2.2 Cost prediction within country using profiles of women ... 221
9.2.3 Cost prediction between countries ... 223
9.3 Cost prediction results for all methods ... 223
9.3.1 Direct transfer method ... 225
9.3.2 Adjusted transfer method ... 227
9.3.3 Simplified staff cost prediction method ... 228
9.3.4 Incremental cost impact method ... 229
9.3.5 Regression analysis cost predictors ... 229
9.4 Critical evaluation of cost prediction methods and results ... 231
9.4.1 Direct transfer method ... 231
9.4.2 Adjusted transfer method ... 233
9.4.3 Simplified staff cost method ... 235
9.4.4 Incremental cost impact method ... 236
9.4.5 Regression analysis predictors method ... 237
9.5 Interpreting cost prediction results in South Africa ... 240
9.6 Conclusion ... 243
10 DISCUSSION ... 248
10.1 Choices in predicting costs ... 248
10.1.1 Costing boundary ... 249
1 0.1.2 Average or marginal cost ... 249
10.1.3 Measure of central tendency ... 250
10.1.4 Valuation ... 252
10.1.5 Currency conversion ... 253
10.1.6 Sampling and data issues ... 255
10.1.7 Other cost prediction methods ... 256
10.2 Judging performance of cost prediction methods ... 257
10.2.1 Accuracy ... 257
10.2.2 Economic significance ... 259
10.3 Contribution of cost analysis to cost prediction methods ... 261
10.3.1 Contribution of economic theory to understanding costs ... 262
10.3.2 Measuring variation ... 265
10.3.3 Explained and unexplained variation ... 266
10.3.4 Issues in cross-country cost analysis ... 268
10.4 Cost prediction and policy making ... 270
10.4.1 Interpretation of cost results ... 270
10.4.2 Wider implications for trial countries ... 273
10.4.3 Implications for South Africa ... 279
10.4.4 Implications for other countries .; ... 282
11 CONCLUSION ... 287
11.1 Summary of thesis ... 287
LIST OF TABLES
Table 1.1: Factors varying between health care settings that may influence costs ... 25
Table 2.1: Breakdown in assumptions for perfect competition, and implications for cost. ... .49
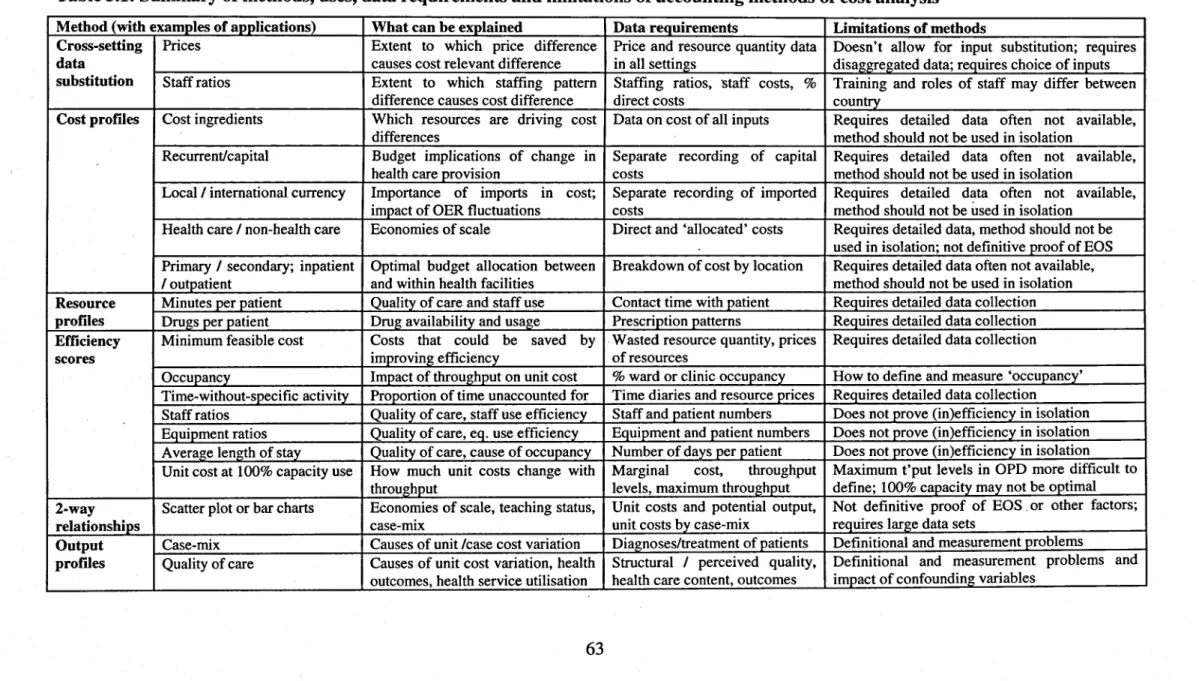
Table 3.1: Summary of characteristics of accounting methods of cost analysis ... 63
Table 5.1: Types of data and sources of data used in the thesis ... 101
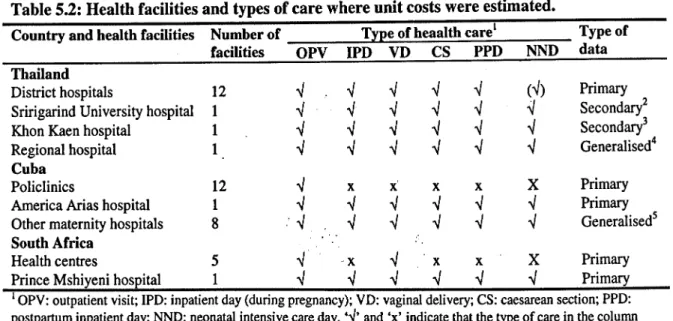
Table 5.2: Health facilities and types of care where unit costs were estimated ... ; ... 103
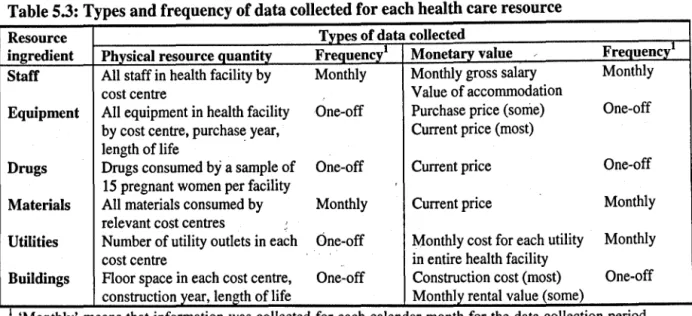
Table 5.3: Type and frequency of data collected for each health care resource ... 104
Table 5.4: Levels of comparison for different cost components ... 112
Table 5.5: Cost analysis methods to analyse variation in physical resource units ... 116
Table 5.6: Impact of hypothesised factors on unit cost and methods for assessment. ... 117
Table 6.1: Outpatient antenatal care visits in Cuba and Thailand ... .127
Table 6.2: Inpatient health service use in study countries ... .128
Table 6.3: Health service use data by health facility; trial arm, and country ... 132
Table 6.4: Assessment of factors explaining health service use variation between country ... 136
Table 6.5: Prescriptions given to sample of pregnant women in Cuba, by policlinic and trial arm ... 148
Table 7.1: Average and marginal costs per ANC visit in Cuba and Thailand ... 154
Table 7.2: Average and marginal costs of inpatient care in study countries ... ; ... 163
Table 7.3: Average and marginal costs of delivery care in study countries ... .167
Table 7.4: Summary of average and marginal costs in all countries ... .169
Table 7.5: Price levels of resources and inter-country price ratios ... 171
Table 7.6: Unit costs of health services and inter-country unit cost ratios ... 172
Table 7.7: Relative prices and staff ratios for selected resources in study countries ... .176
Table 7.8: Impact on average costs of multi-way sensitivity analysis, with AC range and % change ... 184
Table 8.1: Average and marginal cost 'per pregnancy in study countries ... 188
Table 8.2: Cost per pregnancy (average and marginal) using PPP ... 192
Table 8.3: Cost per pregnancy range using results from sensitivity analysis and alternative currency conversion methods ... 193
Table 8.4: Results of final regression model in Cuba ... 202
Table 8.5: Diagnostic tools for regression models for Cuba, Thailand and South Africa ... 203
Table 8.6: Results of final regression model in Thailand ... 206
Table 8.7: Results of final regression model in South Africa ... 208
Table 9.1: Health care changes required from 'old' to 'new' antenatal care programmes ... 216
Table 9.2: Average cost impact for outpatient ANC in study countries ... 218
Table 9.3: Summary of cost impact from W.H.O ANC programme using incremental cost impact method ... 219
Table 9.4: Independent variables explaining cost per pregnancy in study countries ... 221
Table 9.5: Cost prediction for wmen, neonates and providers with different profiles ... 222
Table 9.6: Summary results for all cost prediction methods at nominal exchange rates ... 224
Table 10.1: Criteria for clinic selection for WHO antenatal randomised controlled trial.. ... 278
LIST OF FIGURES Figure 1.1: Relationship between different types of 'cost' ... 20
Figure 2.1: Isoquant map ... 37
Figure 2.2: Isocost line and economic efficiency ... 38
Figure 2.3: Change in isocost line ... 38
Figure 2.4: Short- and long-run isoquants ... 40
Figure 2.5: Cost curves in short-run ... 40
Figure 2.6: Short- and long-run equilibrium points ... .41
Figure 2.7: Total cost curve ... .42
Figure 2.8: Average & marginal cost curves ... .42
Figure 2.9: Returns to scale ... .43
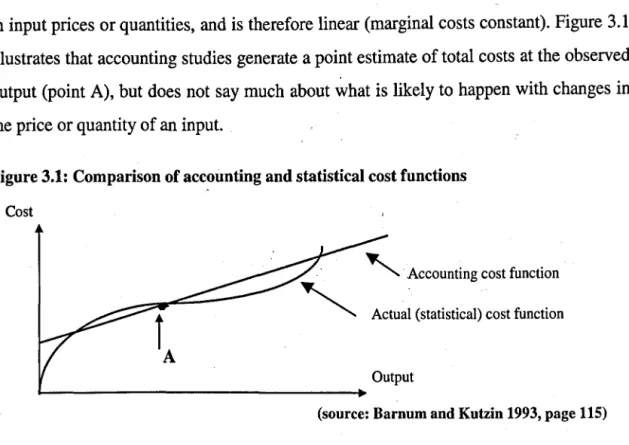
Figure 3.1: Comparison of accounting and statistical cost functions ... 72
Figure 6.1: Antenatal visits per PTE and occupancy in Cuba ... 141
Figure 6.2: Antenatal visits per PTE and occupancy in Thailand ... 142
Figure 6.3: Technical efficiency scores for ANC visits in Thailand ... 144
Figure 6.4: Building space 'productivity' in policlinics in Cuba ... 150
Figure 7.1: Visits per PTE and average costs in Cuba ... 156
Figure 7.3: Correlation between average cost and throughput in Zuluetta policlinic over 8 months
(Cuba) ... 157
Figure 7.4: Average cost and returns to the variable factor for outpatient care in Cuba: ... 158
Figure 7.5: Polclinic size and average cost in Cuba (at 80% capacity) ... ..-. ... 158
Figure 7.6: Days per FIE and average costs in Cuba ... 164
Figure 7.7: Days per FIE and average costs in Thailand ... 165
Figure 7.8: Comparison of selected staff salaries at nominal exchange rates and PPP ... 172
Figure 7.9: Comparison of price ratios and unit cost ratios between country ... 173
Figure 7.10: Impact of uncertainty on unit costs of outpatient antenatal care ... 182
Figure 8.1: Average cost per pregnancy and 95% confidence interval for policlinics in Cuba ... .189
Figure 8.2: Average cost per pregnancy and 95% confidence interval for hospitals in Thailand ... .190
Figure 8.3: Cost per pregnancy and average inpatient stay in Cuba ... 195
Figure 8.4: Cost per pregnancy and ANC visits/cost in Cuba ... 196
Figure 8.5: Cost per pregnancy and average inpatie!lt stay in Thailand ... 197
Figure 8.6: Cost per pregnancy and ANC visits/cost in Thailand ... :" ... 197
Figure 8.7: Cost per pregnancy, health service use and unit costs in control arms in all countries ... .198
LIST OF BOXES Box 1.1 Typology of cost terms used in the thesis ... 19
~J>J>~~I)I~~~
.•..•...•...••...••.••...•...•..•...••...
3~5Appendix 1: Summary of cost analysis literature ... 326
Table 1.1: Regression analyses with total costs as the dependent variable .~ Table 1.2: Regression analyses with average costs as the dependent variable Table 1.3: Regression analyses with case costs as the dependent variable Table 1.4: Data envelopment analysis studies
Table 1.5: Characteristics of regression analysis and data envelopment analysis Table 1.6: Findings of the literature on patients factors affecting health service use
Appendix 2: W.H.O. antenatal care trial clinical component information ... 332 Table 2.1. Study site location and allocation of clinics across sites
Table 2.2: W.H.O. antenatal care programme basic checklist
Table 2.3: Outcomes of the W.H.O. antenatal care randomised controlled trial
Appendix 3: Economic paper for trial ... 339
Appendix 4: W.H.O. antenatal care trial economic evaluation information ... 363 Table 4.1: Calculation of purchasing power parities
Table 4.2: Step-down allocation for calculation of unit costs in Cuban policlinics Table 4.3: Background and tasks of research team members in study countries Table 4.4: Site visit details by UK research team
Table 4.5: Sources of uncertainty and alternative values: Insufficient observations on a parameter Table 4.6: Sources of uncertainty and alternative values: Inaccuracies in recording systems
Table 4.7: Sources of uncertainty and alternative values: Uncertainty over the method to value a parameter Table 4.8: Sources of uncertainty and alternative values: Uncertainty over generalis ability of values across
settings
Table 4.9: Measurement and data sources of patient factors determining health service use Table 4.10: Measurement and data sources of provider factors determining health service use Table 4.11: Risk factors in multiple regression analysis
Table 4.12: Pregnancy and delivery events in multiple regression analysis
Table 4.13: Provider characteristics and women's health service use in multiple regression analysis
Appendix 5: Trial data ... 372
Table 5.1: Assessment off actors explaining health service use variation between trial arm Table 5.2: Case-mix comparison between policlinics and trial arm in Cuba
Table 5.3: Case-mix comparison between hospitals and trial arm in Thailand, and South Africa Table 5.4: Health service use data by health facility, trial arm, and country
Figure 5.1: Distribution of numbers of ANC visits in intervention arm in Cuba Figure 5.2: Distribution of numbers of ANC visits in intervention arm in Thailand
Appendix 6: Staff productivity ... 377
Figure 6.1: Antenatal visits per PTE and occupancy in South Africa. . Figure 6.2: Inpatient days per PTE and occupancy in all countries.
Figure 6.3: Occupancy, average discharges per bed, and average length of stay ('Lasso' graph Table 6.1: Staff, building space, and health service output in Cuban policlinics
Table 6.2: Staff, building space, and health service output in Thai hospitals Table 6.3: Staff, space and output in clinics in South Africa
Table 6.4: Staff, building space, and health service output from referral hospitals in Cuba and South Africa
Appendix 7: Technical efficiency scores from DEA ...•... 383
Figure 7.1: Technical efficiency scores for ANC visits in Cuba. Figure 7.2: Technical efficiency scores for ANC visits in South Africa. Figure 7.3: Technical efficiency scores for wards in Thailand.
Appendix 8: Unit cost deternllnants ... .385
Figure 8.1: Correlation between optimal throughput and % overhead costs in policlinics in Cuba Figure 8.2: Visits per FI'E and average costs in Thailand
Figure 8.3: Average costs and TE scores for outpatient care in Thailand / /
Figure 8.4: Average costs and returns to the variable factor for outpatient care in Thailand Figure 8.5: Hospital clinic size and average cost in Thailand (80% capacity)
Figure 8.6: Visits per PTE and average costs in South Africa
Figure 8.7: Average costs and returns to the variable factor for outpatient care in South Africa Figure 8.8: Average costs and TE scores for inpatient care in Thailand
Figure 8.9: Average costs and returns to the variable factor for inpatient care in Thailand Figure 8.10: Hospital ward sizes and average cost in Thailand (80% capacity)
Figure 8.11: Days per PTE and average costs in South Africa
Figure 8.12: Average costs and returns to the variable factor for inpatient care in South Africa
Appendix 9: Unit cost results from Cuba, Thailand and South Africa ... 391 Table 9.1: Average and marginal costs for outpatient antenatal care.
Table 9.2: Average and marginal costs for inpatient antenatal/postpartum care. Table 9.3: Average and marginal costs for delivery care.
Table 9.4: Ingredients of outpatient antenatal care cost.
Table 9.5: Ingredients of outpatient antenatal/postpartum inpatient cost. Table 9.6: Ingredients of delivery care cost.
Table 9.7: Components of antenatal outpatient cost.
Table 9.8: Components of antenatal/postpartum inpatient cost. Table 9.9: Components of delivery care cost.
Table 9.10: Sensitivity analysis results for changes in prices and length of life of capital items Table 9.11: Sensitivity analysis results for use of pooled drug cost
Table 9.12: Sensitivity analysis results for changes in methodology Table 9.13: Unit cost range taking into account small number of months Figure 9.1 : Average cost per outpatient visit in Cuba
Figure 9.2: Average cost per outpatient visit in Thailand Figure 9.3: Average cost per outpatient visit in South Africa Figure 9.4: Average cost per inpatient day in Cuba
Figure 9.5: Average cost per inpatient day in Thailand Figure 9.6: Average cost per inpatient day in South Africa
Appendix 10: Risk factors for patients in intervention arms in Cuba and Thailand ••••••••••••••••••• 404 Table 10.1: Eligibility for the WHO ANC programme in Cuba - risk factors.
Table 10.2: Eligibility for the WHO ANC programme in Thailand - risk factors.
Appendix 11: Price~ •••.•••••••••••••••••.••••••••••••••••..•.••••••• ••••••••••••••••••••••••••.••••••••••••••.•...•.. 405 Table 11.1: Comparison of resource prices in Cuba, Thailand and South Africa (US .
Appendix 12: Cost per pregnancy results in study countries •••••••••••••••••••••••••••••••••••••••••••••••• 407 Table 12.1: Percent contributors to cost per pregnancy, by type of care and resource ingredient
Table 12.2: US$ contributors to cost per pregnancy, by type of care and resource ingredient.
Appendix 13 Cost per pregnancy and sub-group analysis •••••••••••••••••••••••••••••••••••••.•••••••••••. 409 Table 13.1: Summary of mean differences between categories of women in Cuba
Table 13.2: Summary of mean differences between categories of women in Thailand Table 13.3: Summary of mean differences between categories of women in South Africa Table 13.4: Raw data for mean differences between categories of women in Cuba. Table 13.5: Raw data for mean differences between categories of women in Thailand. Table 13.6: Raw data for mean differences between categories of women in South Africa
Appendix 14 Cost per pregnancy distributions (log and linear) ... 419 Figure 14.1: Cuba control group total cost distribution (cases less than US$2,000) .
Figure 14.2: Cuba intervention group total cost distribution (cases less than US$2,000) Figure 14.3: Cuba control group log cost distribution (all cases) ____ /
Figure 14.4: Cuba intervention group log cost distribution (all cases)
Figure 14.5: Thailand control group total cost distribution (cases less than US$400) Figure 14.6: Thailand intervention group total cost distribution (cases less than US$400) Figure 14.7: Thailand control group log cost distribution (all cases)
Figure 14.8: Thailand intervention group log cost distribution (all cases) Figure 14.9: South Africa total cost distribution (cases less than US$I,OOO) Figure 14.10: South Africa log cost distribution (all cases) ,
Table 14.1: Correlation coefficients between independent variables in Cuban model Table 14.2: Correlation coefficients between independent variables in Thai model
Table 14.2: Correlation coefficients between independent variables in South African model
. . .
Appendix 15 Diagnostic tests for multiple regression analysis •••••••••••••••••••••••••••••••••••••••••••• 427 Figure 15.1: Distribution oflog cost in Cuba
Figure 15.2: Normal P-P plot of regression standardized residuals in Cuba
Figure 15.3: Scatter plot of regression standardized residuals and regression standardized predicted values in Cuba
Figure 15.4: Distribution of log cost in Thailand
Figure 15.5: Normal P-P plot of regression standardized residuals in Thailand
Figure 15.6: Scatter plot of regression standardized residuals and regression standardized predicted values in Thailand
Figure 15.7: Distribution oflog cost in South Africa
Figure 15.8: Normal P-P plot of regression standardized residuals in South Africa
Figure 15.9: Scatter plot of regression standardized residuals and regression standardized predicted values in South Africa
Appendix 16: Cost prediction methods and results •••••••••••••••••••••••••••••••••••••••••••••••••••••••.. 435 Table 16.1: Comparison of antenatal care interventions in Cuba, Thailand, and South Africa, compared
with the new model
Table 16.2: Rates of adverse events or conditions Table 16.3: Cost predictions at nominal exchange rates Table 16.4: Cost predictions at purchasing power parities
Table 16.5: Cost prediction using simplified staff costing method in Cuba Table 16.6: Cost prediction using simplified staff costing method in Thailand
Acknowledgements
First and foremost, I would like to thank my supervisor, Juli~ Fox-Rushbyl. Julia has not only had the unenviable task of reading my work over the last four and a half years, but she has also patiently taught me to be scientifically rigorous in my approach to health economics, and has provided inspiration when it was lacking in me.
I would also like to thank Miranda Mugford2 for her professional management (as grant-holder) of the economic antenatal care project, and for her constant encouragement and her friendship; Anne Millsl and Charles Normandl for providing valuable comments on drafts all the way through the PhD; and Carine Ronsman3 who gave important academic input at the upgrading stage (1995-7). Also, I would like to thank those who provided much needed statistical support: Tom Marshale, James Carpenter4, and Chris Frost4•
A huge thanks goes to my collaborators over the last four years. In Cuba, the economic team was Ana Maria Galvezs, Manuel Alvarez6 and Gicelda Sanabrias; and the W.H.O. trial principal investigator Ubaldo Farnoe. In Thailand, Bandit Thinkhamrop8, Jadsada Thinkhamrop9, Chusri KuchaisitlO; and the WHO trial principal investigator Pisake Lumbiganon9. In South Africa, Noddy Jinabhaill, Joseph Wamukuoll, Chauntelle Bhagwandeen II, and Sam Ross 12. In addition to these collaborators and friends, I would like to thank the W.H.O. antenatal care trial Steering Committee, particularly the trial coordinator Jose Villar, and all others who facilitated or participated in the W.H.O. trial, and made this thesis possible.
A thank you to London School of Hygiene and Tropical Medicine colleagues, particularly staff members and other PhD students in the Health Policy Unit, who have provided support and inspiration over the years.
I would like to thank all those funding bodies that have provided financial support to the W.H.O. trial, most notably the UK Department for International Development who funded the economic study in Cuba, Thailand and South Africa.
A final note of thanks to family and friends who have provided the support and encouragement over the years for me to finish my thesis. A special thank you to my wife, Zsuzsa, for her patience.
1 Department of Public Health and Policy, London School of Hygiene and Tropical Medicine, UK 2 School of Health Policy and Practice, University of East Anglia, UK
3 Maternal and Child Epidemiology Unit, London School of Hygiene and Tropical Medicine, UK 4 Medical Statistics Unit, London School of Hygiene and Tropical Medicine, UK
S Faculty of Public Health, Havana, Cuba. 6 Ministry of Health, Havana, Cuba.
7 America Arias maternity hospital, Havana, Cuba.
8 Department of Biostatistics, University of Khon Kaen, Thailand.
9 Department of Obstetrics and Gynecology, University of Khon Kaen, Thailand.
10 Department of Nursing, University of Khon Kaen, Thailand.
11 School of Family and Public Medicine, University of Natal, Durban, South Africa. 12 Centre for Health and Social Studies, Durban, South Africa.
Acronyms AC ACPP ALOS ANC
BLUE
COV CPP CS DEA DRG EOS FDCFIE
GDP HDP HMO HSU IPA IPD K L MC MCPP MFC MRA MRTS NN OLS PP PPF PPP RCT RPR SD SE STD TE UTI VD W.H.O. Average costAverage cost per pregnancy Average length of stay Antenatal care
Best-linear unbiased estimator Coefficient of variation
Cost per pregnancy Caesarean section
Data envelopment analysis ... Diagnostic-related group Economies of scale
Family Doctor Clinic (Cuba)
Full-time equivalent (staff member) Gross domestic product
Hypertensive disorders of pregnancy Health Maintenance Organization Health service use
Inpatient admiSSIon Inpatient day Capital Labour Marginal cost
Marginal cost per pregnancy Minimum feasible cost Multiple regression analysis
Marginal rate of technical substitution Neonatal
Ordinary least squares (regression) Postpartum
Production possibility frontier Purchasing power parity Randomised controlled trial
Rapid Plasma Reagent (syphilis test) Standard deviation
Standard error
Sexually transmitted disease
Technical efficiency (score in DEA) Urinary tract infection
Vaginal delivery
Glossary of terms
Accurate
Adjusted cost transfer
Allocative efficiency A verage cost
Cost estimation
Cost prediction
Direct cost transfer
Economic significance Economic efficiency Economies of scale Economies of scope Efficiency Financial cost Generalisability Health facility Health provider
This term is used in the context of cost prediction, where a cost prediction is judged 'accurate' if the 95% confidence interval of a predicted cost falls within the 95% confidence interval of observed cost.
A cost prediction method that involves prediction of costs . in one setting based on the costs in another setting, but where adjustments are made using local data from the setting where costs are being predicted (if in different countries, adjusted transfer is in a common currency)
... . ..
Maximisation of outcome (health) with minimum cost. The full cost of a single health service or unit of production, including fixed resources and overheads. Costs are calculated using primary data sets (also termed
'observed' cost).
Costs are calculated using secondary data sets, or a mixture of primary and secondary data sets.
A cost prediction method that involves prediction of costs in one setting based on the costs in another setting (if in different countries, transfer is in a common currency) Economic significance in this thesis is defined to occur when cost differences amount to more than the cost of a single antenatal care visit.
Maximisation of outputs (health services) with minimum cost.
A proportionate increase in all inputs leads to more than a proportional increase in outputs, thus leading to lower average costs.
An increase in the number of health services offered reduces average costs.
See 'Technical efficiency', 'Economic efficiency' and 'Allocative efficiency'
The price paid by a purchaser of health care resources. The extent to which data can be used from one setting in another setting.
A generic term used to denote any complete physical health care structure, such as a hospital, health centre, or stand-alone clinic
The member(s) of staff directly involved in health care activities (e.g. nurse, general practitioner, obstetrician)
Incremental cost impact A cost prediction method that identifies the cost impact of an alternative form of care over and above or below the
Marginal cost
Opportunity cost
baseline care.
The additional cost of a single health service or unit of production (sometimes approximated by variable cost). The value of a resource in its' best alternative use. Over prediction . Predicted costs are more than observed costs
Returns to the variable factor An increase in health service utilisation in the short-run
Significance
Statistical significance
Technical efficiency
Technical efficiency score
Under prediction Unit cost
leads to. a lower average cost, as fixed costs are spread over a larger number of patients.
See 'Economic significance' and 'Statistical significance'. A statistically significant difference between two costs occurs when the 95% confidence intervals of the two costs being compared do not overlap.
Maximisation of outputs (health services) with given inputs.
The efficiency score obtained from data envelopment analysis, where providers are compared in terms of chosen inputs and outputs.
Predicted costs are less than observed costs.
The cost of a single health service. See 'Average cost' and 'Marginal cost'.
1
INTRODUCTION1.1 Background
The motivation for this thesis arises from a growing concern expressed in the health economic literature with the way in which costs are being generalised 1 between health care settings or estimated 011 the basis of inadequate data (Drummond et al 1992, Jefferson et al1996, Buxton et al1997, O'Brien 1997, Bryan and Brown 1998, Walker and Fox-Rushby 1998, Spath et al1999, Coast et al 20~O). The concern is that, while the principle of general ising cost data between settings "is not wrong per se, analysts trying to reflect costs in their own setting often do not pay adequate attention to cross-setting differences that may cause costs to vary. Also, cost calculations may not be described or costs are not presented in disaggregated form to allow assessment of generalisability to other settings.
In the last 10-15 years, significant progress has been made in the economic evaluation of health care programmes through the establishment of an economic evaluation framework (Drummond et al1987) and costing guidelines2• However, these guidelines focus mainly on the estimation of costs and cost-effectiveness using primary research, with only limited guidance on how data can be extracted from secondary sources, such as through meta-analyses, modelling or extrapolation. Therefore, there is a gap in these guidelines on how cost-effectiveness data can be predicted or generalised from secondary sources to the settings where cost-effectiveness is needed. While some studies may identify important differences between secondary and primary settings, and make adjustments based on those observations (e.g. Menzin et al 1996), this thesis argues that at present a framework has not been constructed to deal with this adequately.
This thesis aims to contribute to filling these knowledge gaps, and it is a part of the growing recognition of the importance of this area. For example, a recent Health Technology Assessment grant in the UK was awarded to examine issues of
1 A generalisation in this thesis means 'the application of the results of a given setting to other populations
or subpopulations' (Willke et aI1998).
2 For example, in developed countries several costing guidelines are widely quoted in costing studies, such
generalis ability. This project aims to improve how researchers tackle issues of generalis ability at study design stage, as well as in reporting of results. Also, The Department of Evidence for Health Policy at W.H.O. is currently making global cost-effectiveness estimates for around 100 health interventions, using a costing spreadsheet to estimate what inputs are required to provide these interventions. Another initiative, The Global Forum for Health Research (based at W.H.O.) is examining whether standardised costing and effectiveness guidelines can be made for predicting cost-effectiveness of a set of health interventions, using available data sources at local and
.'
.
international level (GFHR 1999). Finally, The CHEC project (Consensus on Health Economics Criteria list) is an international collaborative effort, aiming to develop criteria to assess the quality of economic evaluations in systematic reviews, and contains aspects of generalis ability. Therefore the theme of this thesis is timely given these initiatives, and the current need for a greater understanding of what factors affect cost generalisability.
The rest of this chapter justifies further the theme of this thesis. First, the importance of costing in planning health interventions is described, and different aspects of cost are defined. Second, the importance of making cost predictions in health services research is explained, and concerns are raised concerning some of the current approaches to cost prediction. Therefore, potential ways of advancing the field are outlined. Third, the thesis aim, objectives and structure are outlined.
1.2 Cost information in decision making
1.2.1 Why are costs important?
The achievement of efficiency and equity are two fundamental goals for the allocation of resources within public health systems. Resources are severely limited in the health sector, especially in developing countries, and policy makers must make choices between alternative health care interventions and strategies to meet health targets. Therefore the search for the most efficient and equitable health interventions and
for environmental vector control, Sawert (1996) for tuberculosis control, and Kumanayarake et al (2000) for HIV/AIDS prevention strategies.
strategies using economic evaluation techniques is essential to optimise the welfare of society (Sawert 1996)3.
Cost-effectiveness analysis (CEA) is one form of economic evaluation ~hat attempts to rationalise the decision making process, by attaching costs and health outcomes to different health care processes, and comparing these processes. It has even been claimed . that it is unethical not to take costs into account when deciding which patients get treated and what treatment they receive,. due to the 'sacrifice' involved in using
." .
resources for these patients instead of other (potential) patients (Philips 1987, Williams 1992).
CEAs have stringent information requirements in order to be scientifically robust, as well as have relevance in other health care contexts. As the numerator in cost-effectiveness ratios, costs are essential to the reporting of economic evaluations (Drummond et al 1997). A recent development is the increasing use of randomised controlled trials (RCT) for measuring cost-effectiveness (Adams et al 1992, Mannheim 1998). From a scientific point of view, cost measurement alongside RCTs is preferable over non-experimental studies and retrospective costing because costs and benefits of alternative programmes are measured on the same patients and under controlled conditions (Drummond and Davies 1991, Drummond 1994, Drummond 1995, Pocock 1999, Petiti 2000). Cost estimation alongside these trials therefore plays a central role in determining cost-effectiveness.
1.2.2 Types of cost
In discussing 'cost', several interpretations are possible, depending on the user of information and the study context. Box 1.1 presents a typology of cost terms used in this thesis, reflecting current concepts4 about cost in health economics (Donaldson 1990, Rovira 1994, Baladi 1996, Gold et a11996, Drummond et al1997).
Box 1.1 Typology of cost terms used in the thesis.
1. PRICE. The price of a resource. For example, the cost of a doctor hour;ihe cost of a single item of equipment. Two alternative prices are distinguished:
• ECONOMIC PRICE. The opportunity lost due to the use of a resource in an activity. • FINANCIAL PRICE. The money paid for a resource.
Therefore the costs in 4. to 7. below can be expressed in either economic or financial values.
2. RESOURCE USE. Quantity of resource use, in physical units. Different types of resources in the health sector used in this thesis are 'staff j' 'equipment', 'materials', 'drugs', 'utilities', and 'land and
buildings'. How these are defined in this thesis is described later:
3. HEALTH SERVICE USE. Types of health service include outpatient visits, inpatient days or admissions, operations, and laboratory tests. These can be expressed as a 'throughput' for a particular type of patient or population, and for a specified time period.
4. UNIT COST. The cost per health service use. This can be expressed as:
• A VERAGE COST. This includes all resource inputs to the health are process (see 2.).
• MARGINAL COST. This includes only resource inputs that change with one unit of production.
5. CASE COST. The cost for a single patient for a specified illness and/or over a specified time period.
For example, the costs of a surgical case may include all outpatient visits, inpatient days, and surgical procedures associated with the surgery.
6. TOTAL COST. The cost of health services for a defined population, health programme or health facility, and over a given time period.
7. INCREMENTAL COST. The difference in the total cost of two or more competing treatments. For example, the change in costs from implementing a new procedure, such as day versus inpatient surgery.
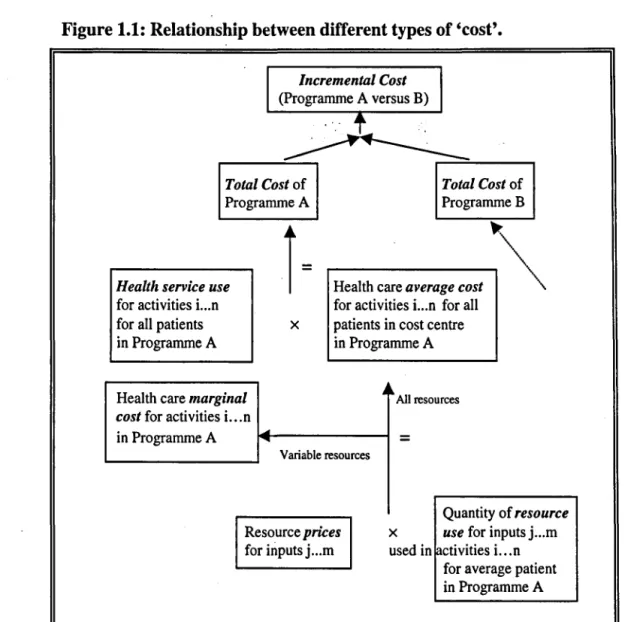
Six types of cost are distinguished: prices, resource use, unit cost, health service use, case cost, total cost, and incremental cost. Two of these, resource use and health service use, are not in monetary form, but instead what are termed here 'natural' units. Summarising costs in non-monetary units has the advantage that components of cost can be compared across borders, without having to convert local currencies to a common currency, which may distort the comparison (Murray et alI994). On the other hand, the advantages of summarising costs in monetary units are that costs are summarised and can be compared in a single unit or index, and the relative weights of different resources in overall cost can be understood.
Several important relationships should be noted between these costs, particularly the construction of total costs. Figure 1.2 shows that the prices and resource uses for a
single use of health service (such as an outpatient visit) are combined to calculate the unit costs (either average or marginal) of a service. This relationship suggests that to
/
understand unit cost variation, variation in each of the resources and prices that make up unit cost should be understood.
Figure 1.1: Relationship between different types of 'cost'.
Incremental Cost (Programme A versus B)
',' .t
Total Cost of Programme A Total Cost of ProgrammeBHealth service use
for activities i...n for all patients in Programme A
Health care marginal cost for activities i...n
in Programme A
i=
.---~~
Health care average cost~
for activities i...n for all x patients in cost centre
in Programme A
~ II. All resources
=
Variable resources
Quantity of resource
Resource prices
for inputs j ... m
X use for inputs j ... m used in [activities i...n
for average patient in Programme A
At the next level of aggregation, unit costs are combined with health service use to estimate the overall cost, either of a programme ('total cost') or of a single patient ('case cost'). This relationship suggests that to understand total or case cost variation, variation in each of the components should be understood, including all elements of health service use (inpatient, outpatient, etc.), and each of the resources and prices that make up unit cost.
patient level). Again, to understand variation in incremental cost between setting, variations in each of the components of incremental cost must be understood. As will be discussed below, this distinction between the components of different types of cost is important in making cost generalisations or predictions, as differences in each component can be compared and analysed separately, to improve the quality of the generalisation.
1.3 Cost predictions
1.3.1 What is a cost prediction?
In costing health services there exist a variety of data sources for the analyst to choose from in estimating costs (Drummond and Jefferson 1996, Nuitjen 1999). For example, - in building the total cost of a health care programme, the components of total cost (prices, resource use and health service use, as shown in Box 1.2) can be measured on the population in the programme or a representative sample of the population. These sources are termed 'primary' data sources, and include routine data systems, local price lists, case notes, time and motion studies, and other non-routine data collection systems set up for the purposes of research.
Alternatively, data to calculate costs may originate from other settings from where the health care intervention is being evaluated. These sources are termed 'secondary' (or non-primary) data sources, and include published data from other settings such as single clinical trials or meta-analyses of clinical trials, insurance claims databases, fee schedules, clinical guidelines of best practice, and modelled data based on assumptions or professional opinion (e.g. delphi panel technique) (Nuijten 1999). Examples of secondary sources include the use of costs from one centre in a multi-centre clinical trial to represent costs in all centres (e.g. Menzin et al1996, Schulman et al1996) or the use of charge data to represent actual costs (Kinosian and Eisenberg 1988)5. Although judgements about accuracy cannot necessarily be made based on whether costs are estimated from primary or secondary sources6, the use of secondary sources does
S Charge data or fees could be argued to be primary sources, as they are collected from actual patients,
often in the same setting as the research study. However, because these often contain a profit element or cross-subsidy, they rarely reflect actual cost, even when adjusted by an average cost-to-charge ratio (Finkler 1982). Therefore, in this thesis, they are classified as secondary sources.
suggest greater uncertainty, or uncertainty is not known, about whether costs refer to the population for whom they are supposed to represent.
This distinction between primary and secondary data sources allows definition of the terms 'estimated' cost and 'predicted' cost, for use in this thesis. Therefore, a cost that is 'predicted' is defined as a cost that is based on some or all non-primary data sources; that is, data sources are from outside the setting where cost estimates are required. A cost that is estimated is defined as a cost .t~at is based entirely on actual health care processes in the primary setting; that is, data sources are from the same setting as where cost estimates are required. Costs are therefore 'predicted' in any case where real health care processes are not observed in the setting where costs are required7•
- 1.3.2 The need for predicting cost
Although prospective costing using primary data sources could be seen as the 'gold standard' in costing, there are several circumstances in which secondary data sources may be preferable or even necessary:
• It is unfeasible to run a new clinical trial to estimate the cost-effectiveness of an intervention for every new population about which a decision must be made (Willke et al 1998, GFHR 1999).
• Cost data are not always available from routine data systems, due to poor organisation and lack of resources devoted to hospital management and accounting systems (O'Brien et al1992, Murray et al2000).
• The funding allocated to conducting clinical trials is often insufficient to conduct a prospective costing study using primary data. Therefore, secondary data allow quick and relatively cheap assessments of health technology before further investments in health technology assessment (Attinger and Panerai 1988).
• Costs are difficult to estimate in the early life of a new health intervention, when data are unavailable or they do not reflect costs that would pertain after wider implementation (Schulman et alI991). A linked point is that an immediate decision may be needed, and collection of primary data may take too long.
• The types of health care for which cost estimates are required may not be provided by the health system at present, and therefore costs cannot be estimated based on current health care processes (Jefferson et alI996). /"
• In collecting cost data alongside clinical trials, the costing study may disrupt health
services, and even change provider and patient behaviour (Mugford et al 1998). • The cost analysis is a national analysis, and the model sophistication and data do not
exist for all costs in all settings to be estimated, and a 'representative' sample is chosen based on convenience such as 'Yhat data areavailable (e.g. Bobadilla et al
1994, Jha 1998).
These circumstances indicate that cost predictions using generalised data or assumptions are unavoidable in many research or decision making contexts .. However, while unavoidable, it does not mean that generalisations should be made without attention to the quality or accuracy of the generalisation, a point highlighted in the next section.
1.3.3 Problems arising when not using primary data sources
Despite the common use of secondary sources to collect cost data, costing guidelines say little about the way in which secondary data sources can be used and/or adapted to approximate more closely costs in the primary setting, other than by encouraging transparency and careful interpretation. Such discretion means that poor quality cost study designs may be justified on the basis that the funds and data were not available for good quality cost data (often despite huge resources being expended on the clinical component of a trial). Some authors have voiced concerns about the uses of secondary cost data. For example, Drummond et al made the following observation about the use of secondary data, in considering cross-national assessments of health technology:
" ... however, the extrapolation of the results of economic evaluations from one setting to another is not a straightforward matter. A number of factors are pertinent to health technology that are known to vary from country to country ... for example, differences in demography and epidemiology, differences in general and relative price levels ... differences in the distribution of health care resources and their availability" (Drummond et a11992, page 672).
In support of this statement, many other commentators have voiced doubts about transferring cost and cost-effectiveness evidence across health care settings, both within and between countries8• For example, in the context of mammography screening in the UK Bryan and Brown (1998) warned against the "naive and unthinking use" of published cost-effectiveness information outside the setting in which the information was generated, due to differences in the design of screening programmes. Glick (1997) also questioned whether observations about the econorruc impact of a medical therapy in one setting or patient population informs. use about it's impact in other settings or
. '.
patient populations, and recommended the use of sub-group analysis. Finally, in their article on sensitivity analysis, Briggs et al (1994) recognised that cost data may not be generalisable and suggested altering parameter values to reflect the range of values in other settings to test the impact on cost or cost-effectiveness.
Many of these studies mentioned above have described or listed a number of factors that were considered to be important determinants of cost, and thus likely to be responsible for cost variation between health care settings. For example, O'Brien (1997) listed six threats to validity: different demography and epidemiology of diseases, clinical practice and conventions, incentives and regulations for health care providers, relative price levels, consumer preferences, and opportunity cost of resources. These and other factors are summarised in Table 1.1, and are grouped according to whether they affect cost through the supply side (health care provider) or demand side (patient), and whether they affect health service use or unit costs. On the patient side, the most widely quoted factors causing costs to vary were case-mix, patient costs, and patient access. On the provider side, the most widely quoted factors causing costs to vary were resource prices, financial incentives, and health care content. Empirical evidence for the effect of these factors is discussed in more detail in Chapter 4.
8 Commentators include Attinger and Panerai 1988, Postma et al 1993, Lee et a11993, Briggs et al 1994, Jefferson et al 1996, O'Brien 1996, Buxton et al 1997, Mason 1997, O'Brien 1997, Glick 1997, Drummond et al 1997, Phelps 1997, Bryan and Brown 1998, Grieve 1999, Spath et al 1999, Coast et al 2000. Also of some relevance are doubts raised over the external validity of clinical (effectiveness) results
Table 1.1: Factors varying between health care settings that may influence costs. Health care provider ('supply') factors
Health service use, affected by:
• Financial incentives and regulations • Risk aversity of providers
• Treatment guidelines • Hospital policy
• Qualifications and experience of staff • Referral patterns
• Provider habits and incentives for treatment • Availability of services . • The perceived costs of alternative types of care ....
Unit costs, affected by:
• Content of health care
Patient ('demand') factors
Health service use, affected by:
• Natural history and epidemiology of disease • Demography and case-mix (risk and morbidity) • Patient costs
• Geographical accessibility • Risk aversity of patients • Responsiveness to care
• Compliance with treatment and advice • Expectations and consumer preferences
Unit costs, affected by:
• Case-mix
• Absolute prices or opportunity coist • Expectations and consumer preferences Patient costs
• Financial incentives •
• Relative prices and input mix, skill mix
• Provider productivity (e.g. patients seen per day per staff member)
• Occupancy • Quality of care
• Risk aversity of providers • Treatment guidelines Sources: see Footnote 8.
Given the comments and findings of these studies, researchers and decision makers still face the problem that there is inadequate empirical evidence for confidently making adjustments to costs from other settings to reflect actual costs more closely in their own setting, or predicting costs using alternative techniques. This problem is compounded by the fact that different health care settings usually differ with respect to cost determinants, so guidelines can at best suggest what aspects of cost should be studied, and help analysts make appropriate choices. Therefore, the next section provides an overview of methods to improve this situation.
1.3.4 Ways of advancing the field of cost generalisability
Several ways of increasing generalis ability have been identified. These relate to the conduct and presentation of published cost studies, cost analyses to understand the determinants of cost, and a comprehensive evaluation and comparison of cost prediction techniques. Each are discussed in tum.
Conduct of cost study and presentation of cost results
Three aspects of cost studies are discussed here. The first aspect involves the use of a standard approach, such as the 'reference case' (Weinstein et al 1996) so that those
generalising or comparing cost data know, for example, which costs were included or excluded, and the measurement or valuation techniques to obtain cost figures (Janowitz and Bratt 1992). While costing guidelines allow some discretion to the analyst in which data sources to use, 'consensus' articles (e.g. Drummond and Jefferson 1996, Luce et al 1996) have argued that several aspects of costing are universally important. Aspects discussed include: inclusion· of relevant and important costs, a costing approach appropriate for the setting, detailed measurement of ' resource use, use of opportunity cost to reflect the value of resources, justi~cation of models and assumptions, a good quality sensitivity analysis, discounting, and separate presentation of components of cost. Inappropriate methods or unjustified assumptions in costing can cause considerable uncertainty in the estimates, as well as reducing the comparability with other studies using the reference case recommendations. Another challenge to
-robustness that authors should be aware of in using secondary data is analyst bias, due to vested interests or prior expectations (Kassirer and Angell 1994, Evans 1995, FDA 1995).
Therefore, transparent methods are of critical importance so that readers of economic evaluations know what was done, and why. However, review studies conducted to date have found that results of economic evaluations are largely nongeneralisable, due to methods used being at variance with recommendations in economic evaluation guidelines, or lack of statement of methods (Udvarhelyi et al 1992, Heyland et al 1996, Spath et al 1999). For example, Spath et al (1999) conducted a review of economic evalutions of adjuvant therapy in women with breast cancer to assess their applicability to a decision making context in France. They first applied four initial criteria to select studies, including statement of viewpoint, comparison of at least two competing alternatives, description of therapies, and precise reporting of the effectiveness of the therapies. These criteria ruled out 17 of 26 studies identified as economic evaluations. They then applied six further 'generalisability' criteria to the remaining studies9• Of the nine studies evaluated, none had all the necessary characteristics to be transferred to the setting in France, and only one study was found to have sufficiently disaggregated data on costs to be considered transferable to the study setting, thus allowing adjustments to
be made. Therefore, this study highlights the problems resulting from not using or reporting appropriate economic evaluation methods.
The second aspect of cost studies involves the testing of robustness of cost estimates (Briggs et al 1994). The standard technique advocated by economic evaluation guidelines is sensitivity analysis, which shows cost results under alternative assumptions or conditions or, alternatively, the assumptions required for study conclusions to change (threshold analysis). However, the main a~plication of sensitivity analysis so far has been static analyses (Hutton 1993, Briggset al 1995), suggesting that the ranges presented may reflect uncertainty inadequately. The problem with static analysis is that differences between settings in production relations that determine cost are not accounted for. More recently there have been developments in stochastic and multivariate sensitivity analyses, using probabilistic, montecarlo and bootstrap methods (Doubilet et al 1985, O'Brien et al.1994, Manning et al 1996, Hunink et al 1998, Lord and Asante 1999). These approaches can, in theory, take account of interrelationships between variables and dynamic effects, if data on these are available.
The third aspect of costing study to improve generalis ability is the presentation of cost data in dis aggregated as well as aggregated form (Drummond and Jefferson 1996), to allow readers to assess the relevance of the cost data to his setting, and recalculate costs. This may involve presentation of prices and quantities separately (or at least describe input mix) and health service use.
Cost analysis to understand cost determinants
Costs are transferred more accurately if cost behaviour is understood in both primary and secondary settings and appropriate adjustments made (Drummond et
at
1992, Menzin et al 1996). Economic theory suggests that cost behaviour depends on many interrelated factors, which are likely to vary between setting (Heathfield and Wibe 1981). The assessment of these factors requires a variety of techniques to be performed for understanding unit costs and assembling evidence of cost behaviour (Sherman 1984, Barnum and Kutzin 1993, Ehreth 1994). Such information on cost determinants has a practical use, as Jian et al (1998) points out " ... to identify the most efficient way of providing immunisation services ... a rough quantitative notion of the relative importanceof factors contributing to cost variation is useful". Therefore, this thesis argues that understanding costs is a critical stage before cost prediction, and therefore cost analysis techniques and results from the literature are reviewed in detail.
Compare the performance of different cost prediction techniques
In their review article on methodological issues in costing health care technologies in clinical trials, Johnston et al (1999) recommend further empirical study in methods to generalise results. None of the costing gui~elines or cost analysis articles found in the
..
literature search have described and tested comprehensively a range of cost prediction methods, nor have described means of judging what levels of inaccuracy are 'acceptable' for the conclusions to hold. Without development in the area of cost prediction techniques, many economic analysts are likely to continue to predict costs inappropriately, or use more time-consuming and data-intensive methods when simpler and cheaper ones may have sufficed. For example, a reduced-list costing method that identifies the main economic impacts (Knapp and Beacham 1993, Howard et al 1995, Whynes and Walker 1995) has been shown to approximate costs well, and is likely to require less research time than a prediction technique such as regression analysis. Therefore, cost prediction methods need to be evaluated in a variety of settings and compared with each other using both scientific and pragmatic criteria, so that choices can be about optimal cost prediction methods made in a variety of settings. These results, together with the results of the cost analysis review, should be used to conclude what the advantages and disadvantages of each cost prediction method are. Therefore the testing of alternative cost prediction methods and understanding their performance under different conditions are the primary aims of this thesis.
1.4 Thesis aims and outline
1.4.1 Thesis aim
The overall thesis aim is to increase current knowledge about the strengths and weaknesses of alternative cost analysis and cost prediction methods, in the context of public health care systems, and with particular emphasis on developing countries.
underdeveloped. Further research is urgently required that reviews current concepts and understanding in the literature, compares alternative cost analysis and cost prediction methods in a variety of settings, and draws conclusions about" the strengths and weaknesses of alternative cost analysis and cost prediction methods.
The context of this thesis is a multi-country trial evaluating the cost-effectiveness of the W.H.O. antenatal care programme (Lumbiganon et al 1998, Villar et al 2000). Alongside this trial, a detailed costing stud~ \Vas conducted in Cuba and Thailand. Also, a study was conducted in South Africa to measure costs of maternity care, and to further explore issues of generalisability. Maternity care is an important health care field to research at present because it is a priority of many countries and international organisations, but there have been limited economic studies done to date to allow policy makers to choose the most cost-effective mix of interventions (Hutton 1996, Mumford et al 1998, Petrou et al 2000, Hende~son et al 2000).
The thesis objectives are therefore to:
1. Review the current literature on the application of economic theory to health care costs, cost analysis and cost prediction methods, and cost analysis results, and build frameworks for analysing and predicting health care costs for use in this thesis. 2. Estimate and analyse health care costs associated with pregnancy and childbirth in
study settings, to understand cost determinants and behaviour. 3. Evaluate the robustness and generalis ability of these costs.
4. Test alternative methods of predicting costs, comparing cost predictions with observations of cost, and where predicted and observed cost differ, to examine why. 5. Make recommendations for researchers and policy makers concerning how to
conduct and interpret cost predictions, and recommend areas for further research.
1.4.2 Thesis outline
The primary aims of the literature reviews in chapters 2 to 4 are to review current knowledge and thinking in cost analysis and cost prediction, to provide a basis for the methods in this thesis, and to compare with the empirical findings of the thesis. Chapter 2 examines health care costs in the light of economic theory. The aim of the chapter is to provide theoretical foundations in designing the cost analysis, and to provide a basis for interpreting results. The chapter summarises the production and cost functions
underlying health care processes, defines efficiency and outlines the economic relationships driving health care production and costs. The assumptions underlying perfect competition are examined in relation to the public health sector, and conclusions are drawn whether breakdown in these assumptions affects interpretation of cost and cost analysis results. The final section pulls together the material presented in the chapter by listing likely factors that detennine unit cost behaviour and thus that drive cost differences between setting and over time.
Chapter 3 presents a review of cost analysis methods from the health care literature. The purpose of cost analysis in this thesis consists of explaining cost behaviour, particularly cost differences between health pr