in EU Member
States 2014
EUROPEAN ECONOMY 6|2014
Tax policy challenges
for economic growth
and fiscal sustainability
Directorate-General for Economic and Financial Affairs
Unit Communication and interinstitutional relations
B-1049 Brussels
Belgium
:
ecfin-info@ec.europa.eu
LEGAL NOTICE
Neither the European Commission nor any person acting on its behalf may be held responsible for
the use which may be made of the information contained in this publication, or for any errors which,
despite careful preparation and checking, may appear.
This report is also published as Taxation Paper No. 48 from DG Taxation and Customs Union.
This paper exists in English only and can be downloaded from
http://ec.europa.eu/economy_finance/publications/
.
More information on the European Union is available on
http://europa.eu
.
KC-AR-14-006-EN-N (online)
KC-AR-14-006-EN-C (print)
ISBN 978-92-79-35349-9 (online)
ISBN 978-92-79-36010-7 (print)
Tax Reforms in EU Member States
Tax policy challenges for economic growth and
fiscal sustainability
The report was coordinated by Florian Wöhlbier (DG ECFIN) and Thomas Hemmelgarn (DG TAXUD) under the supervision of Gilles Mourre (Head of Unit, DG ECFIN) and Gaetan Nicodeme (Head of Unit, DG TAXUD). The main contributors were Anne van Bruggen, Serena Fatica, Athena Kalyva, Gilles Mourre, Savina Princen, Florian Wöhlbier (DG ECFIN), Anna Iara, Milena Mathe, Agnieszka Skonieczna and Ernesto Zangari (DG TAXUD). Special contributions were provided by Caterina Astarita, Lovise Bauger, Matthias Burgert (DG ECFIN), Endre Gyorgy, Kees Heineken, Savino Ruà, Astrid Van Mierlo (DG TAXUD), and Salvador Barrios (JRC-Seville).
Alexander Leodolter (DG ECFIN) was responsible for data, layout and IT. Vukasin Ostojic and Anamaria Maftei (DG ECFIN) provided support with the data. Secretarial support was provided by Maria Stampouli (DG ECFIN). The report benefitted significantly from suggestions by the European Commission's editing service (DGT).
Comments and suggestions by members of the Economic Policy Committee and the Working Group 'Structures of Taxation Systems' are gratefully acknowledged. The report also benefited from comments and suggestions by colleagues in the Directorates-General for Economic and Financial Affairs and Taxation and Customs Union as well as by other services of the Commission.
Comments on the report may be addressed to: Gilles Mourre
European Commission
Directorate-General for Economic and Financial Affairs Directorate for Fiscal Policy
Office CHAR 12-55 B-1049 Brussels
e-mail: Functional Mailbox ECFIN-C3@ec.europa.eu and/or
Gaetan Nicodeme European Commission
Directorate-General Taxation and Customs Union
Directorate for Direct taxation, Tax Coordination, Economic Analysis and Evaluation Office SPA3 6/017
B-1049 Brussels
CZ Czech Republic DK Denmark DE Germany EE Estonia IE Ireland EL Greece ES Spain FR France HR Croatia IT Italy CY Cyprus LV Latvia LT Lithuania LU Luxembourg HU Hungary MT Malta NL Netherlands AT Austria PL Poland PT Portugal RO Romania SI Slovenia SK Slovakia FI Finland SE Sweden UK United Kingdom EA Euro area EU European Union
EU-28 The 28 EU Member States
EA-18 The 18 Member States in the euro area
Others
ACE Allowance for corporate equity AETR Average effective tax rate
CPB Central Planning Bureau, the Dutch government’s research institute for economic policy analysis
CBIT Comprehensive business income tax CIT Corporate income tax
CCCTB Common consolidated corporate tax base
DG ECFIN Directorate-General for Economic and Financial Affairs DG TAXUD Directorate-General for Taxation and Customs Union
EA Euro area
EBITDA Earnings before interest, taxes, depreciation and amortisation ECB European Central Bank
ECOFIN Economic and Financial Affairs Council EPC Economic Policy Committee
ESA79 European system of accounts 1979 ESA95 European system of accounts 1995 ESA 2010 European system of accounts 2010
EU European Union
FTT Financial transaction tax GDP Gross domestic product GNI Gross national income
JRC-IPTS The European Commission Joint Research Centre’s Institute for Prospective Technological Studies
LR Long run
METR Marginal effective tax rate MoU Memorandum of understanding MTO Medium-term budgetary objective
OECD Organisation for Economic Cooperation and Development PIT Personal income tax
pp. Percentage points
R&D Research and development
SME Small and medium-sized enterprise SSC Social security contributions VAT Value added tax
Executive summary 12
Introduction 15
1.
Recent reforms of tax systems in the EU
17
1.1. Introduction 17
1.2. Main trends in taxation 17
1.3. Labour taxation and tax shifting 18
1.4. Broadening of the tax base 19
1.4.1. Value added tax 19
1.4.2. Personal and corporate income tax 20
1.4.3. Addressing the debt bias 20
1.5. Competitiveness and environmental concerns 21
1.5.1. Competitiveness 21
1.5.2. Environmental and health taxation 23
1.6. Immovable property taxation 24
1.7. Tax compliance and tax administration 25
2.
Challenges related to fiscal consolidation and growth-friendly tax
structures
45
2.1. Fiscal consolidation on the revenue side — an indicator-based screening 45
2.1.1. Benchmarking approach 45
2.1.2. Screening of Member States 46
2.1.3. Comparison of screening results with previous years 49
2.1.4. Countries with moderate fiscal risk and a high tax burden on labour: scope for
reducing taxes 50
2.2. Growth-friendly tax structures — an indicator-based screening 51
2.2.1. Screening approach 51
2.2.2. The need for a tax shift: high tax burden on labour 52
2.2.3. Potential for increasing taxes on consumption, taxes on recurrent property or
environmental taxes 54
2.2.4. Summary of findings on the need and potential for a tax shift 57
2.3.2. Tax shift with compensation for benefit and transfer recipients 61
3.
Challenges related to broadening tax bases
63
3.1. Housing taxation 63
3.1.1. Taxes on immovable property: size and structure 63
3.1.2. Design issues in housing tax 68
3.1.3. Measuring the impact of taxation on the cost of owner-occupied housing 72
3.2. Debt bias in corporate taxation 75
3.2.1. Some country measures of the debt bias 76
3.2.2. Addressing the debt bias: limiting interest deductibility vs extending deductibility to
equity costs 77
3.2.3. The importance of tax design: a comparison of the Belgian and Italian ACEs 78 3.2.4. The ‘international dimension’ of the debt bias: internal vs external debt and
anti-avoidance measures 80
3.2.5. Financial sector, debt bias and bank levies 82
3.2.6. The different aspects of the debt bias problem and the challenges for tax design 82
3.3. Economic aspects of selected tax expenditures in direct taxation 83
3.3.1. The challenges of assessing tax expenditures 83
3.3.2. Tax expenditures in personal income taxation 84
3.3.3. Tax expenditures in corporate income taxation 86
3.4. Broadening the VAT base 89
4.
Specific challenges related to the design of individual taxes and
tax governance
93
4.1. Environmentally-related taxation 93
4.1.1. Need for additional measures to achieve greenhouse gas emissions targets 93
4.1.2. Improving the design of environmentally related taxes 94
4.1.3. Summary of issues in the area of environmentally related taxation 99
4.2. Tax governance 99
4.2.1. Measuring the tax compliance gap 100
4.2.2. Reducing the tax compliance gap by improving tax administration 102
4.2.3. Overall results for quality of tax governance 107
4.3. Income inequality and taxation 108
4.3.1. Income inequality over the period 2008-12: the overall effect of tax-benefit systems 111
4.3.2. Poorest households most severely exposed 112
4.3.3. Conclusion: fairly stable overall income distribution masking hardship faced by the
least well-off 113
References 119
Glossary 127
A1. Methodology 131
A1.1. Benchmarking approach to identifying Member States that face a challenge in a particular
area of tax policy 131
A1.2. Principles of Screening for identifying a potential need and scope for tax-based
consolidation 132
A1.3. Principles of Screening for identifying a potential need, and scope, for a tax shift 134 A1.4. An indicator for the tax burden on owner-occupied housing: further methodological issues 136
A1.5. The QUEST model 138
A2. Statistical data 139
LIST OF TABLES
1.1. Tax changes adopted from mid-2013 to mid-2014 18
1.2. Overview of tax reforms in Member States 28
2.1. Medium term sustainability gap 47
2.2. Indicators of ‘tax space’ 48
2.3. Assessment of ‘tax space’ 48
2.4. Overview: fiscal consolidation challenges 49
2.5. Comparison of screening results: 2012-14 49
2.6. Tax burden on labour and overall labour market situation 52
2.7. Labour market situation of low-skilled workers and the tax burden on low-wage earners 54 2.8. Gender-specific labour market situation and tax burden on second earners 55
2.9. Consumption taxes and indirect taxes 55
2.10. Revenues from recurrent property tax, as a percentage of GDP 56
2.11. Tax burden on the environment 56
2.12. Overview: tax structure indicators 57
2.13. Comparison of screening results: 2012-14 58
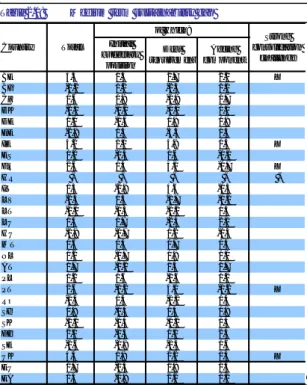
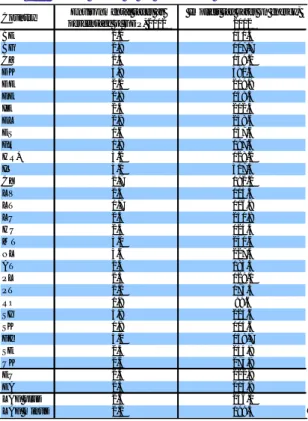
3.1. Tax rates on real estate transactions in EU Member States, 2014 65
3.2. Rules and reforms of mortgage interest tax relief for owner-occupied properties in EU
Member States 70
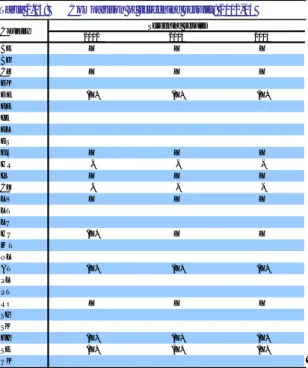
3.3. Recurrent property taxes in % of household gross disposable income by income quintile in
3.6. Evaluation of tax expenditures in some major areas 88
3.7. VAT indicators 90
4.1. Summary of challenges in the area of environmentally related taxation 99 4.2. Value of the non-observed economy, reference years as specified (as a percentage of
GDP) 101
4.3. Overview of tax administration assessment 108
4.4. Overview of tax policy challenges in Member States 117
A2.1. Total taxes (including social contributions) and tax structures, % of GDP, 2000-2012, EU-28 139 A2.2. Total taxes (including social contributions) and tax structure, % of GDP, 2000-2012, EA-18 140
A2.3. Development of implicit tax rates, in % 141
A2.4. Top statutory tax rates in personal and corporate income taxation, in % 142
A2.5. Energy tax revenues in relation to final energy consumption 144
A2.6. The composition of tax wedge in 2013, single average income worker 145
A2.7. Tax wedge – different household types 146
A2.8. Standard and reduced VAT rates in the EU 147
LIST OF GRAPHS
1.1. Evolution of tax revenues (EU, percentage of GDP) 17
2.1. Need for consolidation and scope for increasing taxation 46
2.2. Medium-term sustainability and total tax burden on labour 51
2.3. Medium-term sustainability and tax burden on low-wage earners 51
2.4. Need and scope to reduce labour taxation by means of a revenue-neutral tax shift 52
2.5. Benchmark — GDP and components 59
2.6. Benchmark — labour market 59
2.7. Contribution of tax changes to GDP (percentage deviation from baseline) 60
2.8. Distributional effects of a tax shift 60
2.9. Distributional effects — ratio of liquidity-constrained to non-constrained households 60
2.10. Compensation — GDP and its components 61
2.11. Compensation — labour market 61
2.12. Compensation – Distributional effects, measured by the ratio of liquidity-constrained to
non-constrained households 62
3.1. Revenue from property taxation, 2012 (in % of GDP) 64
3.2. Home ownership and rental rates, 2012 69
3.3. Marginal cost of investing in housing 72
3.4. Contribution of recurrent property taxes to the marginal cost of housing investment (in
percentage points) 75
3.5. Contribution of mortgage interest tax relief to the marginal cost of housing investment (in
3.7. EMTR in % on equity- and debt-funded new corporate investments, 2013 76
3.8. Tax expenditures as % of GDP in selected EU MS and the US 83
3.9. Tax expenditures as % of total tax revenues in selected EU MS and the US 83 4.1. Projected gap between performance and targets under the Effort Sharing Decision, in 2013
and 2020: over-delivery (-) and shortfall (+) as a percentage of 2005 greenhouse gas
emissions 94
4.2. Marginal tax rates on petrol and diesel when used as propellants, 2014 (euros per gigajoule) 96 4.3. Consumption of petrol and diesel as propellants, 2012 (terajoules as a percentage of GDP) 96
4.4. Revenue from vehicle taxation, 2012 (as a percentage of GDP) 97
4.5. VAT compliance gap in the EU, 2000-11 (as a percentage of GDP) 101
4.6. VAT compliance gap as a percentage of theoretical VAT liability 102
4.7. Use of electronic filing, 2011: personal income tax 105
4.8. Use of electronic filing, 2011: corporate income tax 105
4.9. Use of electronic filing, 2011: VAT 106
4.10. Value of assessments as a percentage of net revenue, 2009-11 106
4.11. Undisputed tax debt as a percentage of net revenue, 2011 106
4.12. Cost of tax collection, 2011 (per 100 units of net revenue) 107
4.13. Administrative burden (hours) created by the tax system for a medium-sized company, 2012 107 4.14. Absolute change in Gini index of market income inequality, net income inequality, and the
reduction of income inequality through taxes and benefits, 2008-12 112 4.15. Change in the distribution of total net income across sections of the income distribution
(left-hand axis); change in overall net equivalised household income measured in terms of purchasing power (right-hand axis) in percentage points respectively, 2008-11 113 4.16. Proportion of households with income below and above 60 % of median income struggling
to make ends meet, 2008 and 2012 114
LIST OF BOXES
3.1. Shifting the tax burden to housing — First insights from the QUEST model 66 3.2. An indicator for the tax burden on owner-occupied housing: conceptual framework 73
4.1. Tax compliance, social norms and quality of institutions 103
4.2. Wealth-related taxes: the current debate and existing legal provisions 109 4.3. income distribution and inequality in times of crisis and fiscal consolidation 115
Carefully designed tax systems can help redefine the triangle between sustainability, growth and fairness, objectives which have become even more important in the aftermath of the most severe economic crisis since the 1930's. The three objectives are sometimes viewed as contradictory, with a focus on one element implying negative consequences for the others. While some trade-offs exist, Member States can at the same time help ensure stable public finances, boost growth, employment and competitiveness, and contribute to a fair distribution of income by changing the tax structure in a balanced way and by improving the effectiveness and efficiency of the system.
The annual Tax Reforms Report aims to make a contribution to these discussions by scrutinising reform trends and providing in-depth analysis of challenges and possible solutions in key areas of tax policy. At the same time, applying an indicator-based, the report identifies Member States that may have room to further improve their policies in specific areas. By making available data and analysis in a timely manner, the report provides relevant input to the process of multilateral surveillance.
This year's edition of the report aims to further stimulate the debate on tax reform. The first chapter of the report provides an overview of tax reforms that Member States implemented over the past year. It shows that many Member States continue to take measures. While the measures often represent steps in the right direction, in many cases further reforms might still be warranted to address the challenges faced.
Chapter two examines the role that taxation can play in addressing consolidation needs and explores ways to make tax structures more growth-friendly. Some Member States still face a significant consolidation challenge and increased taxation may be of help in some cases. Any revenue increases should be carefully designed. With regard to tax structures, there is room in several Member States to limit barriers to growth and job creation by shifting the burden away from labour to sources of revenue that are less detrimental to growth.
Chapter three takes an in-depth look at the size of tax bases, which is an important factor in improving tax systems. While some well-designed tax expenditures – favourable regimes or tax exemptions – can enhance positive spillovers and welfare, a system founded on broader tax bases and lower rates is generally more efficient than a system characterised by narrow bases and higher rates. In view of this, the report examines the efficiency of housing taxation, the debt bias in corporate taxation, commonly used tax expenditures in direct taxation and the VAT base. A main conclusion is that exemptions and preferential rates should be the subject of ex ante and regular ex post evaluation.
Chapter four finally presents an in-depth assessment of three specific items, namely environmental taxes, tax compliance and governance, and the link between the tax system and income equality. With regard to equality, the report illustrates the significant role that tax and benefit systems play in shaping the income distribution.
Member States' ongoing efforts to consolidate, improve the quality of public finances and to foster sustainable economic growth and employment mean that tax issues are likely to be a key issue for the foreseeable future. We hope that the analysis contained in this report will make a relevant contribution to the discussions.
challenges in each area. It also includes an indicator-based assessment, which gives an initial indication of Member States’ performance in each area.
The report’s review of recent tax reforms shows that Member States have increased the overall tax burden in recent years, as part of a policy of fiscal consolidation. In 2014 the tax burden is expected to stabilise. During this reporting period, many Member States reduced the tax burden on labour. Reductions in taxes were often aimed at specific groups, such as low-income earners. Increases in labour tax were less common, with most taking the form of the removal of tax reliefs and allowances. Some Member States also increased personal taxes on passive income.
The general trend in corporate income taxation was towards a narrowing of the tax base, as Member States sought to stimulate investment and competitiveness in difficult economic circumstances. A minority of Member States however broadened the base for corporate tax, mainly by restricting loss reliefs and interest deductibility. A small number of Member States reduced their headline corporate tax rates.
Many Member States increased consumption taxes, notably by raising reduced tax rates or applying the standard rate more broadly, although there were a number of reforms that stood out as exceptions to this trend. A significant number of Member States also increased environmental taxes, but these reforms tended to have a relatively limited budgetary impact. Of those Member States that have some form of tax relief for mortgage interest payments, the majority reformed their systems so as to reduce the incentive to take on debt. Only a small number of Member States reformed their recurrent property taxes. All Member States introduced measures to fight tax fraud and tax evasion and to improve tax compliance.
In the chapters on the main challenges relating to tax policy, the report first discusses ways to reduce the taxation of labour, and considers whether there is need and scope for using taxation to improve public finances. The tax burden on labour is relatively high in the EU. Reducing this burden, particularly for specific groups such as low-income earners would have positive consequences for many Member States. The critical question however is how to finance such measures. The report notes that reducing labour taxes without offsetting the loss in revenue in is not a feasible option given the risk it would pose to public finances. Lower labour taxes therefore need to be compensated by increases in other sources of revenue, or by a reduction in public spending. Several Member States where there is currently a high tax burden on labour (overall or for specific groups) would have scope to increase taxes that are less detrimental to growth, such as taxes on consumption, recurrent taxes on immovable property, and environmental taxes. These Member States could consider a shift away from labour on to other tax bases. Despite some such measures having been introduced, the group of countries in this situation remains largely the same, suggesting a need for further reforms.
There are a number of Member States that have not yet fully secured the sustainability of their public finances, and they must therefore find an appropriate balance between cutting expenditure and raising revenue. A small number of these Member States appear to still have scope for raising taxes — their overall tax levels are low, and, either taxes have not increased significantly over the past few years, or taxes less detrimental to growth are relatively low. The group of countries in this category has changed over time, reflecting the efforts made by Member States to consolidate public finances.
of this, the report examines the efficiency of housing taxation and of VAT, the debt bias in corporate taxation and tax expenditures in direct taxation.
Member States have several options open to them in terms of how to improve the efficiency of taxation on housing. Recurrent taxes on immovable property are among the taxes least detrimental to growth but account for only 3.8 % of total tax revenue in the EU. Increasing such taxes could therefore be a potentially effective strategy for governments looking to consolidate their finances or to finance a shift away from labour taxes. Recurrent taxes on immovable property are less distortive than property transaction taxes, and a number of Member States could therefore benefit from a shift within the taxation of residential property. The report observes that around one third of Member States provide tax relief for mortgage interest payments, a policy that can encourage household indebtedness and overinvestment in housing, can push up house prices, and can lead to an increased risk of financial instability if not complemented by corresponding taxation of imputed rents (or recurrent property taxes). Furthermore, the measures in place in a number of Member States are regressive. Recognising these problems, many of the Member States concerned are in the process of reducing the generosity of the tax relief on mortgages. Dedicated indicator values in the report also show that the difference in the cost of homeownership between EU Member States is significantly influenced by the applicable tax provisions, and the substantial variation in the contribution they make to the cost.
In a large majority of Member States, it is possible to deduct interest payments from corporate income taxes but there is no equivalent provision for the return on equity. The report identifies a number of Member States where the difference in the treatment of the two is especially large, which can create a bias towards the funding of new investment through debt, rather than equity. This asymmetry can encourage excessive leverage in the corporate sector, can lead to higher volatility in the business cycle and can create opportunities for international tax avoidance. The debt bias can be addressed either by limiting the deductibility of interest costs, or by extending the deductibility to equity costs.
The report highlights the benefit for Member States of regularly carrying out a systematic review of their tax expenditures. Tax expenditures include a wide range of specific tax provisions, such as exemptions, allowances, reduced rates and other special regimes, which are all widely used throughout the EU. The report reviews some of the most commonly used tax expenditures in areas such as employment, pensions, education, housing and research and development. While some well-designed expenditures can enhance positive spillovers and welfare, it is important to ensure that they do not cause economic distortions and that they are the most cost-efficient means of achieving economic and social policy goals. VAT is acknowledged to be among the taxes least detrimental to growth. In practice, however, EU Member States collect VAT revenue far below the level that would be reached were there no exemptions or reduced rates. Around a quarter of Member States have a VAT revenue ratio significantly below the EU average. This ratio compares actual VAT revenue with the revenue that would be collected if the standard rate were applied to all final consumption. Member States could narrow this gap by limiting the use of reduced rates and non-compulsory exemptions.
In the final chapter, the report presents an in-depth assessment of three specific items, namely environmental taxes, tax compliance and governance, and the link between the tax system and income equality.
Environmental taxation is not only a relatively growth-friendly source of revenue, it can also contribute to reaching environmental targets. The report identifies a group of around a third of Member States the design of whose environmental taxes offers particular scope for improvement. Specific measures they could introduce include adjusting the level and structure of fossil fuel excise duties so as to reflect the
In addition, there are around a third of Member States that could consider making additional use of tax instruments to achieve their targets for reducing greenhouse gas emissions.
All Member States are carrying out reforms to improve tax compliance, i.e. to ensure that the full amount of taxes due according to the law is actually paid. Nonetheless, the report identifies a significant number of Member States that need to do more to address issues in this area. It is important to find a good balance between preventive measures that promote voluntary compliance and corrective measures such as audits and fines. The report identifies Member States where the administrative cost of collecting and paying taxes is relatively high, and where the efficiency of tax administration could therefore be improved. The report also presents findings on the evolution of inequalities within society. Although inequality as measured by market income (income derived from work and capital) rose significantly in the EU during the crisis years 2008-12, income inequality after taxes and benefits changed relatively little. At least until 2012, tax and benefit systems were able to contain a significant part of the increase in market inequality in most Member States. The picture presented varies significantly between countries however, and some Member States have suffered from rising inequality even once tax and benefits are taken into account. Furthermore, low-income households in some Member States have seen their circumstances deteriorate disproportionately. Even moderately, or not disproportionately, declining incomes tend to imply greater economic hardship for these households. These developments may explain the general perception of a growing inequality in income that is not fully reflected in aggregate statistical measures.
General for Economic and Financial Affairs and for Taxation and Customs Union. The report focuses on policy issues relevant for economic surveillance.
The purpose of the report is fourfold. Firstly, it reviews the most important tax reforms recently implemented in EU Member States.
Secondly, it discusses a number of challenges relating to tax policy that may affect macroeconomic performance, in terms of growth, employment, public finances and macroeconomic stability. As part of this, the report includes an indicator-based screening of Member States’ performance in several policy areas. This provides a useful tool for identifying relevant policy challenges, as part of the EU’s multilateral surveillance. An essentially mechanical assessment such as this will always however need to be interpreted together with in-depth country analysis, before any firm conclusions on policies can be made.
The in-depth analysis referred to above is carried out as part of the European Semester cycle. The Semester is launched every year with the Annual Growth Survey, a document setting out broad policy priorities for the EU as a whole. The 2014 Annual Growth Survey emphasised the importance of redesigning tax systems by broadening tax bases and shifting the tax burden away from labour onto tax bases linked to consumption, property and environment. It also highlighted the need to improve tax compliance and strengthen tax administrations. The various phases of the Semester process all feed into the country-specific policy recommendations, issued for each Member State as the conclusion of one year’s cycle. In July of this year, the Council issued one or more recommendations in the area of taxation for a large majority of Member States.
growth, employment, and social equity. This will encourage the exchange of best practices on tax reforms.
Lastly, the report contributes to an informed dialogue with civil society on what is generally considered a sensitive topic. This is particularly relevant in the current economic context.
Structure of the report
The structure of the report has been kept largely the same as in previous years, to allow for easy comparison. The discussion of policy challenges has however been divided into three rather than two chapters (chapters two, three and four) so as to make the report more easily navigable for readers with a specific interest.
A new feature in this year’s report is the inclusion of tables in Chapter 2 that compare the results of the indicator-based screening with last year’s performance. The individual chapters have also been improved by the addition of new elements and more thorough analysis.
Chapter 1 provides an overview of the most important tax reforms implemented by Member States from mid-2013 to mid-2014. Chapter 2 examines the role that taxation can play in meeting the need for consolidation and discusses ways to make tax structures more growth-friendly. Chapter 3 presents an in-depth assessment of the areas to be considered in the context of broadening tax bases: housing taxation, the debt bias in corporate taxation, tax expenditures in direct taxation and VAT. Chapter 4 examines specific challenges related to the design of environmental taxation and to tax governance and discusses the issue of income inequality and taxation. It also includes a general overview of the current challenges in the area of tax policy, summarising the most important findings from Chapters 2, 3 and 4.
reform seen in the period from 2013 to mid-2014, across EU countries. It also briefly discusses the expected change in total tax revenue. (1) An overview of the main tax reforms introduced in each Member State is given in Table 1.2 at the end of the chapter. (2)
Instead of categorising the reforms according to the type of tax concerned, this chapter groups them so as to reflect the area of focus or objective they are intended to address. The categorisation thus reflects the main messages contained in the 2014 Annual Growth Survey and the associated country-specific recommendations: labour taxation and tax shifting, broadening of the tax base, competitiveness and environmental concerns, immovable property taxation, and tax compliance and tax administration.
1.2. MAIN TRENDS IN TAXATION
As part of fiscal consolidation, Member States have in recent years increased the overall tax burden (comprising direct and indirect taxes and social security contributions), as illustrated in Graph 1.1. Taxes have been increased across the board, as described in recent years’ reports on tax reforms. In 2014 the tax burden is expected to stabilise.
The specific reforms introduced in Member States between mid-2013 and mid-2014, see Table 1.1, show that many Member States have taken measures to increase indirect taxes. Consumption taxes and, to a much lesser extent, environmental taxes — both considered to be among the taxes less detrimental to growth — have been increased in a large majority of countries. Nonetheless,
(1) Based on the Commission’s 2014 spring forecast, with data from the annual macro-economic database.
(2) This chapter draws on Garnier et al. (2013 and 2014) and on information provided by Member States in their national
the standard rate), some also, at the same time, enacted measures introducing new reduced rates or extending the application of reduced rates to new categories of goods and services. Moreover, around a quarter of Member States have decided to rely on increases in the statutory rates rather than on a broadening of the VAT base, for example by narrowing the application of some inefficient reduced rates. Most of the increases in environmental taxes reported relate to excise duties on energy products, with a limited budgetary impact.
Graph 1.1: Evolution of tax revenues (EU, percentage of GDP)
12.0 12.2 12.4 12.6 12.8 13.0 13.2 13.4 2010 2011 2012 2013 2014
Indirect taxation Direct taxation Social security contributions
Note: 2014 data is based on the Commission’s 2014 spring forecast. Data refer to tax revenues to general governments, excluding indirect taxes levied by national governments on behalf of EU institutions. Data is based on ESA95 methodology.
Source: European Commission annual macroeconomic database.
In the field of labour taxation (personal income tax and social security contributions), more countries decreased than increased the tax burden (measured as a percentage of GDP). As described in more detail below, many of the measures introduced to reduce the tax burden on labour were focused on specific groups, such as low-income earners. Of the Member States that have some form of tax deduction on mortgage interest, a majority have reformed their systems so as to reduce the incentive to take on debt. A small number of Member States made changes to their recurrent taxes on immovable property, with both increases
order to stimulate investment in or improve the competitiveness of certain sectors. A small number of countries also reduced their headline corporate tax rates. There were also countries which broadened the corporate income tax base, mainly by restricting loss relief and interest deductibility. The majority of Member States took further measures to fight tax fraud and evasion and to improve tax compliance.
Table 1.1: Tax changes adopted from mid-2013 to mid-2014
Statutory rates Base or special regimes
Increase AT, ES, PT AT, BE, CZ, EL, FI, FR, HR, IE, LT, NL, SE, SI Decrease BG, EE, EL, MT,
NL
BE, BG, CZ, DK, DE, EE, ES, FI, FR, IT, LT, LV, MT, NL, SE, RO, SI, UK* Increase BE, DE, EL, FR,
PT, SK
AT, BE, EL, ES, FI, FR, HR*, LT, LV, PL, SE, SK Decrease DK, EE, FI, FR*,
ES*, PT, UK, SK
AT, BG, BE, EL, ES, FR, HR, IE, IT, LT, LV, NL, PT, RO, UK Increase CY, HR CZ, EE, HR, HU, RO, SK Decrease AT, EE*, IT, LV,
RO
BE, ES, FR, HU, LV, SE, SI, SK, UK Increase CY, FR, IT, LU*,
PL(**), SI
BE, CY, DE, DK, EE*, EL, FR, HR, IT, LU*, PL(**), SI
Decrease BE, DK, EL, ES, FR, IE(**), LT, RO Increase
BE, CY, BG, EE, ES, FI, FR, HR, IT*, LV, MT, NL, PL, RO, SI BE, EE*, FR Decrease BG, DK, DE, HR, UK Increase
AT, BE, CZ, DE, EE, ES, FI, HR, IE, IT, LT, LV, MT, NL, PL, PT, RO, SE, SI, UK Decrease DK, UK Increase
AT, BG, ES, FI, FR, HR, HU, IT, LT*, LV, NL, PT, SI, UK
BE, CY, FR, NL, UK Decrease BG, IE DK, MT, UK Increase EL, IE, IT, CY,
LT, NL, RO CY, ES, HR*, UK Decrease EL, IT EE, LV, MT
Personal income tax
Corporate income tax
Social security contributions
Value added tax
Excise duties Energy products and electricity Tobacco, alcohol and sugar etc. Environmental taxes (excluding excise duties on energy)
Property taxes
Note: The table encompasses tax changes implemented or adopted from mid-2013 to mid-2014 including temporary changes. Tax measures are reported individually and not consolidated based on their budgetary impact. Announced changes are marked with a star (*). New taxes are listed as an increase in statutory rate. In VAT, only changes in the standard rate are reported as rate change; any other change (including changes in the level and scope of reduced rates) is considered a change in base/special regime. Special tax regimes include measures designed for targeted groups. Countries marked with (**) are Member States that decided to maintain a temporary measure. If the initial measure was a temporary tax reduction for a given period, the decision to extend this measure is reported as a decrease and conversely.
Source: European Commission.
1.3. LABOUR TAXATION AND TAX SHIFTING
In the context of the economic crisis and, especially, given the current high levels of
recruit, and from the perspective of fairness. This latter aspect has recently taken on greater importance, influencing reform programmes in several Member States. Reforms relating to labour taxation can take one of two forms (which can be complementary): (i) a general decrease in overall labour taxation; and (ii) a targeted reduction in the tax burden placed on the most vulnerable groups in the labour market.
Between mid-2012 and mid-2013, a third of Member States introduced targeted reductions in labour tax. Over the last twelve months, from mid-2013 to mid-2014, the number of countries implementing such measures increased further. The generally preferred approach of the Member States who chose to reduce taxes on labour in the most recent reporting period was to increase the tax-free allowance or the tax credits offered within the personal income tax system. Thirteen countries — Belgium, Bulgaria, Denmark, Germany, Estonia, Italy, Latvia, Lithuania, Malta, the Netherlands, Finland, Sweden and the United Kingdom — took such a measure. The fact that these reductions in the tax burden direct the benefit towards the employee could be interpreted as a reaction to the nascent recovery and as a shift in policy, with greater emphasis being placed on the need to improve the living standards of disadvantaged groups in society. At the same time, a small number of Member States introduced measures to alleviate the tax burden on employers providing employment for people ‘on the margins’ of the labour market, such as the long-term unemployed in Slovakia and low-income earners in Belgium. Hungary extended the duration of the reduction in employers’ social security contributions for mothers of at least three young children.
A number of Member States also implemented across-the-board measures (affecting both low and higher earners), mostly relating to social security contributions. This was the case for Estonia, France, Italy, Latvia, Hungary (3), Austria and
Romania (4).
The trend for increases in labour tax that emerged at the height of the economic crisis — targeting higher earners in particular, in the form of surtaxes on high incomes, new tax brackets for top earners and increases in the top-band rate of personal income tax — appears to have run its course. Labour tax increases were relatively scarce in the time period covered in this report, and mostly took the form of restrictions of tax credits or tax reliefs benefiting higher earners (Belgium, Ireland, France, the Netherlands and Austria) or a restructuring of tax rates (Portugal). In addition, Croatia and Cyprus increased social security contributions, Estonia increased the minimum level of social security contributions, and Slovenia abolished a tax allowance for older taxpayers. It should be noted that in several countries where increases to personal income tax or social security contributions were seen, these mainly or exclusively affected passive income and not labour income (the Czech Republic, Croatia, Lithuania, Hungary, Austria, Portugal, Romania, Finland and Sweden).
When public finances are strained, there is often no scope for reducing the tax burden on labour independently. Instead, governments are obliged to offset the lost revenue by reducing expenditure or by shifting the burden from labour onto taxes that are less detrimental to growth, such as taxes on consumption, pollution and property. Those Member States facing the greatest fiscal constraints and, therefore needing to increase overall revenue for the purpose of consolidation, are unlikely to be in a position to reduce labour taxes at all. These countries could still, however, ensure a relative shift in taxes away from labour by not increasing labour taxes while increasing taxes less detrimental to growth more substantially. In the period under consideration in this report, Member States increased VAT (Spain, France, Italy, Cyprus and Slovenia), excise duties on fuels (Belgium, Bulgaria, Estonia, Spain, France, Croatia, Italy, Cyprus, Latvia, Lithuania, Malta, the Netherlands, Romania and Slovenia) and excise duties on tobacco and alcohol (Belgium, Bulgaria, the Czech Republic, Denmark, Estonia, Spain, Croatia, Italy, Latvia, Lithuania, Malta, the
Importantly, there seems to be a growing level of acknowledgement that revenue-raising tax reforms should not, if possible, be at the expense of the poor. Many reforms have therefore been designed with social concerns in mind, and aim to benefit low-income earners in particular, even when the fiscal scope is limited.
1.4. BROADENING OF THE TAX BASE
In many Member States, there is scope to broaden tax bases, and thus to increase the potential for revenue collection, open up the possibility of reducing standard tax rates and/or simplify the tax system. Most tax systems contain various exemptions, allowances, reduced rates and other specific regimes, known as ‘tax expenditures’. These tax expenditures may not always be justified and in some cases may not be the most efficient tools to achieve their social, environmental or economic objectives, as discussed in section 3.3. Countries broadening the tax base have tended to focus on measures that simplify the system, where VAT is concerned. For personal income tax and corporate income tax the trend is less clear. In many cases where Member States increased statutory tax rates, broadening the tax base may in fact have been a more effective strategy.
1.4.1. Value added tax
A number of studies (5) illustrate the welfare gains that can be achieved by means of broadening the VAT base.
Almost half of Member States (Belgium, Denmark, Germany, Estonia, Greece, France, Croatia, Italy, Cyprus, Luxembourg, Poland, and Slovenia) have recently broadened their VAT bases or increased the reduced rates applied to certain goods and services. In Belgium, for example, legal services became subject to standard VAT as of January 2014. Also Italy has lowered the scope of application of reduced rates for specific goods or services. France and Slovenia have increased their reduced VAT rates. At the same time, however, eight Member States
new reduced rates, lowered their existing reduced rates, or extended the scope of their application to cover additional goods or services, with, in some cases, significant budgetary consequences. France, for example, now applies its reduced VAT rate to energy and services related to social housing and to cinema tickets. The Czech Republic proposed moving certain items onto one of the lower rates of VAT, instead of, as initially planned, replacing the various different rates with a single rate. (Legislative measures for a single VAT rate had been adopted but were subsequently repealed.) Lithuania extended the 5 % reduced VAT rate for pharmaceuticals and medical aids indefinitely. The VAT rate on household electricity consumption in Belgium was reduced from 21 % to 6 %, with effect from April 2014. Generally such measures run counter to the objective of simplifying the tax system and broadening the tax base.
Around a quarter of Member States, meanwhile, decided to increase their standard VAT rates. These included France, Italy, Cyprus, Luxembourg and Slovenia. Poland chose to maintain its temporary increase in VAT.
1.4.2. Personal and corporate income tax Extensive use of tax expenditure in personal and corporate income tax may introduce differences in the treatment of taxpayers. These types of tax break could make the system more complex and can increase compliance and administrative costs. Some countries have increased their personal income tax bases (Belgium, the Czech Republic, Ireland, Greece, France, Croatia, Lithuania, the Netherlands, Austria, Slovenia, Finland and Sweden) and/or their corporate income tax bases (Belgium, Greece, Spain, France, Croatia, Latvia, Lithuania, Austria, Poland, Slovakia, Finland and Sweden).
France made efforts to reduce tax expenditure: several tax benefits, such as the family allowance (based on income splitting) and the exemption for child-related pension bonuses, have been reviewed or abolished, in order to help lower the budget deficit. In Ireland, tax relief on medical insurance premiums will be restricted and tax relief on loans
of service vouchers, a system for paying for household services which entails a tax deduction on the amount spent.
In general, most Member States narrowed the tax base for corporate income tax, but a number of countries did also broaden the base. In some cases, reforms were introduced containing both measures to narrow and to broaden the tax base. At first sight, this may seem contradictory, but it actually hides two separate trends: on the one hand, Member States narrowed their tax bases in order to stimulate competitiveness, in some cases of particular sectors (e.g. by extending tax credits for research and development or for the film or tourist industries); on the other hand, they broadened the tax base by restricting loss relief (Greece, Lithuania and Slovakia), or so as to limit opportunities for tax avoidance. Poland, for example, extended the scope of corporate income tax to cover certain forms of partnership used for avoiding taxes; Spain made impairment losses on share capital held in other entities and permanent establishment losses non-deductible, in order to avoid the same losses being deducted twice; Austria now only allows full deduction of interest and royalties payments in cases where the receiver will be subject to tax at a rate of at least 15 % on the amounts in question. Other Member States introducing measures to tackle tax avoidance included Slovakia, which introduced a minimum corporate income tax rate together with a decrease in the headline rate, and Belgium, which introduced a ‘fairness tax’ — a minimum tax for large companies that take advantage of the notional interest deduction and/or carry-forward losses. Payment of this tax is triggered by a dividend distribution where the profits being paid out have effectively not yet been taxed.
1.4.3. Addressing the debt bias
A large majority of corporate tax systems still favour debt over equity financing by allowing the deduction of interest costs while making no similar provision for equity returns. Corporate tax therefore creates a bias towards debt financing. Favourable treatment of debt may create significant risks, as it gives companies an incentive to take on debt. It may also erode the tax base by
removing or restricting interest deductibility (e.g. by introducing a system of comprehensive business income tax) or by introducing an allowance for corporate equity which counteracts the effect of the treatment of debt finance by offering a tax deduction on normal returns on equity (see section 3.2. for a discussion of this point).
A number of Member States having already started addressing the problem of debt bias in corporate taxation continued to take action in this area. The measures introduced have mainly focused on restricting the level of deductible interest. In Finland, new rules limiting the deductibility of interest on intra-group loans came into force in January 2014. The rules stipulate that net interest of below EUR 500 000 will always be deductible. Above this threshold, the deductibility is limited to 30 % of earnings before interest, taxes, depreciation and amortisation (EBITDA). Greece also introduced measures limiting deductible interest based on EBITDA. The measures apply to all companies, for amounts above the threshold of EUR 3 million (EUR 5 million until the end of 2015). A number of countries adjusted the thresholds for interest deductibility, while others modified their rules on allowances for corporate equity (Belgium and Italy). Italy introduced an incremental ACE incentive (so called ‘super ACE’) for companies that decide to list themselves on an official EU or EES stock market(6). In France, as of 2014, deductibility is limited to 75 % of net interest above the threshold of EUR 3 million. Portugal lowered the threshold above which limitations on deductibility apply from EUR 3 million to EUR 1 million. Latvia abolished its allowance for corporate equity and Slovenia introduced changes to its thin capitalisation rules.
Addressing debt bias in housing taxation
In many Member States, interest paid on a mortgage to finance owner-occupied housing is partially or fully deductible from personal income
(6) The recently adopted Decree Law 91/2014 has strengthened some features of the ACE: for companies that decide to list themselves on an official EU or EES stock
tax, while the 'return' on the mortgage in the form of imputed rent for living in the house is not taxed. This may encourage household indebtedness, contribute to higher house prices and lead to an increased risk of financial instability, in particular in times of crisis. In many countries, the housing market is now emerging from a phase of downward adjustment, and significant efforts are being made to deleverage. Major changes in taxes on housing have therefore been focused on addressing the debt bias, by reducing the deductibility of mortgage interest (see section 3.1 for a discussion of this point). The majority of Member States that have some form of mortgage interest deduction have made changes to their tax system. Spain and Ireland chose to remove interest deductibility entirely for new mortgages (from 2013), while the Netherlands and Finland have taken measures to reduce it gradually. In the Netherlands, interest deductibility will only be available on new mortgages on owner-occupied dwellings if the principal is to be fully repaid within 30 years. Moreover, the maximum income tax rate to be applied for the deduction will be gradually reduced from 52 % to 38 %. From 2015, Belgium is to apply a fixed deduction rate of 45 %, in preparation for the transfer to the regions of additional fiscal powers, including the setting of tax reductions on owner-occupied dwellings. In Finland, the deductible part of mortgage interest will be reduced for homeowners from 85 % in 2012 to 50 % by 2018. Luxembourg and Estonia have both significantly reduced the maximum deduction. Greece brought the tax treatment of owner-occupied housing more into line with that of other investments, by introducing a 15 % withholding tax on capital gains on real estate in 2014.
1.5. COMPETITIVENESS AND ENVIRONMENTAL CONCERNS
1.5.1. Competitiveness
Facing concerns about declining competitiveness, many Member States introduced tax changes that they hoped would cushion the effects of the crisis. These were aimed in particular at helping small
included the introduction of more generous incentives for research and development and innovation, and for start-ups and small businesses. These types of tax incentive should be carefully designed so as to reduce windfall gains and promote the cost-effectiveness of the incentive. In addition, a small number of Member States reduced their headline tax rate on corporations (Denmark, Estonia, Finland and the United Kingdom), while others announced reductions in corporate income tax rate (Spain and France). Italy lowered the standard IRAP rate from 3.9% to 3.5%, and confirmed tax relief for new jobs created, by allowing deductions from the IRAP tax base for new workers hired with a permanent contract. In Slovakia and Portugal, reductions in the headline rates were accompanied by the introduction of a minimum rate (Slovakia) and by an extension of the extraordinary surcharges on high profits and the introduction of a reduced rate for smaller businesses (Portugal).
Incentives for research and innovation
A large majority of Member States apply tax incentives to stimulate private investment in research and development. This type of incentive has become increasingly attractive since the onset of the crisis. The trend reported last year of extending tax incentives for research and development in order to stimulate private sector investments continued into 2013-14. During this reporting period, around half of Member States introduced or announced changes to the tax support they offer for research and development. Latvia introduced a new form of tax relief for certain costs related to research and development which will apply from July 2014. Italy established a tax credit for R&D, targeted at firms with turnover below 500 billion euros, for the years 2014-2016.
The emphasis in many reforms appears to be on attracting top talent, by improving the incentives offered to those working in research and development (the Czech Republic, France, Italy, Portugal and Sweden). Sweden has reduced employers’ social security contributions for employees working in research and development. Italy introduced a tax credit for recruiting new
young, innovative companies, notably by extending exemptions from social security contributions to cover employees involved in innovative activities. The Czech Republic has extended the application of tax deductions for professional development of employees.
Other changes focused on improving the way in which tax incentives for research and development are used to help companies with insufficient profits to fund the necessary investment themselves (Denmark, Spain, Portugal and the United Kingdom). Denmark and the United Kingdom increased the maximum value of tax incentives for research and development that can be given as a cash payment (for small and medium-sized enterprises only in the United Kingdom) and Spain amended its rules on tax incentives so as to allow businesses to be reimbursed for unused credits. A small number of Member States also introduced quality control measures to ensure the relevance of the research and development being supported (Belgium, Austria and Portugal). Since 2013, the Austrian Research Agency has been assessing the scientific relevance of claims for tax credits for research and development on behalf of the Finance Ministry. Portugal introduced reforms in all three of the areas mentioned above, by extending the period during which unused credits can be carried forward, offering more generous tax deductions for employees holding PhDs and introducing mandatory audits by a research agency upon conclusion of a project. France has published an evaluation of its direct subsidies and fiscal incentives to R&D. (7)
It is important to evaluate tax incentives for research and development regularly, in order to ensure that they are cost-effective and achieve their intended objectives. An expert group commissioned by the European Commission issued specific guidance in 2009 for conducting such evaluations (8) but only a relatively small number of Member States evaluate the tax incentives they offer in this area on a regular basis.
(7) Lhuillery S., Marino M. et P. Parrotta, « Evaluation de l’impact des aides directes et indirectes à la R&D en
Incentives for entrepreneurship and investments
Several Member States introduced or extended tax measures aimed at incentivising entrepreneurial activity, investment in certain sectors or specific investments. Some Member States introduced tax incentives to stimulate reinvestment of profits, in particular for small companies (Ireland, Spain and Portugal). A small number of Member States tried to stimulate equity investment in small unquoted companies (Spain, France, Finland, Sweden and the United Kingdom). Sweden launched a new tax incentive for business angels in December 2013, whereby individuals acquiring shares in new or expanding small and medium-sized enterprises can deduct half of the amount of the purchase, up to SEK 650 000 per person and per year, from their net capital gains for the year. The United Kingdom introduced a new tax relief measure for investment in shares and certain qualifying debt instruments issued by social enterprises. A tax relief measure introduced to promote investment in ‘seed enterprises’ (small business not yet quoted on the stock exchange) was also made permanent. In addition, the United Kingdom announced an increase in the annual investment allowance from GBP 250 000 to GBP 500̴ 000 for an extended temporary period from April 2014 to 31 December 2015. The increase in the allowance will be effective for expenditure incurred on or after 1 April 2014. Italy introduced a 15% tax credit on expenses in equipment and machinery exceeding the previous 5 years average. Portugal granted a temporary corporate income tax credit limited to 20 % of investment expenses or EUR 1 million (corresponding to a maximum eligible investment of EUR 5 million), for investments made between 1 June and 31 December 2013.
A small number of Member States introduced or extended incentives relating to specific sectors, for example the cultural and creative sectors, in the case of Spain, Italy, Lithuania and the United Kingdom. Italy launched an ‘Artbonus’, a new tax credit designed to support cultural heritage (art and architecture, theatres and music foundations). The tax credit is awarded for up to 65 % of an investment in 2014, and up to 50 % in 2015 and
individuals and not-for profit taxpayers. Italy has also introduced a new tax credit to support digitalisation and modernisation of the tourist sector, and a 15 % tax credit on additional investment in machinery and equipment made within the year from the end of June 2014. At the same time, however, Hungary increased sector specific taxation. It introduced a new tax on advertising and increased the rate of the telecommunication tax and the financial transaction levy.
1.5.2. Environmental and health taxation
Many Member States could do more to accommodate environmental concerns within their tax systems. There is scope to make changes both to the levels of taxation and to the structure and design of environmental taxes. Tax expenditure that has a negative environmental impact also needs to be revised, e.g. reduced VAT on energy and the implicit subsidies in the tax regimes for company cars. In addition, many Member States also have scope to increase health-related taxes (i.e. taxes on products detrimental to health). Health- and environment-related excise duties can contribute to consolidation or can be used as an alternative source of revenue in place of more distortive taxes. Beyond this, they can also offer additional benefits by inducing changes in behaviour.
Continuing the trend from the previous year, a significant proportion of Member States increased excise duties on energy, albeit in many cases with limited budgetary consequences (e.g. Bulgaria and Latvia). In some Member States, however, decreases took place or were prolonged (Bulgaria, Denmark, Germany, Croatia, Latvia and the United Kingdom).
A number of Member States are relying increasingly on taxes on pollution and resources. Italy, for example, introduced, taxes on waste, Lithuania announced a similar tax and Hungary extended its existing measures. Latvia increased the existing taxes on natural resources and introduced two new taxes in this area, and Spain introduced a tax on fluorinated greenhouse gases.
for example, is changing the rates of tax on motor vehicles to better reflect their environmental impact. Croatia introduced special taxes on motor vehicles. Cyprus pursued its reform of the excise duties on motor vehicles, based on environmentally friendly principles (with carbon dioxide emissions being used as a reference). France proceeded to the hardening of its ‘malus automobile’, in order to promote the acquisition of environmentally-friendly cars. Estonia is also currently making changes to the taxation of company cars by reducing the VAT deductibility of company cars used for private purposes to 50 %. Portugal increased the corporate tax rate on expenses related to company cars, with the new rate coming into effect in 2014. In Italy companies can deduct 20% (down from the previous 40%) of the costs of cars available within the company for general use and 70% (down from the previous 90%) of the costs of cars assigned to an employee for business and personal use.
A small number of reforms also stand out as exceptions to the trends described above. Belgium introduced a reduced rate of VAT for household electricity consumption, Bulgaria reduced to zero the excise duty on electricity for households, the Czech Republic abandoned plans to introduce a carbon tax, the United Kingdom planned a freeze on fuel duty (to be effective as of September 2014) and removed some destination bands for air passenger duty, and France abandoned plans to introduce a tax on heavy trucks (eventually to be replaced by a toll transit for heavy trucks). Lastly, more than half of Member States have increased excise duties on tobacco, alcohol or sugar.
1.6. IMMOVABLE PROPERTY TAXATION
A number of Member States have begun shifting more of the tax burden onto immovable property, as recurrent property taxes are considered to be among the least detrimental to growth. Moreover, the measures introduced by some Member States are designed to make property taxation more progressive, by targeting higher-end properties so as to minimise the potential social impact.
property tax came into force in Ireland in July 2013. Residential properties are now subject to a tax rate of 0.18 %, up to the value of EUR 1 million, rising to 0.25 % on the excess above this threshold. In April 2013, the United Kingdom introduced changes to legislation on the taxation of properties with a taxable value over GBP 2 million owned by specified non-natural persons, in order to close certain tax avoidance loopholes. The threshold for this tax will be gradually reduced to GBP 500 000 in 2016. In 2014, Romania introduced a new tax of 1.5 % on the book value of specific types of building that were not already subject to local property taxes.
Cyprus increased the tax rates applicable to immovable property and also widened the property tax base in 2013. Spain extended the application of its surcharge on real estate taxation from 2013 to 2015. The Netherlands introduced a new tax on renting out social housing in 2013. This rate will increase from 0.381 % of the value in 2014 to 0.536 % of the value in 2017. Both Greece and Italy merged several taxes on immovable property into one in 2014. In Italy, houses are subject to a new tax (TASI) related to indivisible services supplied by local communities to occupiers, both owners and renters. In Slovenia, the new tax on immovable property was abolished in 2014 after a decision by the Constitutional Court.
A number of Member States reduced recurrent property taxes. In 2013, Estonia, Italy and Latvia reduced recurrent property taxes for specific groups: Estonia abolished the land tax on small and medium-sized residential properties; Italy excluded a person’s main or only residence (apart from luxury houses) from the recurrent property tax; and Latvia introduced a law allowing a possible reduction in property taxes for families with three or more children.
Only a small number of Member States (Greece, France, Italy, Cyprus, and Romania) have announced plans to update cadastral values. In many countries, the property values used for the purpose of taxation are out of date. As property prices can have changed quite differently in different regions, use of out-of-date valuations can create problems in terms of the equity of the tax.
revaluation of 4.9 million properties, in order to provide up to date valuations as a basis for the new property tax regime. The value used for calculating property tax still differs however from the market value in some cases, and the taxable values will need to be updated regularly, with due consideration given to the consequences of revaluations. With the enabling law for reforming the tax system, Italy will update the current cadastral values. The aim is to bring them in line with market values in order to improve fairness in property taxation.
A number of countries increased property transfer taxes while others reduced them. Recurrent property taxation on immovable property is generally considered more efficient than taxing transactions involving property, due to the frictions in the market which are created by the latter. Gearing the system towards recurrent taxes could help to improve the overall design of property taxation. The Czech Republic and Finland nonetheless increased property transfer taxes, introducing new rates of 2 % and 4 % respectively. Italy reduced the rate applicable to main or only residences to 2 % and increased the rate for other immovable property to 9 %, as of January 2014. In March 2014, the United Kingdom introduced the lower threshold of GBP 500 000 (previously GBP 2 million) for the 15 % tax rate applying to non-natural persons purchasing high-valued property. Having introduced a capital gains tax on immovable property, Greece reduced its real estate transfer tax to 3 % in 2014.
1.7. TAX COMPLIANCE AND TAX ADMINISTRATION
The fight against tax fraud, tax evasion and aggressive tax planning has been gathering pace across the EU. The political momentum behind these actions stems from the desire to make the tax system fairer and more efficient. Examples of the results of action taken by Member States include: in Spain, enforcement actions brought in additional revenue of EUR 10.9 billion in 2013, as compared with EUR 9.2 billion in 2011; in France, the additional revenue collected thanks to detection of
tax revenue of GBP 23.9 billion in 2013-14, an increase of about 30% compared with 2011 figures (GBP 18.6 billion). (9) Fighting tax evasion not only contributes to reducing the tax gap, it can also help tax authorities to meet two other critical objectives: making tax collection more efficient and reducing the compliance burden for taxpayers. While all tax administrations aim to improve their efficiency, in some Member States in particular, much more could, and should, be done, as illustrated in Chapter 4.
The issues of non-compliance with tax legislation and poor quality of tax administration are interlinked, and the measures needed to resolve both can be encompassed collectively termed ‘improving tax governance’: for example, in order to reduce tax evasion, a country might step up the checks it carries out, which may in turn increase the administrative burden of paying taxes. On the other hand, simplifying tax regulations and procedures for payment and helping taxpayers to fulfil their obligations can have a positive effect on tax compliance.
There is a general consensus that an efficient tax administration policy needs to include both systems for detection of tax fraud and tax evasion and measures to simplify the payment of taxes: on the one hand, detection of tax fraud or evasion — and sanctions for taxpayers who deliberately avoid paying taxes or make no active effort to comply with tax rules — on the other, simplification for those who want to comply but struggle with the complexities of the system. Finding an appropriate balance between the two can however prove difficult.
Member States took steps to improve tax governance during the reporting period 2013-14. The measures adopted included both systems to facilitate voluntary compliance and strategies for enforcement.
(9) 2011 values are from OECD, 2013, pp. 370-371. The sources of other figures are, respectively: for Spain, the national agency for tax administration, la Agencia Estatal