Implementation of Unbiased Stereology Method for
Organ Volume Estimation using Image Processing
Mohammad Ammar Faiq, Balza Achmad
Department of Nuclear Engineering and EngineeringFaculty of Engineering, Universitas Gadjah Mada Yogyakarta, Indonesia
[email protected] (corresponding author)
Ginus Partadiredja
Department of PhysiologyFaculty of Medicine, Universitas Gadjah Mada Yogyakarta, Indonesia
Abstract— Stereology had been widely used around the globe for estimating the value of the biological structure. It interlinks the connection between the dimensions using a sample that is 2D for a quantification in 3D structure. Volume estimation using stereology method is the most common and basic quantification that shows an example of how stereology works. Stereology method has a drawback when it comes to a lot of samples, so it is common for a researcher to use the computer to help to quantify and to do repetitive work, which is known as computer-assisted stereology quantification. The purpose of this research is to develop software that can assist researchers using stereology method for estimating the volume of a sample object from its 2D digital images with point counting method. The software was built based on the manual procedure of volume estimation using stereology method performed by experienced researchers. The volume estimation using the software were then compared with the results of the manual procedure by the experts on the same samples, i.e., the kidney and trigeminal ganglion of a rat. The experimental results showed that the relative difference of the volume estimations between manual and computer assisted calculations were 0.93% for rat kidney sample and 10.81%. TA1 trigeminal ganglion sample. Based on the results, the software estimation can be used for further analysis.
Keywords— volume estimation, Cavalieri principle, image processing, microscope image, stereology.
I. INTRODUCTION
Research in biological structure requires quantifying the value of geometric properties of the structure, such as volume, length, area, and number. Quantitative assessment of biological structure that has arbitrary structure often leads the researcher to assume the orientation and the shape of the structure [1] [2].
Stereology is a study that interlinks the geometry between a 3D structure with a section that has 2D geometrical structure [3]. The 3D geometrical structure can be analyzed as a set of sectioned samples of the structure in 2D. It is constrained by the probability, sampling, and stochastic geometry, hence the estimation value using stereological method can approximate real value of the information from the structure.
Unbiased stereology method for volume estimation using Cavalieri technique with point counting is one of the most common of stereology in the term of geometrical analysis, such as in [4][5][6]. Because of its efficiency and assumption-free method as in [7][8], stereology has been widely used in
research for Volumetry and Planimetry and be considered as ideal standard among researcher for volume estimation [9][10].
When dealing with a lot of samples and sections, manual point counting and calculation in stereology method tend to be tedious, tiring, and time-consuming. For this reason, many researchers in the field of stereology used computer-assisted stereology method.
There is some software for computer-assisted stereology method analysis, such as STEPanizer [11], Stereology Investigator, NewCAST, Stereologer system, Stereology Research Center [12]. The purpose of this paper is to design and build a graphical user interface (GUI) on Windows operating system, to assist researcher that used stereology method for volume estimation using Cavalieri technique with point count, namely STevo. The developed software used OpenCV library to do image processing on digital images of the sectioned samples.
This paper consists of four sections for designing and building computer assisted software for estimating volume using stereology method. The first section of this paper consists the background of this research. The second section explains the stereological method for estimating volume in general and how to do quantitative assessment using Cavalieri technique with point counting in stereology manually without computer assistance. Software pseudo code, the workflow in using the software, as well as the software features are also explained in this section. In the third section, we show the experimental results and the comparison between manual quantitative assessment and computer-assisted software using biological tissues samples, i.e., the kidney and trigeminal ganglion of a rat. The last section provides
II. MATERIALSANDMETHODS
The volume estimation value in stereology uses Cavalieri technique with point counting method. Cavalieri technique was first invented by Bonaventura Francesco Cavalieri. Cavalieri tried to estimate the volume of the hull of a ship by multiplying the sum of the cross-sectional areas of the hull of the ship, measured at regular intervals along the length of the ship, by the distance between the cross sections [13]. Cavalieri concept of estimating volume was later developed by a researcher in the field of stereology by combining Cavalieri technique with point counting method for the estimation of the area.
A. Cavalieri Technique using Point Counting
Stereology Cavalieri method with point counting is a quantitative assessment on 2D sections of the structure to estimate the volumetric value in 3D structure [2]. Volumetry in a biological structure that has an arbitrary shape will be difficult to analyze regarding the correlation between the orientation and the shape of the structure because not all of the object that appears in 2D represents the structure in 3D. Take an example in Fig. 1; although the object in 2D appears as a circle, the structure in 3D appears as a cylinder.
Fig. 1. Example of 2D section representation
Cavalieri method is capable in estimating the volume of the structure through a set of the 2D sections in the 3D structure by utilizing a systematic uniform random sampling (SURS) [14] either in sampling the set of the sections or in sampling the area of the section.
In general, Cavalieri technique to estimate volume value of a structure in 3D uses equation (1).
s v n
A
n Δ × =∑
=1 (1)where n is the section number, An is the area of section n, ∆s is
the section thickness.
The sum of each section area in Cavalieri estimation volume is calculated using the probability of a point that represented a certain fixed square area for hitting the analyzed structure to estimate the real arbitrary area of the structure. Whether or not each point per square area hit the real arbitrary area of the structure, the point will be counted as 1 or 0 following the probability principle of the test point hitting the object [13].
The sum of points per square area that hit the real arbitrary area is then counted. Therefore, the estimation of the area of the structure will be quantified by summing the sum of the points in each section. To estimate volume value with Cavalieri technique using point counting method, the formula can be written as equation (2).
s
A
P
v
p n n×
×
Δ
=
∑
=1 (2)where Pn is the number of points hitting the analyzed structure
in section n, Ap is a fixed area represented by a point.
B. Manual Stereology Volume Estimation
The actual implementation of Cavalieri method in sample section without computer assistance need a lot of preparation and time before starting. Before designing and building STevo, we need to know how a quantitative assessment without computer assistance is performed using Cavalieri technique with point count. In this paper, manual quantifications were performed by researchers who were experts in the field of stereology.
The first and foremost part of the stereology assessment is preparing a sample. Sampling sectioning [15] and tissues shrinkage [16] are among the most important aspects of the reliability and accuracy of stereology analysis. The sample was cut into several sections using microtome. After that, the sectioned samples were captured in the images hence the sample could be processed later using Cavalieri method. The images were captured using a digital microscope equipped with a camera and micro steppers.
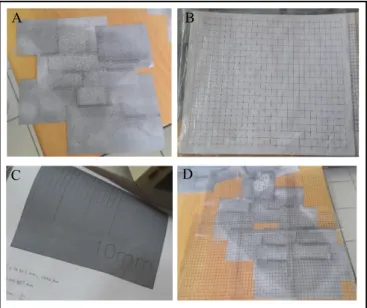
For manual quantitative assessment using Cavalieri method with point count, the most tedious and tiring things to do is testing the probe on each section of the images, especially in the Cavalieri method which uses the point as the probe. To be able to do a manual assessment, the researchers need to print so many images of section and grouping each image for each section and samples (Fig. 2). And then researchers also need to print probe or grid in transparent film paper to be able to use it on the images. After all the printing is ready, the magnification of the printed images of the section needs to be calibrated using stage micrometers to be able to know the scale ratio of the printed grid relative to the magnification of printed images. Calibration will be done by printing an image of stage micrometers using the same microscope that uses same magnification on the sample images.
After each printed section images and point grid were calibrated, point counting process on the area of interest began. This process began with marking the counted region of interest that in the area of the interrogated structure. This process was needed because not all of section images were part of the structure.
Subsequently, a printed point grid was placed on the printed section images. The point that hit the area of the structure or within the marked area in the section images were counted and summed for each printed section images. In this process, the researcher needs to be meticulous and focus on counting each point for every section. The total sum of points from every section was used for determining the estimated value of sample volume using (2).
3D Structure 3D Structure
2D Section 2D Section
Fig. 2. A. Printed section images; B. Printed grid; C. Printed stage micrometer; D. Grid placement on printed section images for point counting.
C. Software Algorithm and Design
The software algorithm follows the workflow of manually calculated Cavalieri method after the sample images ready to be processed. Before designing software algorithm, it is necessary to list everything that needed to be done in the software.
Firstly, the software needs to load and show the image of the sections for marking the counting region of interest that in the area of the structure that researchers want to analyze. In the marking method, the software should also be able to exclude the non-counting area for the case of the structure has an area inside the area-of-interest that is not a part of the structure, such as the structure of a donut.
The software requires the user to input some parameters such as section number, section thickness, image resize factor, microscope magnification (in mm/pixel) or calibrated pixel width and height, as well as shrinkage factor. Point probe or grid size in pixels will be defined by the width inputted by the user. The size value of the grid will be calibrated automatically using the value of calibrated pixel inputs.
Point testing in the region area of interest also needs to be done by the software automatically. The point will be automatically counted based on marked regions. The points that have been analyzed must also be able to be re-evaluated by the user if there are doubts whether the points are parts of the structure or not. For each section, the number of points that were marked as the part of the structure is saved for later use in estimating the total volume of the sample.
Lastly, the software also needs to calculate the total volume of the sample using equation (2). The workflow of STevo algorithm, in general, can be seen in Fig. 3.
There are few steps that need to be performed before and after doing stereology volume estimation analysis, e.g., sampling, sectioning, and calculating the coefficient of error.
Not all steps are covered in the software. STevo was built only to help the researchers specifically in term of point quantification and probing hence they do not need to print the images of the section samples and perform manual probing in stereology volume estimation.
Load Image
Input calculation parameter
Marking area of interest
Create point grid by user preferences
Automatic point count
Saving current image section point count
Processing the other images section Calculating volume estimation Yes No End Start Stereology volume estimation results
Fig. 3. Workflow diagram of Stevo A A B B C C D D
D. Pixel Calibration
Before using the software, a pixel in the image needs to be calibrated using stage micrometers. By using the same magnification for capturing sample images, stage micrometers images will be captured and then calibrated. For more detailed explanation see Fig. 4. Calibrated pixel will be obtained by converting stage micrometers scale and division for pixel width or height of the images. In Fig. 4B, the pixel is calibrated at 1 mm equals to 1000 pixel in the stage micrometer image. Hence 1 pixel equals to 0.001 mm or 1 µm.
Fig. 4. A. Stage micrometer; B. Converting pixel size using stage micrometer image
E. Random Grid
Random grid stereology has been proven to be more consistent, accurate and efficient for Volumetry [17]. When there are a lot of repetitions and samples, the random grid is more accurate than the fixed grid [18]. STevo 2D random grid placement uses a random number between the width and height of the grid that the user had already inputted before.
F. Image Processing in STevo
STevo was built based on the mentioned specifications by using c++ programming language with OpenCV 3.0.1 as an image processing library. The graphical user interface (GUI) of STevo was built along with image processing activity. Image processing techniques that used in this software comprise converting the images into OpenCV matrices, drawing the image in the GUI, image scaling, and pixel detection. When a section image is loaded, the software will automatically create a matrix which later will be used for image processing. The image is then drawn in the GUI and will be used for marking the area of interest and drawing point grid. Images scaling is necessary if the size of the image is too big that makes the processor works too hard and the process needs a long time to do. Pixel detection will be used for evaluating every point grid so that it can automatically be counted if hitting the region of the marked structure. Fig. 5 shows the flowchart of image processing in the developed software.
Start
Load and convert an image to cv::mat
Duplicate image for drawing and image processing Drawing marker of region on section image and duplicated
image
Drawing grid on section image Testing point grid on marked
duplicated image
Drawing point that hit and not hit the area
Re-evaluate point grid
Yes Counting point that hit and not
the area
Point count (ΣP)
No
End
Fig. 5. Flowchart of image processing in STevo
III. RESULTSANDDISCUSSION
STevo was tested by comparing volume estimation values in manual quantification and computer assisted STevo using the same samples. Two samples were used for testing, i.e., kidney and TA1 trigeminal ganglion of a rat. These samples would be quantified manually at first; then they were quantified using STevo for a comparison between the estimation values of the volume. 0,1 mm 0,1 mm 1 mm = 1000 pixel 1 mm = 1000 pixel A A B B
A. Rat Kidney Sample
The rat kidney sample consists of 8 sections, with a thickness of 600 µm. Point grid (Ap) used for estimating the
sample volume was 27777.78 µm2 in manual quantification
while STevo used 27889 µm2. Quantification in STevo was
repeated 8 times to test the software consistency. All of the point-count means and standard deviations for each section were calculated, as well as the total point counts for all sections and the volume for each quantification. Mean, and standard deviation of 8 quantifications was compared with the manual quantification. The estimated volume of the rat kidney is shown in Table I. The manual quantification was only performed once for each section because the manual procedures take too long.
TABLE I
RAT KIDNEY SAMPLE QUANTIFICATION
Section Number QuantificationManual STevo Quantifications Mean Std. Dev 1 738 778.13 3.68 2 1161 1225.63 5.21 3 1239 1309.13 10.07 4 1099 1040.38 3.11 5 1274 1292.75 4.89 6 1305 1232,.50 5.40 7 1255 1235.38 5.32 8 1483 1413.75 5.99
Total Point Counts 9554 9527.63 279.82 Volume (mm2) 159.23 157.75 0.45 Section Thickness (µm) 600 600 -
Ap (µm2) 27777.78 27889 -
Volume estimation for manual quantification was 159.23 cubic millimeters for rat kidney sample while STevo was 157.75 cubic millimeters. By comparing those two values, the relative difference of volume estimation using STevo to manual quantification is 0.93%.
B. TA1 Trigeminal Ganglion of a Rat
The TA1 trigeminal ganglion of a rat sample had 12 sections with 90 µm thickness. The point grid that used for manual quantification was 18595.04 µm2 while for STevo was
18496 µm2.
Because the point count in TA1 sample was relatively smaller than the rat kidney sample, the variability of the point count would become much smaller for TA1 sample compared to the rat kidney sample. The TA1 sample also had more sections compared to the rat kidney sample. However, its size was relatively small compared to rat kidney sample, even though the difference in grid value is not too large between them. Consequently, for the TA1 sample, the quantification was only performed 6 times.
The results of quantification in the TA1 sample is given in Table II. The relative difference between STevo and manual quantification for this sample is 10.81%.
TABLE II
TA1TRIGEMINAL GANGLION OF RAT QUANTIFICATION
Section Number Quantification Manual STevo Quantifications Mean Std. Dev 1 18 16.67 1.63 2 18 23.33 2.58 3 35 19.67 3.20 4 19 33.17 3.76 5 17 29 3.40 6 28 11.5 1.38 7 23 15.67 1.96 8 17 12.17 2.48 9 19 15 1.41 10 14 11 1.41 11 6 5.83 1.47 12 4 2.67 1.21
Total Point Counts 218 195.67 6.06
Volume (mm2) 0.37 0.33 0.01
Section Thickness (µm) 90 90 -
Ap (µm2) 18595.04 18496 -
C. Discussion
STevo was designed to be able to do quantification in any kind of situation regarding its equipment that used. For this requirement, quantification in STevo was done by a different set of equipment and people between the manual quantifications. The difference approach for calibrating and creating the probe also led to a small difference in point grid area (Ap) value between the two quantifications.
In the rat kidney sample quantification, even though there was a small difference between the size of the grid in manual and the STevo calculations, the volume estimation results showed just a small difference between them with a relative error of 0.93%. On the other hand, the TA1 trigeminal ganglion of rat sample showed a quite big difference compared to rat kidney sample with an error percentage of 10.81%.
By looking through the volume estimation on both quantifications, the TA1 sample is 500 times smaller than the rat kidney sample. Considering the size factor for both samples that have a large difference, STevo managed to do quantification in TA1 sample with such a small difference between two quantifications.
In addition, because of the evaluation for every point in manual quantifications were done by different people than in STevo, there have to be some subjective differences in counting some of the points.
Even though there was a large difference between the estimation between two quantifications, it did not matter as long it follows the whole method in the concept of stereology. This is because both of them was calculated as estimation value, not as the real value. The difference between the two estimations will be decided through the calculation of the coefficient of error which shows reliability and the accuracy of the estimation [19].
IV. CONCLUSION
STevo had successfully estimated the sample volume value by implementing image processing techniques. The mean and standard deviation of volume estimation using Stevo for rat kidney sample were 157.75 and 0.45 cubic millimeters respectively, while those for rat TA1 trigeminal ganglion sample were 0.33 and 0.01 cubic millimeters respectively. By comparing between manual and STevo calculations, the relative difference of 0.93% for rat kidney sample and TA1 trigeminal ganglion 10.81%.
ACKNOWLEDGEMENT
This research was a collaboration between the Visual Sensor Research Group, Department of Nuclear Engineering and Engineering Physics, Faculty of Engineering, Universitas Gadjah Mada and the Faculty of Medicine, Universitas Gadjah Mada.
REFERENCES
[1] Pascale H. Lane, Michael W.Steffes, S. Micahel Mauer, “Estimation of glomerular volume: A comparison of four methods,” Kidney International, Vol.41 pp. 1085-1089, 1992.
[2] Emily A. Van Vré et al,“Stereology: a simplified and more time-efficient method than planimetry for the quantitative analysis of vascular structures in different models of intimal thickening,”
Elsivier Inc. : Cardiovascular Pathology, pp. 43-50, 2006.
[3] C.V.Howard, M.Reed, “Unbiased Stereology: Three-Dimensional Measurement in Microscopy,” Liverpool, UK: Bios Scientific Publisher, 2005.
[4] Berrin Zuhal Altunkaynal et al, “A Brief Introduction to Stereology and Sampling Strategies: Basic Concepts of Stereology,” NeuroQuantology, Vol.10, 2012.
[5] Ali Noorafhsan, “Stereology as a valuable tool in the toolbox of testicular research,” Annals of Anatomy, Vol. 196, pp. 57-66, 2012. [6] Dainus Daunoravicius, “Quantification of myocardial fibrosis by
digital image analysis and interactive stereology,” Diagnostic Pathology, 2014
[7] Gulsun Pazvant et al, “The volume fraction method for the evaluation of kidney: A stereological study,” Ankara Üniv Vet Fak Derg, 2009. [8] Sahib Abay et al, “Magnetic Resonance Imaging Is a
Complementary Method to Stereological Measurement of Testicular Volume,” Elsevier Inc., UROLOGY 73, pp. 1131-1135, 2009. [9] N. Acer et al, “Unbiased estimation of the calcaneus volume using
the Cavalieri principle on computed tomography images,” Ann Anat, 2008.
[10] Ahmet Kalaycioglu et al, “Anencephalic foetuses can be an alternative for kidney transplantation: a stereological and histological investigation,” Histol Histopathol, 2010.
[11] S.A. Tschanz, P.H. Burri, E.R. Weibel, “A simple tool for stereological assessment of digital images: the STEPanizer,” Journal of Microscopy, Vol. 243, 2011.
[12] Stefan Tschanza, Jan Philipp Schneiderb, Lars Knudsen, “Design-based stereology: Planning, volumetry and sampling are crucial steps fora successful study,” Elsivier Inc: Annals of Anatomy, Vol. 196, pp. 3-11, 2014.
[13] Mark J.West, “Estimating Volume in Biological Structure,” Cold Spring Harbor Laboratory Press, 2012.
[14] Mark J.West, “Getting Started in Stereology,” Cold Spring Harbor Laboratory Press, 2012.
[15] Mark J.West, “Optimazing the Sampling Scheme for a Stereological Study: How Many Individuals, Sections, and Probes Should Be Used,” Cold Spring Harbor Laboratory Press, 2012.