P
olicy
R
eseaRch
W
oRking
P
aPeR
4582
Technology Trap and Poverty Trap in
Sub-Saharan Africa
Hippolyte Fofack
The World Bank
World Bank Institute
Poverty Reduction and Economic Management Division
March 2008
WPS4582
Public Disclosure Authorized
Public Disclosure Authorized
Public Disclosure Authorized
Abstract
The Policy Research Working Paper Series disseminates the findings of work in progress to encourage the exchange of ideas about development issues. An objective of the series is to get the findings out quickly, even if the presentations are less than fully polished. The papers carry the names of the authors and should be cited accordingly. The findings, interpretations, and conclusions expressed in this paper are entirely those of the authors. They do not necessarily represent the views of the International Bank for Reconstruction and Development/World Bank and its affiliated organizations, or those of the Executive Directors of the World Bank or the governments they represent.
Policy ReseaRch WoRking PaPeR 4582
Since the industrial revolution, advances in science and technology have continuously accounted for most of the growth and wealth accumulation in leading industrialized economies. In recent years, the contribution of
technological progress to growth and welfare
improvement has increased even further, especially with the globalization process which has been characterized by exponential growth in exports of manufactured goods. This paper establishes the existence of a technology trap in Sub-Saharan Africa. It shows that the widening income and welfare gap between Sub-Saharan Africa and the rest of world is largely accounted for by the technology trap responsible for the poverty trap. This result is supported by empirical evidence which suggests that if countries
This paper—a product of the Poverty Reduction and Economic Management Division, World Bank Institute—is part of a larger effort in the department to understand the determinants of growth and economic development in Sub-Saharan Africa in the knowledge economy era. Policy Research Working Papers are also posted on the Web at http://econ.worldbank. org. The author may be contacted at [email protected].
in Sub-Saharan Africa were using the same level of technology enjoyed by industrialized countries income levels in Sub-Saharan Africa would be significantly higher. The result is robust, even after controlling for institutional, macroeconomic instability and volatility factors. Consistent with standard one-sector neoclassical growth models, this suggests that uniform convergence to a worldwide technology frontier may lead to income convergence in the spherical space. Overcoming the technology trap in Sub-Saharan Africa may therefore be essential to achieving the Millennium Development Goals and evolving toward global convergence in the process of economic development.
Technology Trap and Poverty Trap in Sub-Saharan Africa
Hippolyte Fofack
1The World Bank
JEL Classification Numbers: E60, I23, J24, O33, O41, O55
Keywords: global technology frontier, low-technology trap, poverty trap and R&D
1 This paper has benefited greatly from suggestions and comments by Melvin Ayogu, William Easterly,
Mohamed Hassan, Roumeen Islam, Paulus Gerdes, Aart Kraay, Adolf Mkenda, Raj Nallari, Leonce Ndikumana, Benno Ndulu, Yaw Nyarko, Anwar Shah, Xiao Ye and Shahid Yusuf. I would like to thank them all and Nihal Bayraktar for creative research assistance.
“Inadequate scientific infrastructure is a critical factor which creates strong barriers
to the path of advancement in developing countries.”— Abdus Salam, 1979 Nobel Laureate in Physics.
I. Introduction
Over the past few decades, development economists and growth theorists have assigned increasingly larger weights to technological progress and research and development in growth models [Romer (1986), Lucas (1988)].2 Presumably this calibration has been done to better estimate aggregate
outputs, but also to better understand the process of wealth creation and accumulation. This emphasis on technology and human capital accumulation in the new growth theory reflects the significance of efficiency and productivity gains achieved under the impulse of technological
progress, knowledge and skills acquisition [Mansfield (1972), Jovanovic and Nyarko (1996)]. It is also the result of persistent income gap across countries and resilience of structural differences in the process of growth and wealth creation, not always accounted for by traditional neoclassical growth models.
The first generation of these neoclassical growth models put emphasis on capital and labor in the specification of production functions and estimation of aggregate output [King and Rebelo (1993)]. The basic assumption underpinning these models is that growth is exclusively driven by two primary factors: capital accumulation and labor increases. However, departing from this dual input
assumption, Solow’s seminal research on productivity showed that much of economic growth cannot be attributed to increases in capital and labor alone [Solow (1956, 1957)]. The adjustment to these models to account for technological progress and innovations, for education and skills building and use of technology reflects the importance of these factors for productivity growth and output expansion. Analytically, these adjustments are captured by the growing importance of the Solow’s residual— the contribution of total factor productivity to growth.
Additionally, these adjustments are the result of a counterintuitive slow convergence of income and asymptotic rates of growth between industrial and developing countries [Lucas (1988), Rebelo (1998)]. The convergence hypothesis is underlined by the diminishing returns to capital assumption, whereby real interest rates should be proportionally low in countries with low capital stocks and thus, enhance investment growth and catching-up in the process of capital accumulation.3 Contrary to this
hypothesis most countries in the developing world, especially in the Sub-Saharan Africa region, did not systematically record growth rates that were substantially higher than the ones observed in the more advanced economies to gradually narrow their income gap, however. In fact investment and capital accumulation rates were markedly lower and growth volatility was more pronounced resulting in negative long-run average economic growth rates across the region [Easterly and Levine (1997), Fofack (2007)].
In contrast, the sustained economic and per capita income growth achieved in the more advanced economies further widened the already large welfare gaps between the rest of the world and Sub-Saharan Africa (SSA) [Azariadis and Stachurski (2004)].4 In addition, cross-country variations in
2 Indeed, according to a recent study published by the US Department of Commerce, knowledge is explaining
an increasingly large part of the US multifactor productivity, which grew to about 33 percent between 1995 and 2002, from approximately 20 percent.
3 Contrary to the underlined hypothesis, interest rates have been structurally high in Sub-Saharan Africa, and
are largely responsible for the domestic credit crunch, which has undermined investment and growth prospects and led to the development of parallel informal financial institutions.
4 For instance, between 1960 and 2000 PPP- adjusted average income per capita rose from US$10,594 to
run growth and the process of wealth creation remain important in the developing world. Despite the similarities of initial conditions, emerging market economies, which opted for development models that emphasize human capital development and technological progress achieved sustained and higher economic growth rates and a rapid increase in per capita income [Amsden (1991), Nelson and Pack (1999), Yusuf and Nabeshima (2007)]. The narrowing scientific and technological gap between these emerging market economies and the leading industrialized countries resulted in a significant
reduction of income and welfare gap between these two groups of countries over the last few decades [Mathews and Hu (2007), Lucas (2007)].5
Unlike emerging markets economies, most countries in Sub-Saharan Africa did not operate similar adjustments to foster technological progress and innovations in models underlying their growth and development processes, however. Worse, they witnessed a significant deterioration of their research and scientific infrastructures, partly as a result of a dramatic decline of public spending allocated to academic and research institutions in the face of rising fiscal deficits during the adjustment era [Teferra and Altbach (2003), UNESCO (2005)]. Over time, the deterioration of scientific infrastructure and widening education and skills gap with the rest of the world emerged as major constraints to research and development and to the adoption and use of new technologies in support of growth and economic development in the region. As a result of these constraints, most African countries have consistently operated in the lowest technology ladder, far off the global technology frontier, a contrast that we characterize as technology trap in this paper.
The persistency under this technology trap has come with tremendous costs in terms of economic growth and welfare to the region [Bloom et al. (2005), Fofack (2005), Hassan (2007)].6 On average
the region overwhelmingly faced lower productivity, excess and higher growth volatility and lower investment and growth rates over the globalization era characterized by exceptional long-run growth and booms in global trade and manufactured exports [World Bank (2002), Artadi and Sala-i-Martin (2003)]. The costs of technology deficit also include delayed economic diversification at the structural levels. The growing size of informal sector production and high unemployment rates, direct
consequences of delayed economic diversification and changes in the structural patterns of growth, are other inherent costs.
These additional costs have tremendous welfare and fiscal implications at the policy level. While poverty rates are projected to fall in most other regions of the developing world, a rising trend is predicted in Sub-Saharan Africa where unemployment rates have continued to soar in the face of a structurally lower productivity and in the absence of sustained investment rates and industrial output expansion [Chen and Ravallion (2004), Berg and Qureshi (2005)]. However, as a growing number of countries projected to meet the Millennium Development Goals in the rest of the developing world do so, addressing the technology trap may become even more critical to exiting the poverty trap— vicious circle of persistently high incidence of poverty and low savings and investment
opportunities— in Sub-Saharan Africa.
The object of this paper is to assess the implications of poor research and technological
infrastructure for growth in Sub-Saharan Africa. It establishes the existence of a technology trap in
5 For instance, with technologically-induced economic development, average growth rate of GDP increased in
excess of 6.0 percent between 1970 and 2000 in Korea, leading to over fivefold increase in per capita income, which reached US$20,000 in 2005, from a little over US$1900 in 1970. For discussion on the effects of technological adoption on East Asia development, see Amsden (1991), Baark (1991) and Yusuf (2003).
6 Professor Mohamed Hassan, the President of the African Academy of Sciences, stressed that progress on the
development ladder would only be achieved if there is commitment to promote homegrown sciences during the African Union meeting of Head of State in June 2007. In this regard, he said “Every African nation must educate and support a new generation of problem-solving scientists.”
the region and investigates its implications for welfare. It estimates the potential gains in terms of income growth and poverty reduction, inherent to hypothetical advances in technology from pseudo-panel models. A control experiment allows a simulation of the potential growth effects of improved scientific infrastructures and models the hypothetical losses illustrated by lower GDP growth rates. Under this experiment and assuming all other things equal, empirical results reveal significantly high costs of technology trap for growth and welfare in the region. In particular, it is shown that if African countries were operating on the global technology frontier enjoyed by OECD countries, their income level would be significantly higher, over four times the current estimates ceteris paribus.7
These results are robust, even after controlling for institutional and macroeconomic instability. They corroborate the positive science-development link, and are consistent with findings from principal component analysis. In addition, the model is calibrated to estimate the long-term effects of sustained technologically-driven growth on poverty in Ethiopia. The results highlight a uniform decline of poverty rates under an hypothetical increased applications and use of technology. In particular, sustained increase in research and development results in a significant reduction of the headcount index.
The next section provides an historical overview of technology and development link and establishes the existence of a technology trap in SSA. Section III discusses low-technology-based poverty trap models and empirically tests the existence of a technology trap in the region using the principal components analysis. Section IV proposes a model for estimating the welfare effects of advances in science and technology. Section V discusses the empirical results and the last section concludes.
II. Global technology-led growth and Africa’s low-technology trap
The implications of technological progress and scientific innovations for welfare go back as far as the pre-industrialization era when scientific inventions and tool-making technologies were used in the field of medicine, agriculture and metallurgy within a very constricted organizational framework. Initially, the link between technology and human development is primarily motivated by short-term benefits and particularly population well-being. Efficiency gains and considerations and direct impact on income growth and wealth accumulation, possibly emanating from economies of scale and productivity growth, is relatively limited, owing largely to the preeminence of subsistence economies characterized by low capital-labor ratio and missing or segmented markets [Maddison (1995)]. However, with advances in science and technology and engineering applications, particularly
following the industrial revolution, specialization and growing demands, the link between technology and economic development grew stronger. Over time, it became more evident through a self-reinforcing process of knowledge accumulation in a virtuous circle of sustained growth fuelled by consumption booms. These advances were made possible by technological innovations and scientific prowess which contributed to the development of infrastructure, transportation, communication and manufacturing, all key for productivity growth and industrial output expansion [Smiles (1966), Mansfield (1980)].8
7 Though variable over time, the global technology frontier is space invariant as it obeys the principle of unicity;
however, it is product-driven. For instance, Taiwan closed its gap with the world technology frontier in the manufacturing of semiconductors in the late 1990s [Mathews and Hu (2007)]. Evidently, there are certainly numerous areas of production where it is still operating inside the frontier, nonetheless.
8 In a book published in 1888 and titled the live of engineers, Samuel Smile attributed the reduction of income and
welfare gaps between Britain and its neighboring European rivals to the success of British engineers and scientists, who endowed Britain with the most modern infrastructures in Europe.
In practice, research and development and sciences and technological applications were critical in the process of economic growth, diversification and changing structural patterns of growth [Solow (1957)]. In most countries benefiting from advances in technology, the increasing share of industrial output was gradually compensated by a steady decline of primary sectors’ contribution to aggregate GDP. In particular, agricultural employment, which then dominated primary sector production and employed the majority of active labor force, entered a long cycle of declining trend. This decline followed a tremendous surge in productivity as a result of mechanization and intensification of production processes. Sustained productivity growth in the agricultural sector allowed labor force shift towards industry to meet growing demands of manufactured goods in the post-industrial revolution era.
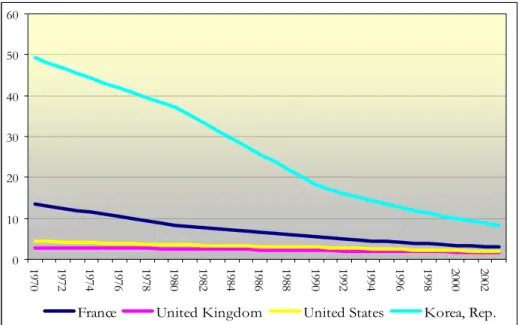
In the United Kingdom, employment in agriculture fell consistently after the industrial revolution, from about 40 percent of active labor force in 1820 to approximately 12 percent in 1913 [Maddison (1995, 2001)]. Most recent estimates place it at 2.2 percent. Similarly, a steadily declining trend is observed in most other advanced economies across and outside Europe. According to latest estimates, the agricultural labor force would account for less than 3 percent of the active labor force in the United States and in other leading industrialized economies (see Panel A in Figure 1).
Though the process of structural transformation and changing patterns of growth primarily started in the leading industrialized countries, a similar trend of declining agricultural labor force has also been observed in emerging market economies over the past decades. According to Nelson and Pack (1999), the assimilation of modern technology and the changes in the structural patterns of growth have been the critical component of the East Asian Miracle. In the Republic of Korea, the changing structure of the economy has notably been illustrated in the declining share of primary commodities production in aggregate output and evolving composition of the labor force [Lucas (2007)].
Agricultural employment, which accounted for over 49 percent of the total active labor force in 1970 has been on a steady declining trend over the past decades and fell to 8 percent in 2003.
In contrast to the global trend, countries in Sub-Saharan Africa remain largely confined to primary agricultural production. A disproportionately large segment of their active labor force continues to be employed in the agricultural sector. Except in a few cases, such as South Africa and Mauritius where the structural transformation of their economies has taken place, the share of agricultural labor force has remained extremely high for most other countries, largely in excess of 70 percent. The graph in the second panel of Figure 1 contrasts the near linear trend with slope converging to zero for the curve of agricultural labor force in the sub-sample of countries in Sub-Saharan Africa with the rapidly declining trend in the more advanced and diversified economies in panel A.
Paradoxically, despite the lion’s share of agricultural labor force, the region continues to rely heavily on imports of food grains to make up for the shortage of supply and mitigate the volatility of agricultural output in the face of continued exposure to exogenous shocks.9 The systematically larger
share of agricultural labor force in Sub-Saharan Africa and low productivity of the sector are largely the consequences of delayed economic diversification and failures to adjust to the changing patterns of the global economy, increasingly relying on technology, research and development for sustained productivity growth and mitigation of negative shocks [Salam (1987), Mansfield (1995)].
The technology trap in Sub-Saharan Africa is at odds with the going trend across the developing world, however. While advanced economies first benefited from the self-reinforcing process of knowledge and technological progress, enjoying rapid income growth especially in the post-industrial revolution era, other developing countries, particularly in Asia, later invested significantly to improve
9 The shortage of supply and volatility of agricultural production in Africa is often attributed to excess
their research and scientific infrastructure in support of productivity growth and industrial output expansion [Nelson and Pack (1999)]. According to the latest statistics, Asia’s Global Expenditure on Research and Development (GERD) reached 32 percent of world total, exceeding the EU share (27 percent). In contrast, the Sub-Saharan Africa’s share, already the lowest (0.6 percent), declined even further [Westholm et al. (2004), UNESCO (2005)].10
Figure 1: Trend of agricultural labor force as a percentage of total labor force PANEL A: OECD Countries
0 10 20 30 40 50 60 19 70 1972 1974 1976 1978 1980 1982 1984 8619 1988 1990 1992 9419 1996 1998 2000 2002
France United Kingdom United States Korea, Rep.
PANEL B: Sub-Saharan African Countries
0 10 20 30 40 50 60 70 80 90 100 19 70 1972 1974 1976 1978 1980 1982 1984 8619 1988 1990 1992 9419 1996 1998 2000 2002
Zambia Congo, Dem. Rep. South Africa Madagascar
10 The declining research and development funding has consequences and implications for the performance of
higher learning institutions and their positioning at the global level. Over the past few years, not a single African institution has appeared in the global ranking of top 100 universities in the world.
The returns of increased research expenditures and technological advances are felt at the output level—number of researchers and scientific output growth. Asian counties are training a large number of engineers and scientists every year. According to the latest statistics, that region is comfortably positioned on the skilled endowment ladder, with more than 780 engineers and scientists per million. The averages across Sub-Saharan Africa and industrial countries are 83 and about 1,100, respectively [Fofack (2005)].11 The returns have also been spectacular in terms of
increased scientific output, economic growth and contribution to global trade, reflecting the convergence between emerging market economies and the traditionally industrialized economies on the scientific and technological ladder.
In fact, most countries in Asia markedly increased their share of global trade, as reflected in their strong reserve position [Summers (2006)].12 Their growing reserve base has accelerated the changing
landscape of the international financial architecture. Emerging market economies have become the major suppliers of global savings, a change from the immediate post-independence world dominated by the developed and developing countries dichotomy. In turn, a number of traditional industrialized economies are increasingly relying on savings accumulated by emerging market economies to finance their current account deficits. The combined current account surpluses of China and emerging market economies of Asia alone represents about 25 percent of US net international borrowings [Summers (2006)].
The remarkable success in the catching-up process achieved by emerging markets economies is largely attributed to technological advances and innovations [Mansfield (1988), Amsden (1991), Nelson and Pack (1999)]. In fact according to these authors most emerging markets economies adopted deliberate policies of sustained investment in research and development and promotion of technology acquisition and innovations in support of growth and a structural transformation of their economies with a growing share of the modern sector. However, the process of technology
acquisition varies across these countries. While some relied predominantly on technology transfers in the initial phase of their economic transformation, others took the path of building research and development (R&D) capabilities early on [Aw (2003)].13
The contribution of technological progress to the catching-up on the development ladder is not new, however. Already in the 1970s, when the income gaps between the US (latecomer) and Europe was growing, the dominant discourse in the latter focused on the notion of ‘technology lag’, in particular because research and development and innovations were then already seen as critical sources of comparative advantage. Over the past few years, R&D has remained robust in explaining cross-national differences in growth among developed countries, with its contribution to real growth of GDP growing unabated [Mansfield (1972), Gittleman and Wolff (1995)]. In particular, a recent study
11 Despite their impressive growth, the numbers of scientists and engineers trained in Asia are still rising. India
is projected to produce over half a million engineers and scientists on an annual basis by 2009 [Mallaby (2006)].
12 In a recent classification of countries with large reserve position, emerging market economies from Asia
dominated the list of countries with excess reserves above the Greenspan-Guidotti Rule. Six out of ten countries were Asian, and the first three countries with the largest reserve position include China, Taiwan and Korea in that order. Other emerging markets economies topping the list include India, Malaysia and Thailand; and the remaining four countries are predominantly oil exporters. For further details, see Summers (2006).
13 However, the process of technology acquisition is non linear. In a number of cases, countries have relied on
both technology transfers via the FDI inflows and on research and development. While in others, they have evolved from being users of technology to leading the process of knowledge and technology creation. Singapore and Korea will fit this dual model. For further details, see Wong (2003).
showed that investments in R&D have played a significant role in US long-run growth over the past decades [Okubo et al. (2006)].14
With the catching-up process resulting from the convergence between traditional industrialized countries— old industrialized economies— and emerging markets economies—newly industrialized economies— on the technological and scientific ladder, these two groups of countries now account for most of the global trade, over 90%, a natural trend in a world where exports of manufactured goods grew almost exponentially over the past decades to account for as much of global trade. This resulting outcome— a consequence of converging technological and scientific paths between traditional industrialized economies and emerging markets economies— is consistent with standard neoclassical growth models. These models predict that countries with the same preferences and technology will converge to identical levels of income and asymptotic growth rates.
The process of convergence on the technology ladder is not uniform on the spherical space,
however. The skewed distribution of technology diffusion has marginalized the Sub-Saharan African region, which is locked in a technology trap— whereby countries are overwhelmingly clustered around the lower scale on the technology ladder. With empirical evidence supporting the benefits of R&D for growth, the underlined Africa’s technology trap may be largely responsible for its poverty trap. In fact and to a large extent, the skewed distribution of growth at the global level is largely attributed to a limited geographical diffusion of technology [Easterlin (1981), Lucas (2007)]. The proposition below sums up the implications of a technology trap for stunted growth and skewed global distribution of income.
Proposition 1: Let and represent the level of technology embodying state of
knowledge and innovations which enable continued output expansion and growth even for
unchanged quantities of the labor and capital inputs in the production processes in country A and B, respectively; where
)
(
T
A tδ
δ
tB(
T
)
T
is technology endowment. Let and be technological jumps taking on real-value numbers, and be the estimated income level or aggregate output in these respective countries for a given stock of technology endowment)
(
T
A t tδ
Δ
Δ
tδ
tB(
T
)
A t T,ˆ
Y
Y
ˆ
TB,tT
at timet
. If∑
Δ
→
∞
and with ∞ = ∞ →(
)
lim
0T
A t t t tδ
T
c
B t t t t∑
Δ
→
∞ = ∞ →(
)
lim
0δ
|
c
|
<
1
and fort
∈
[
0
,
∞
)
(1) then∑
(
−
)
→
∞
. ∞ = ∞ → 0 , ,ˆ
ˆ
lim
t B t T A t T tY
Y
In other words, output growth in the country that is enjoying rapid technological advances will always grow faster as a result of continued productivity growth. Over time, the output and income gaps with country
A
B
, caught in a technology trap, will continue to grow. Even holding other key determinants of growth constant in the two countries, long-run persistency under a technology trap will result in widening income gap in the technology deficit country where the structural patterns of growth may remain unchanged and per capita income abysmally low. (See the Technical Annex for proof of Proposition 1.)14 This study proposes a new methodology based on “Research and Development Satellite Account” to
estimate the effect of investment in R&D on US economic growth. According to this study, if R&D spending were included in the GDP as investment instead of as an expense, investment would be 11 percent higher and national savings rate would be 16 percent instead of 14 percent. Similarly, decades earlier, Solow (1957) attributed over 87 per cent of sustained increases in US gross output to technical changes.
Interestingly, the B-representation better captures stylized facts of most African economies. The implications of technology trap in Sub-Saharan Africa— whereby African countries are
overwhelmingly clustered in the lower scale on the technology ladder, extend beyond their abysmally low contribution to global trade and uniform patterns of growth, however. The recurrence of balance of payments crises and macroeconomic imbalances following negative terms of trade shocks, which have partly fuelled the cycle of external indebtedness, are other inherent consequences. The long-term costs may also include the structurally low level of productivity, a constraint to FDI inflows [Jovanovic and Nyarko (1996), Pattillo et al. (2006)].
III. Testing for a low-technology-based poverty trap
With a persistency of poverty across Sub-Saharan Africa, a growing strand of the economic literature is focusing on empirically testing the plausibility of the poverty trap assumption [Quah (1997), Azariadis and Stachurski (2004), Kraay and Raddatz (2007)]. Analytically, poverty trap generally refers to a situation where the aggregate distribution of per capita income of a group of countries can be modeled with a bimodal distribution, with low-income countries clustered around the low-level poverty trap equilibrium and the rich countries clustered around the high equilibrium at the higher end of the distribution.15
In the long run, the poverty trap assumption implies a widening welfare gap between the low-income countries caught in a vicious circle of deepening poverty resulting from stunted growth and excess volatility and the rich countries enjoying virtuous circles of continued per capita income growth.16 In
theory, this skewed accumulation process should be sustained to result in an increasing distance (in absolute terms) between the low-level poverty trap equilibrium of poor countries and higher equilibrium enjoyed by the more advanced economies. Using non-parametric techniques, Quah (1996, 1997) established the existence of such bimodal distributions for a cross-section of countries. However, departing from the bimodality hypothesis, another definition of poverty trap stresses the existence of self-reinforcing mechanisms which cause poverty to persist overtime [Azariadis and Stachurski (2004)]. Bloom et al. (2003) single out geographical characteristics as key among these mechanisms.17 Other mechanisms that may contribute to persistency of poverty include the market
and business environment, low savings, productivity and institutional factors [Acemoglu et al. (2001), Islam (2002)]. Mckenzie and Woodruff (2004) find that large fixed costs to starting business may be responsible for poverty traps in developing countries, especially under imperfect capital and credit markets.18 On the other hand, Kraay and Raddatz (2007) find little evidence of the existence of the
poverty trap emanating from saving crunch and low productivity in developing countries.
15 However, the bimodality hypothesis is not always sustained empirically. According to Kremer et al. (2001),
the dynamics of world income distribution are better characterized by a prolonged transition whereby rising income inequality converges towards a singly peaked long-run distribution, with a bimodal shape.
16 Note that this definition of poverty trap differs from the strong form of poverty trap definition which
assumes “zero growth” in countries at the lower end of the income distribution. Countries may record positive growth rates from time to time, but in a context of high frequency of business cycles where episodes of positive growth are followed by negative spikes, average long-run growth rates are negative.
17 Similarly, Jalan and Ravallion (2002) found that the consumption growth at the household level increases
with the local availability of “geographical capital”, suggesting the existence of a spatial poverty trap.
18 Under imperfect capital markets where potential entrepreneurs are credit-constrained by lack of collateral,
poverty traps may exist because individuals who start out with low wealth are unable to finance potentially profitable investments in new business.
However, the challenges of explaining the divergent growth and development path between Sub-Saharan Africa and other regions of the developing world, and particularly emerging market economies, which recorded sustained investments and productivity growth remain. To explain this poverty trap puzzle, a few studies departed from the bimodal distributional assumptions and geographical constraints to look at models of low-technology base poverty trap [Azariadis and Drazen (1990) and Kraay and Raddatz (2007)]. These models share a common feature in that increasing returns to scale is assumed to be external to firms. So in a model of homogeneous firms, the technology of a representative firm i has the form:
)
,
(
)
(
i i i iA
a
F
K
L
Y
=
(2)where are private capital and labor input and is the aggregate output. is the scale factor capturing total factor productivity. Under these models, technology trap leads to poverty trap through the productivity channel. In practice, productivity growth and output expansion should be expected from technology acquisition and improved production processes at the firm level. Moreover, the scale factor is assumed to depend on a measure of aggregate economic activity— economic overheating may undermine output expansion in certain sectors, especially if there is a shortage of supply in the market of intermediate goods.
)
(
K
i,L
iY
iA
(
a
)
However, there are a host of other variables that may also affect the scale parameter, including aggregate level of output [Kraay and Raddatz (2007)], aggregate level of capital as suggested from the literature on capital-embodied knowledge developed by Romer (1986), and level of capital per worker [Azariadis and Drazen (1990)].19 This last variation, which is derived from threshold externalities
models, is quite appealing because it proposes a simple specification with a threshold level of capital at which there is a technological jump. In practice, a change in technological endowment can be used to assess counterfactually the potential growth and welfare benefits, ceteris paribus or alternatively the implications of ‘technological lag’ for poverty trap.
The ability of technology to account for differences in income across countries depends on a minimum capital threshold under these models. In theory, an exogenous improvement in productivity should be expected, once the capital reaches a certain critical threshold. In this framework, a low-technology-based poverty trap may exist because for a given saving rate, low productivity implies that investment is not sufficient to generate sustained growth in the capital stock. Kraay and Raddatz (2007) actually derive the degree of increasing returns necessary to obtain a low equilibrium poverty trap from a class of models with optimizing agents facing technology that has increasing returns external to the firm. In particular the existence of stable poverty trap equilibrium requires external increasing returns to be sufficiently large relative to the diminishing returns in the production function.
However, they find such strong increasing returns to be inconsistent with estimates from the
literature. In fact, existing models assume certain values for the parameters in the calibration process. Moreover, the performance of the model depends on the stability of the increasing returns to scale assumptions over time. In practice, estimates of increasing returns are highly sensitive and subject to changes over time. In fact, for the same region, estimates differ depending on methodologies
19 This last specification has the advantage of eliminating the scale effect that is present in Romer (1986) and
Barro (1990). However, the majority of these models do not establish a minimum technological threshold to exit the poverty trap. A dynamic general equilibrium model taking into account the effects of improved technology on productivity with a feedback loop is necessary for the establishment of such a threshold.
[Antweiler and Trefler (2000), Van Biesesebroeck (2005)].20. This paper takes a different approach in
assessing the implications of technology trap for poverty trap. It assumes the existence of a technology trap on the basis of persistent ‘technology lag’ and assesses the implications of the structural technology deficit for the resilience of poverty using a principal component analysis (PCA) technique, which draws on linear transformation to achieve data compression without loss of information.
In essence, this data reduction technique displays the eigenvalue decomposition of the sample second moment of a group of series, following the linear transformation. The first principal component is computed as a linear combination of the series in the group with weights given by the first
eigenvector. The higher the degree of co-movements between the original series, the fewer the number of principal components needed to explain the proportional variance of that set. Alternatively, the convergence process is very slow when the vectors in the series are completely uncorrelated. In this case a maximum number of eigenvectors is needed to explain most of the proportional variance observed. In theory, the covariance matrix associated with such vectors is equal to zero.21
Inference from this technique is derived from the estimated eigenvalues and eigenvectors. The size of the first eigenvalue provides the direction of largest variance while the second eigenvalue, orthogonal to the first one, provides the direction of minimum variance in the data.22 The reduction of the
multidimensional vector to a two-dimensional space of low-technology trap and poverty trap allows one to assess the implications of low technology endowment for poverty from a reduced model. Under this model, inference on the welfare effects of technology trap is less affected by the stability of increasing returns estimates. Moreover, the methodology is highly data-intensive, and hence, may allow one to assess the implications of technology jumps on welfare.23
Although a partial equilibrium analysis, this data reduction technique provides an empirical characterization of technology and poverty trap attributes. Conceptually, the reduction of the problem to a two-dimensional space allows a representation of countries on the path of poverty trap and technology trap. In particular, areas of low equilibrium of dual traps (poverty trap and
technology trap) and areas of higher equilibrium (relatively high technology endowment and income) can be sketched on the same two-dimensional vector space, where each point on the space
represents the level of aggregate output for a given level of technology.
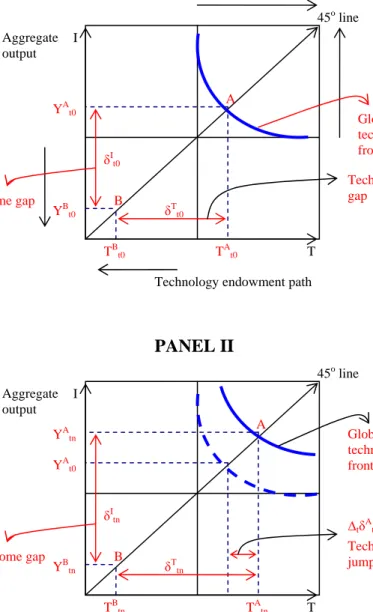
Figure 2 below sketches that two-dimensional representation. Countries confronted with technology trap and poverty trap fall in the first quadrant (bottom left), where income and technology
endowment are relatively low and consistently fall below the median point. In both panels the dual trap is characterized by pull-factors, symbolized by the arrows pointing towards the origins to
20 In fact, the range of Sub-Saharan African’s increasing returns estimates varied markedly between 2000 and
2005, and were higher than the OECD averages which were uniformly inferior to unity.
21 A detailed description and overview of the rationale for using the PCA methodology is provided in Annex.
For further details see Morrison (1990).
22 For instance, should the largest eigenvalue be knowledge, proxy for stock of technology and technological
progress, it would imply that most of the proportional variance observed in the global distribution of income is explained by the variation in the diffusion of technology and knowledge at the global level.
23 However, by design the proposed PCA methodology is static and based on a partial equilibrium analysis. In
practice, a change in the level of technology should have implications on productivity and income. Moreover, the prospects of technology jumps depend on a prior shift in the threshold level of capital. In fact, for models of threshold externalities improvement of productivity depends on the scale of capital per worker, suggesting that productivity growth requires strong investment rates sustained over a long period [Kraay and Raddatz (2007)]. In practice, countries in SSA recorded low investment rates during most of the adjustment era, with a rapid depreciation of fixed capital stock [Akyuz and Gore (2001), Bu (2006), Bayraktar and Fofack (2007)].
maintain countries in the trap. On the other hand, countries enjoying constant technological improvement fall in the area of higher equilibrium (top right quadrant) within the vicinity of the global technology frontier (Point A).
The consistent increase in income and technological endowment of countries in the higher equilibrium set is illustrated by a shift towards the global technology frontier in panel II. Since the poverty and technology trap hypothesis assumes the existence of self-reinforcing mechanisms which cause countries to remain poor on the technology ladder and welfare score,
(no technology jump in a low-technology trap).
0
because
0
Δ
=
≡
Δ
B t t B t tY
T
On the other hand, technology jump leads to increase aggregate
output in the higher equilibrium set
(
. Assuming that the moretechnological endowed country A is setting the pace of technological advances at the global level, the point A is located on the global technology frontier; while the point B falls in the first quadrant of dual traps. )) ( ) ( ) ( ( 0 T T T t tA A t A tn
δ
δ
δ
= +Δ0
and
0
)
|
(
•
>
Δ
>
Δ
A t t A t tY
T
T
)
The frontier is shown as being curve inwards (increasing returns to scale assumption) intersecting the 45 degree line in the fourth quadrant (panel I). At time , the technology gap between countries A and B in the x-axis is mirrored by the output gap on the y-axis. The rightward shift on the global technology frontier in the second Panel is the result of technology jump in country
A . Under the technology trap assumption there is no technology jump in country B . The widening technology gap between the two countries (illustrated by the increasing distance from the global technology frontier along the 45 degree line) leads to increasing productivity and output gap between the two countries.
0
t
)
0
)
(
(
Δ
tδ
tAT
>
)
0
)
(
(
Δ
tδ
tBT
=
Now suppose that the initial random matrix
X
r
of dimension is reduced to a vector of n-rows and 2 columns; that is)
,
(
n
p
Tx
x
X
r
=
(
1,
2)
, following the construction of a composite indexsummarizing technology endowment and knowledge. The focus of the analysis is to assess the degree of co-variation between technological progress and income growth. Suppose that the first vector
represents the Knowledge Economy Index (KEI), proxy for technological endowment, and the distribution of Purchasing Power Parity-adjusted per capita income following a logarithmic transformation, both of which are deviated from their mean. The KEI is an aggregate and composite index representing the overall level of development of a country and its progress towards the
knowledge economy.
1
x x2
24
24 The Knowledge Economy Index is produced by the World Bank for cross-countries comparisons on the
scale of knowledge and economic development. This index is constructed from the normalized performance scores of a country averaged across four criteria: economic incentives and institutional framework, human resource development and knowledge accumulation, innovation system, information and communication technology and scientific infrastructures. The development and adoption of this composite index which has become very popular is the resultant of increasing emphasis on the contribution of knowledge, research and development for long-run growth over the past few decades [World Bank (2007)].
Figure 2: Dynamics of normalized growth on the technology ladder
PANEL I
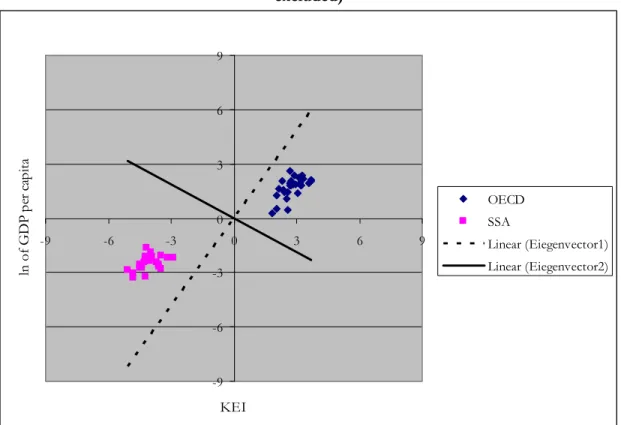
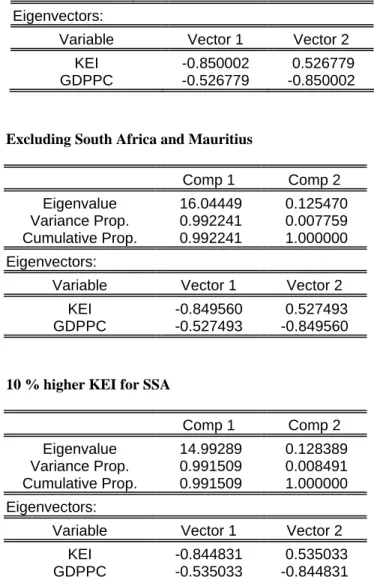
The PCA results are summarized in Table 1 in the Annex. Figure 3 plots the data with overlayed eigenvectors. The Figure plots on the same scale graphs of eigenvectors associated with the whole sample comprising of advanced economies (OECD countries) and Sub-Saharan African countries. In the first panel, the top figure does not include South Africa and Mauritius which have relatively more developed technological and scientific infrastructures, while the second Panel includes these two countries. YAt0 YBt0 TBt0 TAt0 δI t0 δT t0 T I A 45o line Aggregate output Global technology frontier at time t0 Technology gap Income gap B
Technology endowment path
PANEL II
45o line YAtn YBtn TBtn TAtn δI tn δT tn T I A BTechnology endowment path Aggregate output Technology jump Income gap Global technology frontier at time tn YAt0 ΔtδAt(T)
Figure 3: Plot of transformed data with overlayed eigenvectors
PANEL A: OECD and Sub-Saharan African Countries (South Africa and Mauritius excluded) -9 -6 -3 0 3 6 9 -9 -6 -3 0 3 6 9 KEI ln o f G D P pe r c api ta OECD SSA Linear (Eiegenvector1) Linear (Eiegenvector2)
PANEL B: OECD and Sub-Saharan African Countries (South Africa and Mauritius included) -9 -6 -3 0 3 6 9 -9 -6 -3 0 3 6 9 KEI ln of G D P pe r c a p it a OECD SSA Linear (Eiegenvector1) Linear (Eiegenvector2)
The first eigenvector (dotted line), which has the largest eigenvalue, points to the direction of the largest variance (right and upwards), whereas the second eigenvector (solid line), orthogonal to the first one, points to the left and upwards. The first eigenvalue refers to the variable knowledge
economy index (KEI). This eigenvalue is large, explaining over 99 percent of proportional variance in the data. In fact, the cumulative proportional variance associated with this vector is in excess of 99 percent. The large proportional variance associated with this variable is reflected in the scale and norm of the eigenvector in dotted lines, implying that most of the variation in the original bivariate data sets is due to the distribution of knowledge, proxy for technology endowment.
Moreover, the data set is disjoint, with advanced OECD countries falling in the upper right quadrant of higher equilibrium, where countries enjoy both high technology endowment and high income. Furthermore, a disjoint representation is present in the dataset in spite of the initial dispersion in the marginal distribution of advanced economies on both income and technology ladder [Pianta (1995)]. On the other hand, the bottom left quadrant corresponds to the lower equilibrium of dual traps. Except South Africa and Mauritius, which fall around the median, all the other countries are clustered in the lower equilibrium of dual poverty and technology trap.25
IV. Model for estimating the welfare effects of technology enhancement
This section presents a working model of growth with endogenous human capital. This model emphasizes R&D and human capital, which are keys to technology acquisition, productivity growth and innovations in the process of economic development. However, this specification is a slight modification of classic technology-trap models, which require a high capital-labor ratio to achieve a steady-state equilibrium.26 While the proposed model takes into account Africa’s structural
constraints and initial conditions, most notably relatively low capital-labor ratio, macroeconomic instability, integration into the global economy and institutional factors, it also emphasizes research and development investments to capture its ‘technology lag’ on the global technology frontier.27
Let be a neoclassical production function where aggregate output is produced from labor and capital under certain technology . This function is assumed twice differentiable with respect to and . Its first derivatives are positive, the second derivatives are negative, and the cross-derivative between and is positive. The level of technology
influences the derivative of and . Hence output growth is an increasing function of capital and labor, and technological progress has positive incidence on growth. Adjusting for other factors, the standard neoclassical production function can be represented as a variant of the generalized Cobb-Douglas production function of the form:
)
;
,
(
L
K
T
F
Y
=
)
(
L
)
)
(
Y
)
(
K
)
(
L
(
)
(
T
)
K
)
(
K
(
K
)
(
L
(
(
T
L
)
)
;
0
,
0
1,
0
,
1
0
,
<
<
<
<
>
>
=
ξ τ α βα
β
ξ
τ
t t t t tA
B
L
K
Y
(4)25 Recall from section II that South Africa and Mauritius are more diversified economies with expanding
industrial and manufacturing outputs.
26 In particular, these models hypothesize that a country that start with a relatively low capital-labor ratio is
likely to remain in the stagnant steady-sate.
27 This adjustment is important because productivity growth increasingly depends on existing stock of ideas and
the number of people devoting their time to research and accumulation of new ideas in the knowledge economy era.
where is the efficiency variable that will be defined below. Under this specification (4) takes the form of a transcendental production function, where is the general level of technology. The parameters t
B
ξ tA
τ
β
α
,
and
represent the production elasticities of labor, capital and efficiency variable at timet
, respectively. The parameterξ
associated withA
t is the technology-output elasticity. Following Papageorgiou and Perez-Sebastian (2002), R&D is the only link between economies at the global level. Hence, productivity growth depends on the existing stock of ideas and the number of people devoting their time to the accumulation of new ideas. In practice, inventions made in the rest of the world can be absorbed by local scientists at a cost that is inversely proportional to the country technological endowment as part of the technological diffusion process. In this case, the level of technology evolves according to (5).t At t t At t t t A A A R A A A
μ
δ
ψ λ φ − ⎟⎟ ⎠ ⎞ ⎜⎜ ⎝ ⎛ = − +1 * , and⎪
⎪
⎩
⎪
⎪
⎨
⎧
<
+
⎟⎟
⎠
⎞
⎜⎜
⎝
⎛
=
⎟⎟
⎠
⎞
⎜⎜
⎝
⎛
=
+1
if
,
)
-(1
1
if
,
At * * 1 At t t t At t At t t At t tA
A
A
R
A
A
A
R
A
A
δ
δ
μ
δ
μ
ψ λ φ ψ λ φ (5) where<
<
≤
>
A
t>
A
t *and
,
0
,
1
0
,
1
λ
ψ
φ
and 0 * 1, t. A A t t < ∀ ⎟⎟ ⎠ ⎞ ⎜⎜ ⎝ ⎛ < * tA
is the global technology frontier, uniformly superior to the state of technology in Africa and growing exogenously. The time-invariance assumption reflects persistent ‘technology lag’ in the sub-region. Moreover, consistent with the technology trap hypothesis, the model assumes widening technology gap, hence the technology gap parameter)
(
A
t.
0
>
ψ
The parameterφ
weights the effects of the stock of existing technology ( ) in a given country on R&D productivity. R&D productivity is proportional to the state of technology and grows accordingly [Parente and Prescott (1994)]. The rate of depreciation of capital stock and technology is assumed higher in Africa, result of systemicundermaintenance and declining R&D budget [Bu (2006)]. t
A
28
∈
(
0
,
1
]
Atδ
is the rate of depreciation, andδ
At>
δ
At*,
∀
t
, whereδ
At* is the global depreciation rate.The model is technology-driven, and represents the proportion of researchers in the economy at any given time . Over time, the stock of researchers in the economy depends on the size of active labor force, investment in higher education and human capital improvement through on-the-job training and the going stock of ‘brain drain’. The permanence of researchers in a given economy critically depends on countries’ distance from the global technology frontier and business climate. The inter-temporal human capital spillovers across generations are positively linked to human capital accumulation in the next period. The higher the inherited stock of human capital, the more
productive investments in human capital will be. Hence, following Lucas (1988), the rate of change in the population of qualified researchers between periods is represented by:
At
R
t
At Atl
R
R
+1=
(
1
+
γ
θ−
ω
)
(6)28 Bu found depreciation rates of capital stocks to be excessively high in developing countries and particularly
For
0
<
θ
<
1
,
0
≤
ω
≤
1
,
0
<
l
<
1
,
γ
>
0
and where is the proportion of workers investing in human capital improvement. This last variable is growing by a factor ofl
γ
according to anexponential rate
θ
. The parameterω
captures the brain drain effect. This parameter (ω
) equals zero when no qualified researcher leaves the country, an assumption which implies that the country is operating on the global technology frontier. Converselyω
equals one if all highly-skilled people automatically migrate to greener pasture.29 The actual labor force can be represented in terms ofresearchers by , where is the proportion of qualified researchers in the active labor force, and evolves according to (6).
t At t
R
p
L
=
/
p
t AtR
If
λ
captures the decreasing returns to R&D efforts andμ
is the overall technology parameter, then the country technology level in the next period can be expressed in terms of degree of global‘technology lag’, the stock of researchers and the stock of technology in the previous period. Accordingly, aggregate output growth can be expressed in terms of skilled labor, in a context of excess supply of labor and structurally high unemployment rates. Remember that productivity growth primarily depends on technology endowment, existing stock of ideas and the number of active researchers [Jovanovic and Nyarko (1996), Nyarko (2007)].
Assuming that productivity growth primarily depends on stock of ideas and number of active researchers in a given country, R&D productivity can then be taken to be proportional to the state of technology and grows accordingly [Parente and Prescott (1994)]. Productivity also depends on the degree of integration into the world economy and the process of technology diffusion at the global level. Presumably a diffusion process underpinned by a uniform distribution on the spherical space is the ideal model with global benefits. However, the technology diffusion process is inherently skewed, with only a very limited number of globally competitive and efficient economies operating on the global technology frontier [Lucas (2007)].
The persistent technology gap across Sub-Saharan Africa also depends on a number of
considerations, including institutional incentives and efficiency. In a number of models, efficiency is captured by openness to trade [Sachs and Warner (1997)]. Others have modeled efficiency using country risks [Knack and Keefer (1995)].30 The efficiency vector in (4) accounts for trade
openness and macroeconomic instability. Productivity growth is inversely related to macroeconomic instability and uncertainty, and proportional to trade openness through technology diffusion. Building on Kneller and Stevens (2002), the efficiency factor is represented by (7):
t
B
)
exp(
*
)
exp(
σAt κAt υAt to
u
v
B
=
−
(7)where the variable stands for trade openness, and are measure of inflation (macroeconomic instability and volatility) and financial depth, respectively. The parameters
At
o
u
Atv
At29 The two-period model can also be extended to generational human capital transfers if the
inter-temporal human capital spillovers across generations are positively linked to human capital accumulation in the next period [Lucas (1988)]. In other word, the higher the inherited stock of human capital the more productive investments in human capital will be.
30 However, openness to international trade measured by the propensity of imports and exports may not
necessarily reflect the extent of technology acquisition and assimilation. The composition of exports matters and the share of high-tech exports may appear as a better indicator of integration into the global economy.
υ
κ
σ
,
and
are constant elasticity of substitution.31 Although economic inefficiency may originatefrom a host of factors, including institutional, social and geographic and macroeconomic factors, the proposed model focuses on inefficiency factors caused by macroeconomic instability, and particularly inflation and changes in the monetary base.32 Using equations (5)—(7), the initial production
function is represented as follows:
⎪ ⎪ ⎪ ⎩ ⎪ ⎪ ⎪ ⎨ ⎧ ⎢ ⎢ ⎣ ⎡ ⎢ ⎢ ⎣ ⎡ = t t t A A Y
μ
μ
φ φ < ⎥ ⎦ ⎤ ⎢ ⎣ ⎡ ⎥ ⎥ ⎦ ⎤ + ⎟⎟ ⎠ ⎞ ⎜⎜ ⎝ ⎛ = ⎥ ⎦ ⎤ ⎢ ⎣ ⎡ ⎥ ⎥ ⎦ ⎤ ⎟⎟ ⎠ ⎞ ⎜⎜ ⎝ ⎛ 1 if , ) exp( ) exp( ) -(1 1 if , ) exp( ) exp( At * * At t t At At At t t t At At t t At At At t t At K L v u o A A A R K L v u o A A Rδ
δ
δ
β α τ υ κ σ ξ ψ λ β α τ υ κ σ ξ ψ λ (8)Assuming that the depreciation rate of capital stock and technology
δ
At→
1
in the absence of capital injection and investments in maintenance of existing infrastructures in the face of growing fiscal deficits, and expressing labor force as a function of researchers, then the aggregate production function takes the form:33β α τ υ κ σ ξ ψ λ φ
μ
t tA
R
Y
⎢
⎢
⎣
⎡
=
t t At At At At t t AtK
p
R
v
u
o
A
A
⎟⎟
⎠
⎞
⎜⎜
⎝
⎛
⎥
⎦
⎤
⎢
⎣
⎡
⎥
⎥
⎦
⎤
⎟⎟
⎠
⎞
⎜⎜
⎝
⎛
)
exp(
)
exp(
* (9)Taking the logarithm across (9) and rearranging it results in the following:
t At At At t t At t t o u v K A A R p A
ξ
lnμ
α
ln (ξλ
α
)lnξψ
ln * ⎟⎟+τσ
−τκ
−τυ
+β
ln ⎠ ⎞ ⎜⎜ ⎝ ⎛ + + + − + t Y ln ln =ξφ
(10) or t t At At At t t At t o u v p K A A R A ln ln ln ln ln 2 3 * 4 5 6 7 8 1α
α
α
α
α
α
α
α
⎟⎟+ + + + + ⎠ ⎞ ⎜⎜ ⎝ ⎛ + + + t Y ln =α
0α
Whereβ
α
α
α
τυ
α
τκ
α
τσ
ξψ
α
α
ξλ
α
ξφ
α
μ
ξ
α
=
−
=
−
=
−
=
=
+
=
=
8 7 6 5 3 2 1,
,
,
,
,
),
(
,
,
ln
=
=
4 0 .31 This formulation is a slightly modified version of Kneller and Stevens (2002). They account for inefficiency
by including an indicator variable
η
itin their model(
0
<
η
it<
1
)
. A country is fully efficient and produces onthe frontier when
(
η
it=
1
)
; otherwise it produces inefficiently with the degree of inefficiency measured by the size ofη
it.32 For instance Battese and Coelli measure inefficiency by a conditional distribution, which has mean level of
inefficiency derived from a set of economic, geographic and social factors which affect technical efficiency.
33 This assumption is used for all practical purposes, though depreciation rates already generally high in the
The technology lag , which measures the distance from the global technology frontier, is proxied by the proportion of high-tech exports of the sub-region. Capital accumulation is proxied by investments. Other variables in the model are consistent and accordingly defined.
)
/
(
A
tA
t*34 This specification
takes into account the constraint of data availability. Unlike advanced economies, the data on R&D is not always readily available in most developing countries. In this framework they are estimated from a method which combines simulation and instrumented parameters from OECD data. More specifically, R&D elasticity of economic growth is estimated from a panel of OECD countries using the model. A random number generator is then used to construct an R&D vector consistent with R&D empirical distributions in Sub-Saharan Africa.
The simulated R&D vector and estimated R&D elasticity of growth from OECD countries are used to draw inference on the implications of technological advances for growth and welfare in SSA. In particular, a marginal and joint variation of R&D elasticity of growth around the mean value and uniform changes in R&D scale are considered in assessing the expected welfare effects. The impact of technological changes measured primarily by R&D increases on poverty is also considered, drawing on the recursive modeling assumption. In particular and following Kakwani and Pernia (2000), poverty indices at any given period depend on the rate in the previous period, the poverty and growth elasticity and per capita GDP growth rates.35
V. Estimation and policy implications
Estimation and applications are based on a pseudo-panel data covering the period 1990-2001. The focus is inference on income and welfare effects of advances in sciences and technology through increased research and development expenditures. The results and calibration are based on equation (10). A marginal and joint variation of R&D elasticity of growth and uniform changes in R&D scale are considered, in turn. The link to micro data and household survey allows inference on poverty. The first simulation assumes increases expenditures on research and development under constant R&D elasticity of growth. The regression coefficients in equation (10) are either elasticities or semi-elasticities and provide the proportionate change in the conditional mean of aggregate output when the specified regressor is subject to changes.36 Under the base case scenario, the estimated R&D
elasticity of growth is set at the average going rates across OECD countries (8 percent). The sign and magnitude of growth elasticity are consistent with estimates obtained in the literature, which
establishes a positive association between R&D and economic growth [Mansfield (1972), Gittleman and Wolff (1995)].
Table 2 in the Annex reports the econometric results.37 The likelihood test rejects the null hypothesis
that the underlined model does not provide a good prediction of GDP. In particular, the F-statistic is
34 Aggregate output is estimated in constant 2000US$; openness is estimated as the sum of exports and imports
expressed as a percentage of GDP; financial depth is proxied by M2 over GDP and macroeconomic instability is measured by inflation rate of consumer price index.
35 That is ( ) ( ) (1 )ˆ , where ) , ( 1 tGDP t t P
P
α
= −α
∗ −δ
θ
δ
is the poverty and growth elasticity, is the growth rate of GDP per capita and) , (
ˆ
GDP tθ
).
2
0
(
≤
α
≤
We are particularly interested in the poverty incidence rate(
α
=
0
)
. For further details on the methodology see Kakwani and Pernia (2000).36 The parameters are elasticities when the regressors are taken in logs and semi-elasticities when they are not. 37 In addition to R&D the basic model (constant R&D elasticity of growth) considers five exogenous variables
for their potential impact on growth: M2 in GDP to capture the financial depth, investment, inflation rate of consumer price index to capture macroeconomic volatility, the sum of imports and exports over GDP to capture the degree of economic openness, and high-tech exports as a share of total exports. This last variable also highlights the degree of economic diversification and integration into the global economy.