Flood Damage Reduction
Technical Appendix
Flood Damage R
e
UPPER SAN JOAQUIN RIVER BASIN STORAGE INVESTIGATION
Initial Alternatives Information Report
Flood Damage Reduction Technical Appendix
TABLE OF CONTENTS
Chapter Page
CHAPTER 1. INTRODUCTION ... 1-1
STUDY AREA ...1-2 SURFACE WATER STORAGE MEASURES CONSIDERED IN THE IAIR ...1-3 OBJECTIVE OF THIS TECHNICAL APPENDIX ...1-5 ORGANIZATION OF THIS TECHNICAL APPENDIX ...1-5
CHAPTER 2. EXISTING CONDITIONS ... 2-1
HISTORICAL PERSPECTIVE OF FLOOD PROTECTION IN THE SAN JOAQUIN
RIVER BASIN ...2-1 DESCRIPTION OF EXISTING FLOOD MANAGEMENT FACILITIES ...2-3 Friant Dam and Millerton Lake ...2-3 Hidden Dam and Hensley Lake...2-4 Buchanan Dam and H. V. Eastman Lake...2-4 Chowchilla Canal Bypass and Eastside Bypass ...2-4 Pine Flat Dam and Reservoir and Related Kings River Facilities ...2-5 New Exchequer Dam and Lake McClure ...2-5 Don Pedro Dam and Reservoir ...2-6 New Melones Dam and Reservoir...2-6 MAJOR RECENT FLOODS ...2-6 Flood of 1955 ...2-6 Flood of 1967 ...2-7 Flood of 1983 ...2-7 Flood of 1986 ...2-7 Flood of 1995 ...2-7 Flood of 1997 ...2-8
CHAPTER 3. ANALYTICAL METHODOLOGY ... 3-1
HYDROLOGY AND RESERVOIR OPERATIONS...3-1 Synthetic Hydrology ...3-1 Composite Floodplain...3-3 HEC-5 Models ...3-3 Flood Control Operation ...3-4 HYDRAULICS ...3-5 San Joaquin River Basin UNET Model ...3-5
Table of Contents Flood Damage Reduction Technical Appendix Assumptions and Limitations of the UNET Model...3-6 UNET Model Development ...3-6 Levee Failure Methodology...3-7 ECONOMICS ...3-9 HEC-FDA Model...3-9 Development of Economic Data...3-9 Considerations and Assumptions...3-10 Determination of Expected Annual Damages ...3-11
CHAPTER 4. PRELIMINARY EVALUATIONS ... 4-1
SCENARIO 1 - FUTURE WITHOUT-PROJECT CONDITIONS ...4-1 Hydrology ...4-1 Hydraulics...4-2 Economics...4-2 SCENARIO 2 - ADDITIONAL FLOOD MANAGEMENT STORAGE AT FRIANT DAM ...4-4 Hydrology ...4-4 Hydraulics...4-5 Economics...4-6 SCENARIO 3 – ADDED FLOOD MANAGEMENT STORAGE AND REDUCED
OBJECTIVE RELEASE...4-8 Hydrology ...4-9 Hydraulics...4-10 Economics...4-11 CONCLUSIONS...4-11
CHAPTER 5. LIST OF PREPARERS ... 5-1 CHAPTER 6. REFERENCES ... 6-1
Flood Damage Reduction Technical Appendix Table of Contents
LIST OF TABLES
TABLE 4-1. FUTURE WITHOUT-PROJECT CONDITIONS EXPECTED ANNUAL
DAMAGES ...4-3 TABLE 4-2. SCENARIO 2 EVALUATIONS – ENLARGED FLOOD MANAGEMENT
SPACE...4-4 TABLE 4-3. SCENARIO 2 EVALUATIONS – EFFECT ON RIVER STAGES OF
OPERATIONS WITH ENLARGED FLOOD MANAGEMENT SPACE ...4-6 TABLE 4-4. EXPECTED ANNUAL DAMAGES FOR ADDITIONAL FLOOD
MANAGEMENT STORAGE ...4-7 TABLE 4-5. SCENARIO 3 EVALUATIONS – EFFECT ON RIVER STAGES OF
OPERATIONS WITH ENLARGED FLOOD MANAGEMENT SPACE AND
4,000 CFS OBJECTIVE RELEASE ...4-10 TABLE 4-6. EXPECTED ANNUAL DAMAGES FOR ADDITIONAL FLOOD
MANAGEMENT STORAGE AND 4,000 CFS OBJECTIVE RELEASE ...4-12 TABLE 4-7. EXPECTED ANNUAL DAMAGES FOR ADDITIONAL FLOOD
Table of Contents Flood Damage Reduction Technical Appendix
LIST OF FIGURES
FIGURE 1-1. UPPER SAN JOAQUIN RIVER BASIN STORAGE INVESTIGATION STUDY AREA EMPHASIS ...1-2 FIGURE 1-2. STUDY AREA FOR FLOOD DAMAGE REDUCTION EVALUATION...1-3 FIGURE 1-3. SURFACE WATER STORAGE MEASURES RETAINED IN PHASE 1 AND
SUGGESTED DURING SCOPING ...1-4 FIGURE 2-1. EXISTING FLOOD MANAGEMENT FACILITIES IN THE SAN JOAQUIN
RIVER BASIN ...2-3 FIGURE 3-1. DEVELOPMENT OF SYNTHETIC RAINFLOOD HYDROGRAPHS...3-2 FIGURE 3-2. TYPICAL STAGE-FREQUENCY CURVE...3-7 FIGURE 3-3. SAN JOAQUIN RIVER BASIN IMPACT AREAS ...3-8 FIGURE 3-4. CONCEPTUAL RISK APPROACH FOR ESTIMATING FLOOD DAMAGE...3-12 FIGURE 4-1. SIMULATED OPERATIONS OF WITHOUT-PROJECT FLOOD
MANAGEMENT AT FRIANT DAM ...4-2 FIGURE 4-2. SIMULATED OPERATIONS OF ENLARGED FLOOD MANAGEMENT
STORAGE AT FRIANT DAM...4-5 FIGURE 4-3. TOTAL EXPECTED ANNUAL DAMAGES FOR ADDITIONAL FLOOD
MANAGEMENT STORAGE ...4-8 FIGURE 4-4. SIMULATED OPERATIONS OF ENLARGED FLOOD MANAGEMENT
STORAGE AND 4,000 CFS OBJECTIVE RELEASE AT FRIANT DAM ...4-9 FIGURE 4-5. TOTAL EXPECTED ANNUAL DAMAGES FOR ADDITIONAL FLOOD
Flood Damage Reduction Technical Appendix Table of Contents
ABBREVIATIONS AND ACRONYMS
BDPAC California Bay-Delta Public Advisory Committee
CALFED CALFED Bay-Delta Program
CBDA California Bay-Delta Authority
cfs cubic feet per second
Comprehensive Study Sacramento and San Joaquin River Basins Comprehensive Study
Corps U.S.s Army Corps of Engineers
CVP Central Valley Project
Delta Sacramento-San Joaquin Delta
DSS Data Storage System
DWR California Department of Water Resources
EAD Estimated Annual Damages
EIR Environmental Impact Report
EIS Environmental Impact Statement
FDA Flood Damage Analysis
FR Feasibility Report
GIS geographic information system
HEC Hydrologic Engineering Center
IAIR Initial Alternatives Information Report
Investigation Upper San Joaquin River Basin Storage Investigation
LFP likely failure point
P&G Economic and Environmental Principles and Guidelines
for Water and Related Land Resources Implementation Studies
PFR Plan Formulation Report
Reclamation U.S. Department of the Interior, Bureau of Reclamation
RM River mile
ROD Record of Decision
SCE Southern California Edison Company
State State of California
TA Technical Appendix
TAF thousand acre-feet
TID Turlock Irrigation District
Table of Contents Flood Damage Reduction Technical Appendix
CHAPTER 1. INTRODUCTION
This document is the Flood Damage Reduction Technical Appendix (TA) to the Initial Alternatives Information Report (IAIR) for the Upper San Joaquin River Basin Storage Investigation (Investigation). The Investigation is one of five surface water storage studies recommended in the CALFED Bay-Delta Program (CALFED) Programmatic Environmental Impact Statement/Report (PEIS/R) Record of Decision (ROD) of August 2000. It is being performed by the U. S. Department of the Interior, Bureau of Reclamation (Reclamation), and the California Department of Water Resources (DWR). The Investigation is a feasibility study evaluating alternatives to develop water supplies from the San Joaquin River that could
contribute to the restoration of, and improve water quality in, the San Joaquin River, and enhance conjunctive management and exchanges to provide high-quality water to urban areas.
The Investigation is being prepared in two phases. Phase 1, which included preliminary screening of initial storage sites, was completed in October 2003. Initially, 17 surface water storage sites were considered, of which 6 were retained for further analysis. Phase 2 began in January 2004 with formal initiation of environmental review processes consistent with Federal and State of California (State) regulations, and will continue through completion of all study requirements. The Investigation will culminate in a Feasibility Report (FR) and supporting environmental documents consistent with the Economic and Environmental Principles and Guidelines for Water and Related Land Resources Implementation Studies (P&G) (WRC, 1983), Reclamation directives, DWR guidance, and applicable environmental laws. Reclamation and DWR are coordinating the Investigation with the California Bay-Delta Public Advisory
Committee (BDPAC), which provides advice to the Secretary of the United States Department of the Interior (Secretary) regarding the implementation of the CALFED Program, and the
California Bay-Delta Authority (CBDA), which provides general oversight and coordination of all CALFED activities.
To facilitate coordination with other agencies and related ongoing studies, preparation of the FR will include two interim planning documents: an Initial Alternatives Information Report (IAIR) and a subsequent Plan Formulation Report (PFR). The IAIR describes without-project conditions and water resources problems and needs; defines study objectives and constraints; screens
surface water storage measures; describes groundwater storage measures development; and identifies preliminary water operations rules and scenarios. Retained storage measures and preliminary water operations scenarios will be included in initial alternatives. This IAIR will be used as an initial component of the FR. The PFR will present the results of initial alternatives evaluation, identify refinements of the alternatives, and define a set of final alternatives. A Draft FR will evaluate and compare the final alternatives and identify a recommended plan. A Draft Environmental Impact Statement (EIS) and Environmental Impact Report (EIR) will be included with the Draft FR. Following public review and comment, a final FR/EIS/EIR will be prepared.
Chapter 1
Introduction Flood Damage Reduction Technical Appendix
STUDY AREA
The study area emphasis for the Investigation encompasses the San Joaquin River watershed upstream of Friant Dam, the San Joaquin River from Friant Dam to the Sacramento-San Joaquin Delta (Delta), and the portions of the San Joaquin and Tulare Lake hydrologic regions served by the Friant-Kern and Madera canals, as highlighted in Figure 1-1. The study area includes all potential storage sites under consideration, the region served by the Friant Division of the Central Valley Project (CVP), the eastern San Joaquin Valley groundwater basins, and the portion of the San Joaquin River most directly affected by the operation of Friant Dam. The study area includes a primary study area and an extended study area. The primary study area for potential flood damage reduction evaluations presented in this TA is the San Joaquin River flood management system, from Pine Flat Dam to the Delta. Levees along the river, dedicated flood bypass channels, and flood storage space in numerous reservoirs on all major tributaries to the San Joaquin River, shown in Figure 1-2, protect this region from flooding.
FIGURE 1-1.
UPPER SAN JOAQUIN RIVER BASIN STORAGE INVESTIGATION STUDY AREA EMPHASIS
Chapter 1
Flood Damage Reduction Technical Appendix Introduction
FIGURE 1-2.
STUDY AREA FOR FLOOD DAMAGE REDUCTION EVALUATION SURFACE WATER STORAGE MEASURES CONSIDERED IN THE IAIR
Six potential sites for developing a new surface reservoir or enlarging an existing reservoir were retained from Phase 1 of the Investigation for further consideration in the Investigation. Each site could be configured at various storage sizes, with each configuration identified as a measure. The six surface water storage sites retained from Phase 1 include:
• Raise Friant Dam. Enlarging Millerton Lake by raising Friant Dam up to 140 feet.
• Temperance Flat Reservoir. Constructing Temperance Flat dam and reservoir at one of three potential dam sites on the San Joaquin River, between Friant and Kerckhoff dams, at River Mile (RM) 274, RM 279, or RM 286.
• Fine Gold Reservoir. Constructing a dam and reservoir on Fine Gold Creek to store water diverted from the San Joaquin River or pumped from Millerton Lake.
• Yokohl Valley Reservoir. Constructing a dam and reservoir in Yokohl Valley to store water conveyed from Millerton Lake by the Friant-Kern Canal and pumped into the reservoir. Most of the surface water storage measures retained from Phase 1 would result in a net loss in power generation. In March 2004, Reclamation and DWR held a series of scoping meetings to initiate development of an EIS/EIR. During scoping, power utilities that own and operate
Chapter 1
Introduction Flood Damage Reduction Technical Appendix
hydropower projects in the upper San Joaquin River basin raised concerns about impacts of lost power generation and the ability of retained measures to develop adequate replacement power. These hydropower stakeholders suggested five additional potential reservoir sites that could store water supplies from the upper San Joaquin River without adversely affecting existing
hydropower facility operations.
Suggested storage measures include RM 315 Reservoir on the San Joaquin River between Redinger Lake and Mammoth Pool, and Granite Project (Granite Creek and Graveyard Meadow reservoirs) and Jackass-Chiquito Project (Jackass and Chiquito reservoirs) on tributaries to the San Joaquin River upstream of Mammoth Pool. The scoping comments also suggested combining these upstream storage measures with a gravity diversion tunnel from Kerckhoff Lake to a Fine Gold Reservoir.
The locations of the six surface water storage sites retained from Phase 1 and sites suggested during scoping are shown in Figure 1-3. This TA evaluates changes in flood damages that would result from the hypothetical addition of dedicated flood storage at or upstream of Millerton Lake and does not specifically evaluate flood operations at any of the retained surface water storage measures.
FIGURE 1-3.
SURFACE WATER STORAGE SITES RETAINED FROM PHASE 1 AND SUGGESTED DURING SCOPING
Chapter 1
Flood Damage Reduction Technical Appendix Introduction
OBJECTIVE OF THIS TECHNICAL APPENDIX
This TA contains preliminary evaluations that are intended to identify the type and magnitude of potential flood damage reduction that could be developed with additional storage. Evaluation scenarios described in this TA were selected specifically for this purpose, and are not intended to represent a proposed allocation for flood management. Information in this TA will be used during plan formulation in the development of multiple-purpose storage and operational alternatives. This TA does not evaluate potential flood damage reduction for each retained
surface water storage measure; rather, the TA evaluates the types of flood protection benefits that could result from increasing dedicated flood storage space at Friant Dam, regardless of the specific storage measure.
ORGANIZATION OF THIS TECHNICAL APPENDIX
This document is one of several TAs to the IAIR. It presents preliminary information on flood damage reduction potential from increasing flood storage space as part of the surface storage measures described in the IAIR. The costs for operation of any new flood storage are not presented in this TA. All preliminary cost and design information for the Investigation is included in the Engineering TA to the IAIR.
This introductory chapter provides background on the flood-related benefits analysis performed for the Investigation. Chapter 2 describes the existing flood management system in the San Joaquin River basin. Chapter 3 describes the hydrologic, hydraulic, and economic models developed by the United States Army Corps of Engineers (Corps) and the State Reclamation Board that were used in this analysis. Chapter 4 describes the potential flood-related benefits identified through preliminary evaluations. Chapter 5 contains a list of those who helped prepare this TA. Chapter 6 includes sources of information used to prepare the TA.
Chapter 1
Introduction Flood Damage Reduction Technical Appendix
CHAPTER 2. EXISTING CONDITIONS
This chapter describes the historical setting and development of flood protection facilities in the San Joaquin Valley. It begins with a description of early development and the need for flood protection, accompanied by a discussion of early flood protection planning efforts. Major recent floods are summarized. Finally, the development of the current flood management system is described. Much of the following description of the existing flood management system in the San Joaquin River basin was drawn from the report Sacramento and San Joaquin River Basins Post-Flood Assessment for 1983, 1986, 1995, and 1997 (Corps, 1999).
HISTORICAL PERSPECTIVE OF FLOOD PROTECTION IN THE SAN JOAQUIN RIVER BASIN
Over time, the climate and geography of the Central Valley combined to produce an area where regular flooding is a natural phenomenon. Under natural conditions, the channels of the San Joaquin River had insufficient capacity to carry the heavy winter and spring flows generated by wet season precipitation and/or snowmelt. Runoff from the Sierra Nevada Mountains and the Coast Range would rapidly run off to the valley floor in several rivers. Once flows exceeded channel capacity, the channels overflowed onto the surrounding countryside forming vast floodplains. The flow velocity in the overbank areas was greatly reduced from that in the channel. Thus, the sediment-carrying capacity was also reduced, allowing material naturally eroded from mountain and foothill areas and carried in streams to drop out of suspension. In this way, over many years, the San Joaquin River built up its bed and formed natural levees composed of heavier, coarser material carried by flood flows. Finer material stayed in
suspension much longer and dropped out when overflow water ponded in basins that developed east and west of the rivers. The higher elevation land formed by the natural levees attracted the first settlements in the Central Valley. In the early 1800s, settlers and Native Americans
described the Sacramento and San Joaquin rivers as “miles wide” during flooding. Initial flood protection in the Central Valley developed in a piecemeal fashion with the
construction of levees to protect local areas from flooding. Levees were typically constructed in response to a past flood, with little or no coordination between different localities.
Flood management in the San Joaquin Valley began with the construction of levees to reclaim fertile tule lands and to protect against out-of-bank flows. As the private levee system developed, with each levee intended to protect a different tract of land, the protection afforded by individual levees decreased due to the increased heights of floodwaters constrained between the levees. The increased flood danger led to competition between landowners to continually raise and
strengthen levees by stages to protect local areas and direct flood waters elsewhere. By the early 1900s, it was evident that local efforts would not be adequate to provide flood protection to agricultural lands in the Sacramento River and San Joaquin River basins. In 1920, Colonel Robert Marshall, chief geographer for the United States Geological Survey (USGS), proposed a major water storage and conveyance plan to transfer water from Northern California to meet urban and agricultural needs of Central and Southern California. This plan ultimately provided the framework for development of the Central Valley Project (CVP). Under the
Chapter 2
Existing Conditions Flood Damage Reduction Technical Appendix
Marshall Plan, a dam would be constructed on the San Joaquin River near Friant to divert water north and south to areas in the eastern portion of the San Joaquin Valley and provide flood protection to downstream areas. The diverted water would provide a supplemental supply to relieve some of the dependency on groundwater that had led to overdraft in areas of the eastern San Joaquin Valley. Water in the Sacramento Valley would be collected, stored, and transferred to the San Joaquin Valley by a series of reservoirs, pumps, and canals.
In 1933, the California State legislature approved the Central Valley Project Act, which
authorized construction of initial features of the CVP, including Shasta Dam; Friant Dam; power transmission facilities from Shasta to Tracy; and the Contra Costa, Delta-Mendota, Madera, and Friant-Kern canals. The act authorized the sale of revenue bonds to construct the project, but during the Great Depression the bonds could not be sold. The State appealed to the Federal Government for assistance in constructing the CVP.
With the passage of the Rivers and Harbors Act of 1935, Congress appropriated funds and authorized construction of the CVP by the Corps. When the act was reauthorized in 1937, construction and operation of the CVP were assigned to Reclamation, and the project became subject to Reclamation Law. Construction of the CVP began on October 19, 1937, with the Contra Costa Canal. Construction of Shasta Dam began in 1938 and completed for full operation in 1949. Friant Dam, on the San Joaquin River, was also completed in 1949.
The Flood Control Act of 1944 authorized the Lower San Joaquin River and Tributaries Project. The Project included constructing levees on the San Joaquin River below the Merced River, Stanislaus River, Old River, Paradise Cut, and Camp Slough. Construction was initiated on the Lower San Joaquin River and Tributaries Project in 1956.The project also included construction of New Hogan Dam on the Calaveras River, New Melones Dam on the Stanislaus River, and Don Pedro Dam on the Tuolumne River. New Melones Dam was later reauthorized for
construction under the Flood Control Act of 1962. The Chowchilla and Eastside bypasses were constructed by the State of California as part of the Lower San Joaquin River Project.
The Flood Control Act of 1944 also authorized construction of Isabella, Success, Terminus, and Pine Flat dams on rivers in the Tulare Lake basin. Following major flooding in 1955,
construction of levees and bypasses on the San Joaquin River upstream from the Merced River was authorized. In 1962 to 1963, Congress authorized construction of Buchanan Dam on the Chowchilla River and Hidden Dam on the Fresno River, and authorized Federal participation in the cost of New Exchequer Dam on the Merced River. In addition to flood protection, all of these reservoirs provide water supplies for irrigation uses and, in some cases, hydropower generation. Also, recreation facilities were developed at several of these reservoirs and the dams are
operated, in part, to meet downstream fish and wildlife requirements.
Several smaller flood control projects also have been developed in the Sierra Nevada foothills in the San Joaquin River basin. These projects generally consist of dry dams constructed to protect downstream metropolitan areas and nearby agricultural lands. The Merced County Stream Group Project was constructed to restrict flood flows on several streams to nondamaging levels from the foothill line to the city of Merced. The Redbank and Fancher Creeks Project was constructed to provide flood protection to the Fresno-Clovis metropolitan area and nearby agricultural land. Farmington Dam, on Little Johns Creek, provides flood protection for intensely developed agricultural lands below the dam, the city of Stockton, and the rural towns of Farmington and French Camp.
Chapter 2
Flood Damage Reduction Technical Appendix Existing Conditions
DESCRIPTION OF EXISTING FLOOD MANAGEMENT FACILITIES
This section briefly describes existing flood management facilities in the San Joaquin River basin. All described facilities are shown in Figure 2-1.
FIGURE 2-1.
EXISTING FLOOD MANAGEMENT FACILITIES IN THE SAN JOAQUIN RIVER BASIN
Friant Dam and Millerton Lake
Friant Dam is a 319-foot-high and 3,488-foot-long concrete gravity dam on the San Joaquin River about 20 miles northeast of Fresno and 25 miles east of Madera. The dam is located at approximately River Mile (RM) 270 on the San Joaquin River. Friant Dam and Millerton Lake were completed in 1949 and are owned, operated, and maintained by Reclamation as part of the CVP. Millerton Lake, formed by Friant Dam, has a gross storage capacity of 520.5 TAF, and a flood management reservation of 170 TAF, which protects hundreds of square miles of leveed agricultural land, infrastructure, and some limited urbanized areas (Firebaugh and Mendota) along the San Joaquin River. To the extent possible, Friant Dam is operated during flood
conditions to maintain objective flows in the San Joaquin River at or below 8,000 cubic feet per second (cfs).
Chapter 2
Existing Conditions Flood Damage Reduction Technical Appendix
The Southern California Edison Company (SCE) operates six major storage reservoirs upstream from Friant Dam aggregating about 560 TAF of reservoir storage. These reservoirs are Florence Lake, Huntington Lake, Mammoth Pool, Shaver Lake, Redinger Lake, and Lake Thomas A. Edison. These reservoirs have considerable influence in reducing rain and snowmelt floods, but have no dedicated flood management storage reservation. An agreement allows credit for up to 85 TAF of flood space designated in Millerton Lake at Mammoth Pool reservoir.
Hidden Dam and Hensley Lake
Hidden Dam, completed in 1975, is on the Fresno River about 15 miles northeast of the City of Madera and is owned, operated, and maintained by the Corps. It provides flood protection to the city of Madera and agricultural lands downstream. Hensley Lake, formed by the 163-foot-high and 5,730-foot-long earthfill dam, has a gross pool of 90 TAF and a flood management
reservation of 65 TAF.
Buchanan Dam and H. V. Eastman Lake
Buchanan Dam, completed in 1975, is owned, operated, and maintained by the Corps to provide flood protection to the City of Chowchilla and the highly developed agricultural areas below the dam. The project is on the Chowchilla River about 16 miles northeast of the City of Chowchilla. The 206-foot-high and 1,800-foot-long rockfill dam, with a gross pool of 150 TAF, is operated with a 45 TAF flood management reservation and a combined downstream objective release of 7,000 cfs via Ash (5,000 cfs) and Berenda (2,000 cfs) sloughs.
Chowchilla Canal Bypass and Eastside Bypass
The Chowchilla Canal Bypass is a component of the Lower San Joaquin River and Tributaries Project. The bypass begins at the San Joaquin River downstream from Gravelly Ford (RM 233), and conveys San Joaquin River flows northwest to the Fresno River where it enters the Eastside Bypass. The Chowchilla Canal Bypass provides flood damage reduction for downstream
agricultural lands and urban areas. San Joaquin River flows from Friant Dam are diverted to the bypass through the Chowchilla Canal Bypass Control Structure, commonly called the
“bifurcation structure,” which is operated by the Lower San Joaquin Levee District. The stated channel capacity of the Chowchilla Canal Bypass is 5,500 cfs. The bypass is constructed in highly permeable soils, and much of the initial flood flows infiltrate and recharge groundwater. The Eastside Bypass begins at the Fresno River, runs northwest, and ends at the San Joaquin River between Fremont Ford and Bear Creek. A component of the Lower San Joaquin River and Tributaries Project, the bypass intercepts flows from the Chowchilla Canal Bypass, Fresno and Chowchilla rivers, Berenda and Ash sloughs, and Merced County streams, including Bear Creek, and carries them to the San Joaquin River.
The stated capacity of the Eastside Bypass begins at 10,000 cfs at the bifurcation from the Fresno River and increases in increments to a maximum of 17,000 cfs after crossing Ash Slough. Actual capacities may be less due to subsidence under sections of the Eastside Bypass levees. Flows at the downstream end of the bypass are controlled by the Eastside and Mariposa Bypass control structures, which split the flows to either continue down the Eastside Bypass or enter the San Joaquin River through the Mariposa Bypass.
Chapter 2
Flood Damage Reduction Technical Appendix Existing Conditions
Pine Flat Dam and Reservoir and Related Kings River Facilities
Pine Flat Dam, completed in 1954, is owned, operated, and maintained by the Corps. The dam is on the Kings River about 28 miles northeast of Fresno and provides flood protection to 200,000 acres of agricultural land in the Tulare Lake area. Pine Flat Dam is a 429-foot-high and 1,820-foot-long concrete gravity dam with a gross pool of 1,000 TAF and a flood management reservation of 475 TAF. The major goal of the flood operation of Pine Flat Dam and objective release of 4,750 cfs below Crescent Weir is to prevent flooding of farmland along over 100 miles of the Kings River (in the Tulare Lakebed) and on the San Joaquin River.
The Army Weir, constructed in 1943, controls the flow split between Kings River South (south to Tulare Lakebed) and Kings River North (north to the San Joaquin River). Although
constructed by, and under the jurisdiction of, the Corps, permission was granted to the Kings River Water Association to operate the structure according to agreements among the water users. The Association operates the weir to maximize the flow north into the San Joaquin River up to a total of 4,750 cfs to partially relieve flooding within the Tulare Lakebed to the south. When flows exceed 4,750 cfs, the excess, up to 1,200 cfs, is diverted to the south. All flows over 5,950 cfs are sent north until maximum diversions at Crescent Weir are reached.
The Crescent Weir began operation on Kings River North in 1939; it is maintained and operated by the Crescent Canal Company under an agreement with the Zalda Reclamation District. The concrete weir has 18 openings and uses flashboards for flow control. The flow in the Kings River North is controlled by the Army Weir first, then by the Crescent Weir. The reclamation district controls flows greater than 4,750 cfs at the Crescent Weir by sending the first 4,750 cfs north and the excess, up to a maximum of 2,000 cfs, to the south. Flows greater than 7,950 cfs in the Kings River North (4,750 cfs north, 1,200 cfs south from the Army Weir, and 2,000 cfs south from the Crescent Weir) are divided by the Army and Crescent weirs equally between north and south with consideration for existing levee and channel conditions.
Kings River North feeds into Fresno Slough, Fish Slough, and James Bypass and has a design flood management capacity of 4,750 cfs, which corresponds to the first level of flood releases. It is possible, at times, that irrigation flows are added to this floodflow. The broad flood channels of Kings River North are farmed in the spring, and property owners are notified when flood releases are planned to be sent north so they may remove farm equipment.
The James Bypass is a leveed channel beginning in the lower Kings River basin at the end of the Kings River North and running northwest to end at the Fresno Slough. The Fresno Slough transports overflows from the Kings River from the James Bypass to the Mendota Pool. Excess water in the Mendota Pool overflows into the San Joaquin River.
New Exchequer Dam and Lake McClure
New Exchequer Dam is on the Merced River about 25 miles northeast of the City of Merced. The dam, completed in 1966, is a 1,220-foot-long and 490-foot-high rockfill structure, with a 1,500-foot-long and 62-foot-high rock and earthfill dike. The dam and lake, which are owned, operated, and maintained by the Merced Irrigation District, provide flood protection to prime agricultural lands below the dam and to the communities of Livingston, Snelling, Cressy, and Atwater. New Exchequer Dam has a gross pool capacity of 1,024 TAF and a flood management reservation of 350 TAF, with a downstream objective release of 6,000 cfs in the Merced River at Stevinson.
Chapter 2
Existing Conditions Flood Damage Reduction Technical Appendix
Don Pedro Dam and Reservoir
The new Don Pedro Dam is on the Tuolumne River, about 28 miles west of Modesto. The dam was constructed in 1971 jointly by Turlock Irrigation District (TID) and Modesto Irrigation District with participation by the City and County of San Francisco. However, only TID operates and maintains the dam. An earth and rockfill dam 580 feet high and 1,900 feet long, Don Pedro Dam impounds more than 2,030 TAF of water, with a maximum flood management reservation of 340 TAF. This dam provides flood management for agricultural property,
infrastructure, and some low areas in suburban Modesto by controlling rain and snowmelt floods to a downstream objective release of 9,000 cfs.
New Melones Dam and Reservoir
New Melones Dam replaced the original Melones Dam and was completed by the Corps in 1978 and approved to begin operation in 1983. The dam is on the Stanislaus River, 35 miles northeast of Modesto. New Melones Dam and Lake are owned, operated, and maintained by Reclamation as a unit of the CVP. The dam is an earth and rockfill structure 625 feet high and 1,560 feet long, creating a lake with a capacity of 2,420 TAF, 450 TAF of which are reserved for flood management. Flood management, following the Water Control Manual prepared by the Corps, protects more than 35,000 acres of leveed agricultural land, infrastructure, and some limited urbanized areas in Oakdale, Riverbank, and Ripon along the Stanislaus and San Joaquin rivers. MAJOR RECENT FLOODS
Between 1900 and 1997, the Sacramento River and San Joaquin River basins experienced 13 destructive floods. Each flood resulted from a storm located in a different portion of the Central Valley with unique characteristics. In addition, these floods occurred under different levels of development of the flood management systems described in the previous sections. The most recent floods — in 1983, 1986, 1995, and 1997 — caused extensive damages in both the Sacramento River and San Joaquin River basins and raised questions about the adequacy of the current flood management systems and land use in the floodplains. In response to these floods, Congress authorized the Corps in 1997 to undertake a comprehensive study of the flood damage reduction facilities in the Sacramento River and San Joaquin River basins, and to prepare a summary of recent flood events. The following flood event descriptions are drawn from previous (Corps, 1999) documentation.
Flood of 1955
The flood of 1955 occurred in December, was centered north of Friant Dam, and was more intense in the northern portions of the San Joaquin Valley and in the Sacramento Valley. Prior to the start of the flood, Millerton Reservoir was well below flood management space and, as a result, flows on the San Joaquin River were completely controlled by Friant Dam. If storage had been at the allowable flood management level, releases from Friant Dam would have exceeded 37,100 cfs and would have resulted in extensive damage between Friant Dam and the mouth of the Merced River. A peak flow of 62,500 cfs was a record on the Stanislaus River at Ripon, while the Middle Fork of the Tuolumne River at Oakland Recreation Camp reached a record flow of 4,920 cfs. During the 1955 floods, two of the three forks of the Tuolumne River also reached record flows.
Chapter 2
Flood Damage Reduction Technical Appendix Existing Conditions
Flood of 1967
Above-normal precipitation that occurred continuously from December 1966 through March 1967 resulted in the flooding of 35,000 acres of the San Joaquin River basin. A record-breaking storm in early December 1966 resulted in very high runoff from the San Joaquin River. The San Joaquin River above Millerton Lake experienced high runoff during early December with a maximum mean daily inflow of 18,450 cfs to Millerton Lake. A vast snowmelt from April to July resulted in significant flood damages from flooding in the lower portions of the Fresno and Chowchilla rivers. Nearly all of the flooded areas were cropland, improved pasture, or grazing land.
Flood of 1983
Water year 1983 was one of the wettest on record in California, a result of the “El Nino” weather phenomenon. Northern and Central California experienced moderate flooding incidents from November through March due to numerous storms. In early May, snow water content in the Sierra Nevada exceeded 230 percent of normal, and the ensuing runoff resulted in approximately four times the average volume for Central Valley streams. In the San Joaquin River basin, levee breaks caused flooding at four locations along the San Joaquin River. Four levees failed in the Delta, resulting in partial or total flooding of some islands. Estimated damages exceeded $324 million in the San Joaquin River basin.
Flood of 1986
Flooding in 1986 resulted from a series of four storms over a 9-day period during February. Rains from the first three storms saturated the ground and produced moderate to heavy runoff before the arrival of the fourth storm. In the San Joaquin River basin and the Delta, levee breaks along the Mokelumne River caused flooding in the community of Thornton and the inundation of four Delta islands. Estimated damages exceeded $15 million in the San Joaquin River basin. Flood of 1995
"El Nino" conditions in the Pacific forced major storm systems directly into California during much of the winter and early spring of 1995. The largest storm systems hit California in early January and early March. The major brunt of the January storms hit the Sacramento River basin and resulted in small stream flooding primarily due to storm drainage system failures. The March 1995 storms were concentrated on the coastal range, and caused high flows in some of the west side tributaries to the San Joaquin River basin. In particular, Arroyo Pasajero produced
extremely high flows that collapsed bridges on Interstate 5 near Coalinga, killing 6 people. In total, estimated flooding damages in 1995 exceeded $193 million in the San Joaquin River basin.
Chapter 2
Existing Conditions Flood Damage Reduction Technical Appendix
Flood of 1997
December 1996 was one of the wettest Decembers on record in the Central Valley. Watersheds in the Sierra Nevada already were saturated by the time three subtropical storms added more than 30 inches of rain in late December 1996 and early January 1997. The third and most severe of these storms lasted from December 31, 1996, through January 2, 1997. Rain in the Sierra Nevada caused record flows that overwhelmed the flood management system in the San Joaquin River basin. Peak flows to the San Joaquin River at Friant Dam were estimated at 59,000 cfs. Dozens of levees failed throughout the river system and widespread flooding ensued. The Delta also experienced several levee breaks and levee overtopping. Estimated damages exceeded $223 million in the San Joaquin River basin.
CHAPTER 3. ANALYTICAL METHODOLOGY
The evaluations described in this TA were completed using analytical tools and data developed by the Corps and The Reclamation Board of the State of California for the 2002 Sacramento and San Joaquin River basins Comprehensive Study (Comprehensive Study). This chapter briefly describes the hydrologic, hydraulic, and economic models developed for the Comprehensive Study. More detailed descriptions are available in Comprehensive Study documentation.
Analytical tools developed for the Comprehensive Study were designed to support evaluations of flood management actions for the entire San Joaquin River basin. Hydrologic data include
inflows to all major reservoirs operated for flood management, from Pine Flat Reservoir on the Kings River to New Hogan Reservoir on the Calaveras River. The hydraulic model represents all floodways, including river channels (leveed and non-leveed reaches) and bypasses. The
economics model represents damageable property in all areas subject to flooding from major flood management and conveyance systems in the entire San Joaquin River basin.
HYDROLOGY AND RESERVOIR OPERATIONS
This sections provides a brief description of the development of the hydrology and reservoir operations analytical tools for the Comprehensive Study.
Synthetic Hydrology
As described in Chapter 2, storm events that cause flooding in the Central Valley can vary widely in location, intensity, and duration. In recognition of this fact, a synthetic set of
hydrologic data was developed for the entire San Joaquin River basin using historical events to support system-wide evaluations of flood risk. The synthetic hydrology developed for the Comprehensive Study was developed using flood flow information from several major storm events in each watershed during the past century. The primary objective of the synthetic hydrology is to establish a means to estimate simultaneous levels of flood risk at different locations in the river basin. Further refinement would be required if the synthetic hydrology, including storm centerings, local-flow contributions, and ungaged stream contributions, is to be applied to anything other than prefeasibility applications. The development of the synthetic hydrology is illustrated in Figure 3-1.
Development of the synthetic hydrology began with a review of significant storm events during the past century for which flow and volume data were available at multiple locations throughout the San Joaquin Valley. The effects of regulation on each event were removed to identify the natural total volumes at key locations in the river basin. Based on this information, total runoff estimates were made at each location for seven recurrence periods: 2-year, 10-year, 25-year, 50-year, 100-50-year, 200-50-year, and 500-year. The next step involved identifying the relative intensity of simultaneous flows for storms centered at different locations. Spatial distribution analysis identified the corresponding recurrence period at all locations in the river basin for specified recurrence period storms centered at one location.
Chapter 3
Analytical Methodology Flood Damage Reduction Technical Appendix
Historical Storm Analysis Natural Flow Analysis
Total Volumes Spatial Distribution Synthetic Hydrographs 0 50000 100000 150000 200000 250000 300000 12 /2 6/ 96 12 /2 8/ 96 12 /3 0/ 96 1/ 1/ 97 1/ 3/ 97 1/ 5/ 97 1/ 7/ 97 1/ 9/ 97 Folsom Oroville Shasta NBB Input to Reservoir Simulations Model
Unregulated hydrographs were constructed from historic data and storm patterns in California
Source: Sacramento and San Joaquin River Basins Comprehensive Study, Technical Studies Documentation, December 2002
FIGURE 3-1.
DEVELOPMENT OF SYNTHETIC RAINFLOOD HYDROGRAPHS
Specific assumptions and limitations related to the synthetic hydrology include the following:
• The data are stationary.
• The natural flow frequency curves are strictly rainflood frequency curves. Snowmelt runoff was not directly incorporated into the analysis.
• Centering hydrographs were predicated on flood runoff, not precipitation. Development of the hydrology used only historic flow data; no precipitation data were used.
• Storm runoff centerings were formulated based on the Composite Floodplain concept, described below.
• Unregulated frequency curves computed for the Comprehensive Study were developed following procedures outlined in Bulletin 17B (USGS, 1981).
• Travel times and attenuation factors (Muskingum Coefficients) were fixed for all simulated exceedence frequencies.
• Mainstem unregulated flow frequency curves were designed to quantify the total flows that the basins produced in rainfloods, not the average natural flows expected at mainstem locations during any of the synthetic exceedence frequency storm events.
Chapter 3
Flood Damage Reduction Technical Appendix Analytical Methodology
Composite Floodplain
The “Composite Floodplain” concept is based on recognition that the total floodplain at any given location in a river basin may not be created by a single flood event, but by a combination of several events. Each of the seven synthetic recurrence period events plays a major role in shaping the floodplain at different locations. As one moves downstream in a river basin, the Composite Floodplain becomes increasingly complex. With the confluence of each additional tributary, the number of possible scenarios of flow combinations that could shape the floodplain grows. The role of tributaries in shaping floodplains individually and as a system is the
foundation of the Composite Floodplain concept. Synthetic hydrology for the Comprehensive Study was developed to ensure that the complex characteristics of floodplains in the San Joaquin River basin are reflected and that the Composite Floodplain represents the maximum extent of inundation possible at all locations for any of the simulated seven synthetic recurrence period storm events.
Further description of the development of synthetic hydrology and Composite Floodplains for the Comprehensive Study can be found in Appendix B of the Comprehensive Study Technical Studies Documentation (Corps, 2002).
HEC-5 Models
The synthetic hydrology described above provided unimpaired inflows to all reservoirs in the San Joaquin River basin. Because numerous reservoirs exist in the basin, it is necessary to impose reservoir operations on flows from the synthetic hydrology to provide complete
simulation of the existing hydrologic regime. The HEC-5 program, from the Corps Hydrologic Engineering Center (HEC), was used as the reservoir operations model for the Comprehensive Study because it is the Corps standard tool in reservoir analyses.
The HEC-5 program is used to simulate the sequential operation of a system of reservoirs for short-interval historical or synthetic floods, for long duration non-flood periods, or a combination of the two. A HEC-5 model is constructed using reservoir operational criteria input by the user. The program is designed to accept criteria related to flood operations, hydropower generation, river routings, diversions, and low-flow operations.
HEC-5 models developed for Comprehensive Study analyses were created with the following assumptions and limitations:
• Models were created for use only with the synthetic 30-day hourly hydrographs developed specifically for the Comprehensive Study.
• Reservoir simulations used starting storage values of the headwater reservoirs as an average of their storage during the 1997, 1995, and 1986 storm events. If average storage was greater than gross pool, then gross pool was used as the starting storage. Starting storage in lower basin flood control reservoirs is the top of conservation.
• Guidelines established within each reservoir water control manual were strictly observed.
• Some reservoirs with stepped release schedules rely on both the percentage of required flood control space used and peak inflow in determining flood releases. For these reservoirs, fixed percentages of required flood control space used were assumed.
• Muskingum routing parameters for stream channels downstream from the reservoirs were fixed for all simulated exceedence frequencies.
Chapter 3
Analytical Methodology Flood Damage Reduction Technical Appendix
• Local flows were produced through procedures described above or assumed to be a ratio of the short duration peak of a nearby natural flow hydrograph.
• Calibration and verification were accomplished using the 1995 and 1997 flood events and by comparing these to manual routings published in water control manuals.
• Losses were not simulated. Evaporation, groundwater infiltration or seepage, and levee breaks were not simulated. The models assumed that channel capacity does not affect flows. The HEC-5 models were used for initial flood routing only, for the purpose of establishing storm-centering assumptions. Hydraulic routing, using a UNET model (described in a subsequent section), accounts for channel effects and levee-break losses.
• The simulation program assumed near certainty in flow contributions from downstream tributaries when operating facilities for flows at that location or downstream of that location. Flood Control Operation
Reclamation operates the Friant Division for flood control in accordance with the Report on Reservoir Regulation for Flood Control, Friant Dam and Millerton Lake San Joaquin River, California (Corps, 1980) (Flood Control Manual). During the flood season of October through March, up to 170 TAF of space must be maintained in Millerton Lake for rain floods control; however, up to 85 TAF of this requirement can provided by an equal amount of space in Mammoth Pool.
Friant Dam and Millerton Lake are operated for flood control in accordance with rules and regulations prescribed by the Code of Federal Regulations Title 33 Part 208.11, the Field Working Agreement for CVP dams and reservoirs, and the Flood Control Manual. The Flood Control Manual states the flood control objectives for Friant Dam and Millerton Lake:
1. Control the sum of flows from Friant Dam without exceeding 8,000 cfs below Cottonwood Creek and Little Dry Creek, or 6,500 cfs at the USGS gaging station “San Joaquin River near Mendota.”
2. Permit use of the maximum practical amount of storage space for conservation and other purposes without impairment of the flood control functions.
According to the Flood Control Manual, flood control operation is determined daily as described on the Flood Control Diagram (Chart A-11 of Flood Control Manual), which provides the required flood control space in Millerton Lake and the schedule for releasing water from the flood control space. Two types of flood control space and their characteristics are summarized as follows:
1. Rainflood space: this space increases from zero on October 1 to 170 TAF on November 1 and decreases from 170 TAF on February 1 to zero on April 1. Water stored in rain flood space is released as rapidly as possible without violating the flood control objective release. Rainflood space in excess of 85 TAF may be replaced by an equal amount of space in Mammoth Pool from November 1 to February 1.
Chapter 3
Flood Damage Reduction Technical Appendix Analytical Methodology
2. Conditional space: this space is required from February 1 to June 30 for snowmelt runoff control. This variable space is predicted on filling the reservoir (if possible) by the end of the snowmelt season without exceeding downstream objective flows. The required conditional space and supplemental releases on a given date are determined from the Flood Control Diagram. This diagram uses the following data: forecasted unimpaired runoff into Millerton Lake, amount of upstream storage available, and forecasted irrigation demand from that date to June 15 (after May 31, use the forecasted irrigation demand for the next 15 days or until August, whichever is less).
HYDRAULICS
The Comprehensive Study used a computer hydraulic model, UNET, to represent the hydraulics of rivers and streams in the San Joaquin River basin. The steps taken to develop this model are explained briefly below. In addition, information about the strengths, applicability, and
limitations of this analytical tool are presented. San Joaquin River Basin UNET Model
Computer-based hydraulic models such as UNET apply theoretical and empirical hydraulic equations to estimate flows and water surface levels throughout the flood conveyance system that result from the synthetic hydrology described above and levee break assumptions throughout the system. UNET was used to determine river stage, velocity, depth, and levee breaks and flows into and out from overbank areas.
UNET is an unsteady, dynamic flow computer model that is used to simulate the routing of flood hydrographs through the San Joaquin River basin. Inflow hydrographs are used as upstream and internal boundary conditions for the model. Flood routing in UNET uses the finite difference form of the unsteady flow equations to compute the progression of flood waves through the system. It takes into account overbank storage, levee breaches, diversions to other basins, and other internal boundary conditions when computing flood routing. The UNET model uses the Data Storage System (DSS) developed by the Corps HEC for input and output of time-series data.
UNET is designed to simulate unsteady flow through a full network of open channels, weirs, bypasses, and storage areas. For the Comprehensive Study application to the San Joaquin River basin, use of the UNET model was limited primarily to the main riverine channels. An April 2000 modification of UNET Version 4.0 was used for this study. For more information about the capabilities of this model, refer to the UNET User’s Manual (Corps, 1997).
Chapter 3
Analytical Methodology Flood Damage Reduction Technical Appendix
Assumptions and Limitations of the UNET Model
The UNET model developed for the Comprehensive Study analysis was created with the following assumptions and limitations:
• Level of detail was limited by the availability of geometric and topographic data. Maximum spacing of cross sections in the UNET model (between 1/5-mile and 1/4-mile) limits the applicability of the model to evaluations of generalized detail.
• The modeling effort was constrained by limited or incomplete historical hydrologic data and the accuracy and applicability of the computer model being used.
• The model simulates one-dimensional, fully unsteady flow, and has sufficient detail to provide appropriate results for a systematic flood damage analysis of the basin.
• UNET is a fixed bed analysis that does not account for sediment movement, scour, or deposition. The model assumes no exchange with groundwater.
• The model is a comprehensive representation of the entire San Joaquin River basin, capable of simulating the complex interaction of multiple stream systems and waterways.
• Floods with return frequencies of 10, 25, 50, 100, 200, and 500 years were explicitly modeled using synthetic hydrology output from the HEC-5 models described above.
• Levee failure methodology can significantly influence simulated flood flows because it provides a conservative simulation of potential flooding extent for system-wide flood risk evaluations. It does not represent conditions that would occur during an actual flood event.
UNET Model Development
In general, model development consisted of collecting and processing topographic data,
developing river channel alignments, developing cross-sectional geometry from the topographic and hydrographic data, and constructing a functional UNET model. Extensive topographic data were collected for the San Joaquin River basin as part of the Comprehensive Study. Digital river channel alignments depicting the centerline of the low-flow channel were developed based on topographic and hydrographic information. Cross sections were extracted from topographic data along the channel alignments. The model was then completed by adding bridges, boundary conditions, and model connectivity elements. Input and output from UNET were stored and post-processed in DSS, a database developed by HEC for time-series data.
The UNET model requires four primary types of boundary conditions. Interior boundary conditions define reach connections and ensure continuity of flow. Upstream boundary
conditions, or flow hydrographs of discharge versus time for particular flood events, are required for all reaches that are not connected to another reach at their upstream end. Regulated outflow hydrographs at controlling reservoirs were provided from HEC-5 simulations described above. Downstream boundary conditions, such as stage hydrographs from tide gages in the Delta, are required at the downstream end of all river systems not connected to another reach or river. Internal boundary conditions represent levee failures or storage interactions, spillways or weir overflow/diversion structures, bridge or culvert hydraulics, or pumped diversions.
Chapter 3
Flood Damage Reduction Technical Appendix Analytical Methodology
Levee Failure Methodology
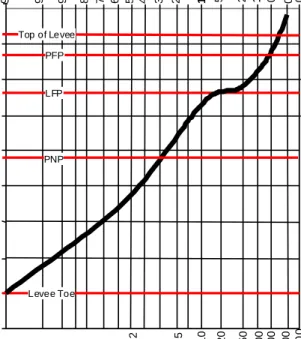
A levee failure methodology was devised to determine when simulated flows would cause levees to fail and water would be discharged from the flood conveyance system to the floodplain. As part of the Comprehensive Study, a likely failure point (LFP) for each section of levee was developed from available geotechnical data, extensive interviews with levee district personnel, and best engineering judgment. A levee failure is simulated in UNET when the calculated water surface elevation at a cross section reaches the specified LFP. Levee failure is simulated by UNET as a levee breach that sends water into the overbank storage areas.
Figure 3-2 illustrates the form of a typical stage-frequency curve. Several storm centerings are simulated for each recurrence period event, and the highest estimated river stage at each location is selected for input to the economic analysis. As shown in Figure 3-2, river stages tend to increase as the recurrence period of a flood event increases (larger events) until the LFP of a levee is reached. At this stage, the UNET model simulates a levee break and the model simulates the release of water to the floodplain. The river stage then remains at or near this level until the higher flows associated with larger events provide more water than can leave the river at that location and stages increase once again.
Exceedence Frequency per 100 Years
2 5 10 20 50 200 100 0 60 64 68 72 76 80 84 88 92 96
Exceedence Interval in Years
S tag e i n F e e t LFP Top of Levee Levee Toe 0. 5 0. 2 0. 1 2 5 10 90 95 99 80 70 60 50 40 30 20 1 100 500 PFP PNP FIGURE 3-2.
Chapter 3
Analytical Methodology Flood Damage Reduction Technical Appendix
Stage-frequency curves were developed using UNET output at 42 index points that corresponded to 42 impact areas in the San Joaquin River basin for which economic damages were estimated, as shown in Figure 3-3. Because the majority of the reaches in the San Joaquin model include levees, two sets of simulations were required to construct these curves: one that assumed levee failures occur and one that assumed all flow is contained within the channel (termed infinite channel). The portion of the curve below the LFP was developed using the with-failure
simulations. After failure, the water surface elevation or flow remained relatively constant for all higher flood frequencies because flows were escaping into the floodplain through the levee break. To develop a complete curve that acknowledged the possibility that breakout might not occur, the upper portion of the curve was formed using the infinite channel simulation. The portion of the infinite channel frequency curve above the frequency of levee failure was translated down to meet the baseline (with-failure) curve where it intersected the LFP and flattened. The resulting hybrid curve was used to evaluate model output in reaches with levees.
FIGURE 3-3.
Chapter 3
Flood Damage Reduction Technical Appendix Analytical Methodology
ECONOMICS
A basin-wide flood damage economics analysis tool was developed as part of the
Comprehensive Study that incorporated a risk-based analysis. The primary tool for the economic studies was the Corps Flood Damage Analysis Model, or HEC-FDA. This model uses a risk-based analysis to express economic performance in terms of expected annual damages (EAD). A complete description of the economic studies performed during the Comprehensive Study is included in the Comprehensive Study Technical Studies Documentation, Appendix F – Economics Technical Documentation (Corps, 2002).
The Comprehensive Study economic analysis was based on the P&G (WRC, 1983). A primary objective of the analysis was to determine the EAD along each river reach, taking into account all possible flood scenarios, and comparing changes in the damage resulting from various alternative plans.
The determination of EAD in a flood management study must take into account interrelated hydrologic, hydraulic, geotechnical, and economic information and associated uncertainties. Specifically, EAD is determined by combining the discharge-frequency, stage-discharge (or frequency), and stage-damage functions and integrating the resulting damage-frequency
function. Uncertainties are present for each of these functions and are carried forth into the EAD computation.
For the Comprehensive Study, most of the rivers studied have levees on one or both sides for part or all of their studied length. Levees prevent water from breaking out into adjacent floodplain areas. As river stage increases, the probability of levee failure also increases. HEC-FDA Model
The primary model for performing flood damage reduction analysis for the Comprehensive Study is HEC-FDA, which integrates hydrologic, hydraulic, and geotechnical engineering and economic data. HEC-FDA incorporates uncertainty for risk analysis using a Monte Carlo simulation procedure.
Development of Economic Data
Because the large floodplains in the Comprehensive Study were not homogenous but instead contained areas subject to different types of flooding, impact areas were delineated within the floodplains to facilitate the flood damage analysis. These impact areas were identified based primarily on flooding characteristics (sources and flow patterns), underlying land uses, and the location of potential measures. The outermost extent of the impact areas was based on
delineation of the 1-in-500 year floodplains. In the San Joaquin River basin (about 654,000 acres), 42 impact areas were identified (Figure 3-3).
Damage analysis focuses on different land uses. Damage categories used in the Comprehensive Study economic analysis include the following:
Chapter 3
Analytical Methodology Flood Damage Reduction Technical Appendix
• Residential - single and multifamily structures
• Mobile homes - mobile or manufactured housing units
• Commercial - offices, retail facilities, hotels, and motels
• Industrial - manufacturing plants, oil refineries, meat packing plants, and canneries, etc.
• Public/semipublic - institutions, municipal buildings, theaters, churches, schools, etc.
• Farmsteads - residential structures with barns and sheds found on farms
• Crops - field crops, fruit and nut crops, alfalfa, mixed pasture, rice, truck crops, and vine crops
• Other - damage to autos and roads, traffic disruption, and emergency response costs
A geographic information system (GIS) was used to develop crop and other land use inventories using DWR’s digitized land use files. GIS was used to develop floodplain structural inventories with digitized county parcel map files for the San Joaquin River basin.
Once parcels (and their associated assessor parcel numbers) were identified, they were linked to the assessor data files to obtain structural improvement values and other information. Values were updated to October 2001 prices. Contents values were assigned based on percentages developed by past Corps studies. These percentages are residential and mobile homes, 50 percent; commercial, 100 percent; industrial, 150 percent; public/semipublic, 50 percent; and farmsteads, 65 percent. These percentages were applied to structural values; thus a $100,000 house would have contents assumed to be valued at $50,000.
Urban damage generally increases as depth of flooding increases. Depth-damage functions developed by the Corps Institute for Water Resources for residential structures, and by the Sacramento District for other categories, were used in the Comprehensive Study to determine structural damage based on flooding depth in a given impact area.
Because of the extensive agricultural acreage currently within the floodplains, crop flood damage analysis was an important element in the Comprehensive Study. While it is recognized that over 100 different crops are grown within the Comprehensive Study area, for analytical purposes only, the following predominant crops were evaluated: field crops (corn, beans, wheat, cotton, safflower), fruit crops (almonds, walnuts, peaches, pears, prunes), alfalfa, mixed pasture, rice, truck crops (melons, tomatoes), and vine crops. Less predominant crops also were included by using a surrogate crop type from the above list. In addition to flood depths, the effects of seasonality and flooding duration are considered in the computation of agricultural flood damages for each crop. These two factors are often more important than flood depths.
Considerations and Assumptions
Results of the risk analysis were affected by technical considerations and assumptions regarding input to HEC-FDA. For example, the geotechnical studies developed relationships that
characterized the reliability of the levees; the relationships were used to trigger levee failures in the hydraulic models, which ultimately affected the stage-frequency curves used in the risk analysis.
Chapter 3
Flood Damage Reduction Technical Appendix Analytical Methodology
Perhaps the most significant assumption was the failure methodology, which can significantly influence simulated flood flows. The failure methodology was chosen to provide a conservative and consistent simulation of potential flooding extent for system-wide hydraulic and economic evaluations. It does not represent conditions that would occur during an actual flood event, when flood-fighting and other emergency actions would likely take place, and fewer failures would likely result. In some cases, the cumulative affect of multiple upstream failures can reduce the volume of flow in downstream reaches, or large breaches can produce pronounced reductions in stage. These effects are less pronounced in the San Joaquin River basin where flood volumes are relatively smaller, levees tend to be shorter, and overbank flooding occurs more frequently than in the Sacramento River basin. While this levee failure methodology was sufficient for basin-wide risk analyses, it should be considered when interpreting model results.
Determination of Expected Annual Damages
The determination of EAD for a flood reduction study must take into account complex and uncertain hydrologic, hydraulic, geotechnical, and economic information such as the following:
• Hydrologic - Discharge-frequency function describes the probability of floods equal to or greater than some discharge Q
• Hydraulics - Stage-discharge function describes how high (stage) the flow of water in a river channel might be for given volumes of flow discharge
• Geotechnical - Geotechnical levee failure function describes the levee failure probabilities vs. stages in channel with resultant stages in the floodplain
• Economics - Stage-damage function describes the amount of damage that might occur given certain floodplain stages
Figure 3-4 illustrates the conceptual risk approach for Corps flood damage analyses. Steps to find the damage for any given flood frequency are as follows:
1. The discharge for that frequency is first located in the discharge-frequency panel (Panel No. 1).
2. The river channel stage associated with that discharge value is then determined in the stage-discharge panel (Panel No. 2).
3. Most of the rivers being studied have either project or non-project levees that may fail before water reaches the top (Panel No. 3).
4. Once levees have failed and water enters the floodplain, then stages (water depths) in the floodplain inundate structures and crops and cause damage (Panel No. 4, left side).
5. By plotting this damage and repeating for process many times, the damage-frequency curve is determined (panel No. 4, right side). EAD is then computed by finding the area under the flood damage-frequency curve by integration for both with- and without-project conditions. Reductions in EAD attributable to projects are flood reduction benefits.
The Comprehensive Study Technical Studies Documentation, Appendix E – Risk Analysis, and Appendix F – Economics Technical Documentation (Corps, 2002), provides a more detailed description of the Corps risk and economics analysis for the Comprehensive Study.
Chapter 3
Analytical Methodology Flood Damage Reduction Technical Appendix
Source: Adapted from Moser (1997)
Di s c h a rg e ( Q ) Stage (H, channel) Stage (H, floodplain) Di s c h a rg e ( Q ) Exceedence Probability (p) Exceedence Probability (p) Da m a g e (D) Da m a g e (D) 2. Hydraulics 4. Economics 1. Hydrology Typical Levee Probability of Failure, (%) S ta g e , H , ch an n e l 3. Geotechnical EAD = D(p)dp
∫
FIGURE 3-4.CHAPTER 4. PRELIMINARY EVALUATIONS
Three scenarios were evaluated at a prefeasibility level of detail to identify the effects that additional flood storage at Friant Dam could have on flood damages in the San Joaquin River basin. These scenarios include the future without-project conditions scenario, which is based on the continued operation of existing flood management facilities according to current rules; an enlarged flood storage space scenario; and an enlarged flood storage space and reduced objective release scenario. Each scenario is described in the following sections.
SCENARIO 1 - FUTURE WITHOUT-PROJECT CONDITIONS
Future without-project conditions for flood damages are based on conditions in place today with the addition of currently planned projects. For the San Joaquin River basin, the future without-project conditions are essentially the same as the conditions used for the Comprehensive Study. These include the existing flood management rules for all reservoirs in the San Joaquin Valley, existing flood conveyance facilities, levee stability based on geotechnical judgements made during the Comprehensive Study, and damageable property in the floodplain based on the inventory developed for the Comprehensive Study.
Hydrology
Comprehensive Study hydrology, described in Chapter 3, was used without change for the future without-project evaluation. Comprehensive Study hydrology includes the synthetic hydrology, composite floodplains, and HEC-5 reservoir operations models. Hydrologic and reservoir operations models were run for five storm centerings (Friant, El Nido, Merced, Newman, and Vernalis) to represent the distribution of storms that would result in peak flood flows and stages along the mainstem of the San Joaquin River and major bypasses. Of the five storm centerings considered, the Friant centering results in the highest inflow to Millerton Lake for each recurrence period.
Figure 4-1 shows peak inflow and outflow for Millerton Lake for the Friant storm centering for each recurrence period based on the management of a 170 TAF flood pool. As shown, the future without-project condition would control the 10-year recurrence period event at an objective release of 8,000 cfs from Friant Dam, but would require slightly higher releases for the 25-year recurrence event. Objective flows would be significantly exceeded for the 50-year recurrence period event, with peak discharge exceeding 25,000 cfs. Larger events would result in higher peak discharges from Friant, with 100-year recurrence period peak discharge from Friant Dam estimated at 71,000 cfs.