TRADE, TARIFFS AND
TOTAL FACTOR PRODUCTIVITY:
THE CASE OF SPANISH FIRMS
∗Marion Dovis and Juliette Milgram-Baleix
∗∗WP-EC 2008-06
Correspondence to: J. Milgram-Baleix: Universidad de Granada, Departamento de Teoría e Historia Económica, F.C.C.E.E., Campus Cartuja s/n, 18011 Granada, Spain. E-mail: jmilgram@ugr.es
Editor: Instituto Valenciano de Investigaciones Económicas, S.A. Primera Edición Mayo 2008
Depósito Legal: V-2461-2008
IVIE working papers offer in advance the results of economic research under way in order to encourage a discussion process before sending them to scientific journals for their final publication.
∗ The authors gratefully acknowledge the financial support from the Spanish Ministry of Education and
FEDER (CICYT Project SEJ2006–11067), Generalitat Valenciana (ACOMP07/102), Grupo de investigación GAMMA (SEJ 340), Femise project (FEM31-11).
∗∗
M. Dovis: Centre d'Economie et de Finances Internationales. Université de la Méditerranée. J. Milgram-Baleix: Universidad de Granada.
TRADE, TARIFFS AND TOTAL FACTOR PRODUCTIVITY: THE CASE OF SPANISH FIRMS
Marion Dovis and Juliette Milgram-Baleix ABSTRACT
The aim of this paper is to examine the sensitivity of total factor productivity (TFP) to foreign competition in the case of a European country. Using the Olley and Pakes (1996) method, we calculate the TFP of Spanish manufacturing firms and study the impact of EU tariffs, foreign competition and imports on TFP at the firm level. Applying the System-GMM method, we find that TFP is negatively impacted by European tariffs, whereas the competition, in the form of increased presence of foreign products in the domestic market and firms’ imports, leads to improvements of the TFP. Moreover, these two effects are complementary. We also find evidence of important asymmetries among firms depending on their involvement in foreign markets.
Keywords: Total factor productivity, Spain, trade, tariffs, heterogeneity of firms.
JEL Classification: F12
RESUMEN
El objetivo de este artículo es estudiar la sensibilidad de la productividad total de los factores (PTF) a la competencia extranjera en el caso de un país europeo. Calculamos la PTF de las empresas manufactureras españolas con el método de Olley y Pakes (1996) y estudiamos el impacto de los aranceles europeos, de la competencia extranjera y de las importaciones sobre la PTF de las empresas. Utilizando el método System-GMM, obtenemos que la PTF se ve negativamente afectada por los aranceles europeos, mientras la competencia, bajo la forma de una presencia mayor de productos extranjeros en el mercado doméstico o en términos de importaciones de las empresas, contribuye a mejorar la PTF. Además, estos dos efectos son complementarios. Encontramos también pruebas de importantes asimetrías entre las empresas, dependiendo de su grado de implicación en los mercados internacionales.
Palabras clave: productividad total de los factores, España, comercio, aranceles,
Introduction
Do we know everything about the link between openness and productivity at the micro-level? Krugman (1979) and Helpman and Krugman (1985) showed, in a context of homogeneous firms, that the exploitation of scale economies is a possible source of productivity gains (often designed as a pro-competitive effect). Melitz (2003), Yeaple (2005) and Bernard et al. (2003) explained the increase of productivity at the industry-level following a decrease in trade costs by the market-share effect, that is, the reallocation of resources among firms in favour of the most productive ones1. Learning-by-doing and externalities, technical innovation through imports of intermediate goods and managerial efforts are other possible sources of productivity improvements that have been evidenced by different theoretical models in the eighties (Grossman and Helpman (1991), Ethier (1982), Markusen (1989), Young (1991), Stokey (1991), Xie (1999)). In sum, theoretical models that consider the heterogeneity of firms do not contemplate the effect of the decrease in trade costs on intra-firm productivity; models that contemplate the effect of trade on intra-firm productivity do not consider the firms’ heterogeneity. As pointed by Tybout (2000), a mix of these three mechanisms will probably describe more realistically the relation between openness and intra-firm productivity. This empirical issue can now be investigated thanks to firm-level data.
In recent years, there has been a widespread effort to investigate the channel through which trade liberalisation takes place at the firm level in developing countries2. The studies of Pavcnik (2002), Schor (2004), Topalova (2004), Amiti and Konings (2005) and Fernandes (2007), respectively for Chile, Brazil, India, Indonesia and Columbia are good examples. As pointed out by Trefler (2004), there are fewer studies focussing on industrialised countries and on countries that engage in bilateral free trade, except his own study on the Canada-US Free Trade agreement. However, the diffusion of technology and knowledge through the acquisition of intermediate and / or capital goods can take place more easily among countries that are very close and have flexible markets as demonstrated by Eaton and Kortum (2002). This is another motivation to
1
Bernard, Jensen and Schott (2006) offer strong support for their main conclusions.
2
Focussing on a trade liberalisation period offers strong advantages. However, it may hide some response of the productive sector that may occur in a medium term since specialisation may be a long dynamic process (Cuñat and Maffezzoli, 2007).
focus on industrialised countries or transition economies. Finally, according to the debate on regionalism versus multilateralism, it is important to check the sensitivity of members of the trading blocks to the external tariffs. Indeed, if a large amount of trade takes place among the partners inside the FTA, the detrimental effect of external tariffs may not be so obvious since the intra-block market is large3.
In this paper, we focus on the effect of tariffs and foreign competition on TFP of Spanish manufacturing firms4. Our dataset covers the period 1991-2002. This period can be considered as a post-liberalisation period for the Spanish economy since the last significant part of trade liberalisation occurred during the 1980s and the dismantling of trade barriers in the framework of the adhesion to the European Economic Community (EEC) ended in 1992. Political reforms and the dismantling of restrictions on capital flows marked the 1980s along with a massive reallocation process among industries, labour markets. After the 1992 ERM crisis, Spain left the ERM. Following the devaluation of the Peseta, Spain experienced an exceptional growth of its openness ratio without facing big imbalances all over the period. Its trade with the EU and especially intra-industry trade increased sharply.
Like the most recent studies, we follow a two-step strategy. First, we use the Olley and Pakes (1996) method to obtain a measure of total factor productivity of firms. Our results confirm that during the nineties, the increasing openness of Spanish trade was contemporaneous with a large increase in productivity in the manufacturing industries, largely explained by intra-firm productivity growth. In a second step, we estimate an equation where TFP is explained by a set of characteristics of the firms and trade policy indicators. We use the system–GMM method proposed by Blundell and Bond (1998) to deal with the possible endogeneity of observable characteristics of the firms. We also control, in a consistent manner, unobservable characteristics that may explain current intra-firm productivity by taking into account the lagged value of productivity.
3
Frankel et al. (1996), Wei and Frankel (1996) and Panagariya and Krishna (2002) are some articles that illustrate this debate.
4
For Spain, as far as we know, the link between trade and productivity has not been studied at the firm level. Most studies have focused on the relationship between productivity and exports, where productivity is estimated using index method or stochastic frontier method or approximated by value added per worker (Barrios et al. (2003), Barrios and Strobl, (2004), Fariñas and Martin-Marcos (2007), Campa (2004), Merino and Salas (2002),. Salomon and Shaver (2005), Mañez et al. (2004), Huergo and Jaumandreu (2004). Delgado, Fariñas and Ruano (2002) and Fariñas and Ruano (2004 and 2005) study productivity distributions.
We use two different measures for openness for each industry: MFN tariffs of the EU and Spanish import penetration rate (IPR). Another important distinctive feature of our study is that these two measures are not substitutes due to the characteristics of the country under study. The first one is the result of EU negotiations with GATT members. It is a direct component of third country prices while EU countries are granted duty-free access in the EU market. Thus, IPR brings some additional information since it measures the degree of foreign competition in the Spanish market taking into account the growing import flows from third countries but also from the EU. We address at least three questions. First, do trade policy indicators affect productivity of Spanish firms directly? We find that TFP is negatively impacted by European tariffs and positively benefits from the presence of foreign products. Moreover, these two effects are complementary. Secondly, is there any evidence of TFP gains via imports of inputs? We find evidence of additional productivity gains for importing firms. Third, are there some asymmetries among firms in the sensitivity to these trade openness indicators? We find that the impact of exposure to trade and sensitivity to tariffs differ sharply among firms, depending on their size and involvement in foreign markets.
The paper is organised as follows. Section 1 presents some important stylised facts concerning Spanish trade liberalisation. Section 2 presents the data and the empirical methodology. Results are displayed and analysed in Section 3, and Section 4 provides some conclusions.
1.
Stylised facts
According to the agreement between Spain and the EEC, the dismantling of trade barriers among members started in 1986. For products for which the difference between Spanish tariff rates and the Common external rate (CET) was inferior to 15%, CET was applied straightforward. For the rest of the products, a progressive dismantling that ended in 1993 was applied. The Spanish average tariff for non-agricultural products was 12,33% for products from the EEC and 16,44% from third countries. The dismantling of tariff barriers was accompanied by a dismantling of quantitative restrictions, a new VAT tax and suppression of ICGI (tax of internal compensation that consisted in a lower tax on sales for locally produced products). The effective rate, that is, the amount of import tax revenue related to the value of imports was estimated at 5.44% in 1985. The suppression of ICGI also had an important dismantling effect
Quantitative restrictions with the EEC members were generally eliminated and Spain had to maintain the same barriers as the EEC for third countries. However, there was a large list of exceptions for “sensitive products”. Among others, Spain was allowed to maintain quantitative restrictions during three additional years for cars, metal, ships, TV, textiles, wearing (see Tamames, 1986).
Although, Spanish tariffs were completely adapted to EEC norms at the end of 1992, the dismantling was just the beginning of Spanish trade taking-off. Concerning the sectors that cover our data, the average of export to output ratio increased from 27% to 39% between 1991 and 2002 and the average import to output ratio from 18% to 32%. Amazingly, the trade deficit has remained stable over the period (5.8% PIB) which can be considered as a successful integration experience. These data confirm that the Spanish case over the period 1991-2002 is a very interesting case to study.
Import competition and exports increased sharply in the markets of electrical products, leather and leather products, vehicles, plastic and rubber products and other transport equipments. The basic metal sector has also experienced an intensification of trade but mainly due to imports, and the food and tobacco sector mainly due to exports. The chemical sector, wood, paper, textile and textile products and other manufactured products have increased their exports and their imports but not strongly. For the others, trade has been stable.
For the period under study 1991-2002, Spanish tariffs were already adapted to the Common External tariff rate. We use MFN tariff. Due to the application of the different cycles of the GATT (Tokyo Round, Uruguay Round) the EU tariff rate slightly diminished all over the period. They are higher in food products (42%) and range from 4% to 10% in the remaining industries. Tariffs for 1991 and 2002 by industry are displayed in Table 3 in appendix 1.
2.
Empirical strategy
We follow a two-step strategy that became relatively standard in the literature (see Pavcnik (2002), Schor (2004), Topalova (2004), Amiti and Konings (2005) and Fernandes (2007)). In a first step, we use the Olley and Pakes (1996) method to measure total factor productivity of firms. In a second step, we estimate an equation, where TFP is explained by: a set of characteristics of the firms, the lagged productivity and trade policy indicators using the System–GMM method.
We use data on Spanish manufacturing firms coming from the Encuesta sobre Estrategias Empresariales (ESEE), an annual survey carried out by the SEPI Ministry of Industry. The ESEE is representative for the Spanish manufacturing firms classified by industrial sector and size categories5 and includes exhaustive information at the firm level. The ESEE offers detailed data on balance sheets, sales, inventories and materials, volume of exports and imports among others. For each firm, we know the region it is located in and the sector of the NACE-93 classification. We cleaned the data in order to correct or eliminate problems due to non-reporting or misreporting. We dropped observations for 1990 that were too incomplete and observations with non-reporting value for fixed assets. The total number of firms in the database is 3462. At the end of our cleaning process, the sample consisted of 3107 firms6 and 20882 observations for the period 1991-2002. Details about the cleaning process are provided in the Annex.
In this section, we explain the method used to measure TFP at the firm-level and comment the result of the decompositions of TFP growth by industry which sheds some light on the characteristics of the case under study. Then, we present the empirical model we estimated and the estimation method.
2.1. Productivity measurement
The link between trade and productivity at the firm level has been studied using a wide range of methodologies concerning the measures of productivity. A first generation of studies used various measures of efficiency and obtained mixed results7. In most recent studies, firm-level total factor productivity (TFP) is calculated following the Olley and Pakes (1996) method. As far as we know, this method hasn’t been performed yet in the Spanish case. This method corrects the simultaneity bias arising from the fact that firms choose their level of input once they know their level of
5
The participation rate to the survey is about 70% for firms with more than 200 employees. Firms that employed between 10 to 200 (small firms) were randomly sampled by industry and size strata holding around a 5% of the population.
6
Some summary statistics are displayed in Table 1 in appendix 1.
7
Tybout and Westbrook (1991) find little evidence of intra-firm productivity improvements after the Chilean liberalisation. Harrison (1994) for the Ivory Coast finds that foreign competition forces down mark-ups among firms. Using the same methodology, Krishna and Mitra (1998) find more weak evidence for India. Using the above mentioned decomposition, Tybout and Westbrook (1995) find that increases in openness are associated with relatively small scale efficiency but significant “residual” gains in Mexico. Driffield and Kambhampati (2003) show that the increase of firms’ imports did not raise efficiency in the case of Indian firms.
productivity. It also corrects the selection bias arising from the fact that producers choose to stay or leave the market, depending on their productivity level, which in turn depends on their production factor. To this end, investment is considered as a proxy8 for the unobserved productivity shocks.
This method infers TFP at the firm level as the difference between the observed output and the predicted output function. Let us suppose that the technology of firm i is well described by a Cobb-Douglas production function:
it it it k it m it t it l m k y =β0 +β +β +β +ω +η (1)
where yit is the logarithm of the firm’s output, lit the logarithm of the labour input, mit the logarithm of the intermediary materials and kit is the logarithm of the capital. The error term has two components: the plant-specific productivity component given as ωit, and ηit, an error term that is uncorrelated with input choices. The investment function is given as:
(
it it)
t
it i k
i = ω , (2)
Assuming that investment function is monotonically increasing in ωit as in Pakes (1994), it can be inverted to obtain the productivity shock ωit as a function of iit
and kit:
(
it it)
t it =h i ,k
ω (3)
The higher the investment is, the higher the productivity will be. So, the production function can now be expressed as:
(
it it)
it t it m it l it l m i k y =β +β +φ , +η (4) where(
it it)
k it t(
it it)
t i ,k =β0 +β k +h i ,k φ (5) 8Since there are fewer observations with zero-investment values in our sample than in a sample of firms from developing countries, we are able to build a consistent measure of productivity. Moreover, production function estimations without investment values are close to the estimations with zero-investment values.
Following Olley and Pakes, we approximate the unknown function, φt, by a fourth order polynomial in kit and iit. In the first stage, βl, βm and φt are estimated and in the second stage we evaluate the survival probability of the firm, Pit. The third stage of the routine identifies the coefficient βk where productivity is assumed to evolve according to a first-order Markov process: ξit+1 =ωit+1 −E
[
ωit+1ωit,Xit+1 =1]
, with ξit+1 the innovation in ωit+1. This final stage uses the estimations of βl, βm, φt et Pitto obtain βk:
(
)
1 1 1 1 1 1 ˆ + ˆ + + ~ ˆ , ˆ + + + − l it − m it = k it + it t − k it + it + it it l m k g P k y β β β φ β ξ η (6)Finally, we use the efficient coefficients’ estimates to build a measure of firm productivity as done by Olley and Pakes (1996) and Pavcnik (2002). This index is calculated by subtracting the productivity of a reference plant from the productivity of a particular firm, measured as the difference between its predicted output and its actual output at time t9. The productivity of the reference firm is constructed with the mean output and the mean input level in the based year. We obtain:
(
r r)
it k it m it l it it y l m k y y TFP = −βˆ −βˆ −βˆ − −ˆ (7)where yr is the average of the log output of firms in 1991 (yr = yit) and yˆr is the
predicted average log output in 1991 (yˆr =βˆllit +βˆmmit +βˆkkit). This index represents the deviation of a firm from the average industry practice in a base year. Coefficients are reported in Table 2 for 17 industries (in appendix 1). Coefficients are significant at the 1-% level in most cases and range in similar intervals as other studies.
We also aggregate the firm level productivity to obtain productivity level and growth, at the industry level. As in Foster, Haltiwanger and Krizan (1998), we decompose productivity growth to evaluate the contribution of intra-firm productivity, reallocation among firms, entry and exit of firms, to total growth of firms’ TFP. Total factor productivity of firms is measured as:
k m l y TFPit = −βˆl −βˆm −βˆk (9) 9
This decomposition identifies five components of the aggregate productivity (Table 4 in appendix 1):
(
)
(
τ)
τ(
τ τ)
τ τ τ − − ∈ − − ∈ ∈ ∈ − − ∈ − − + − + Δ Δ + Δ − + Δ = Δ∑
∑
∑
∑
∑
jt ijt X i ijt jt ijt N i ijt ijt C i ijt ijt C i jt ijt ijt C i ijt jt TFP TFP s TFP TFP s s TFP s TFP TFP TFP s TFP (10)where C represents continuer firms, N entering firms and X exiting firms. TFPjt is the
weighted average TFP of the industry j in log with ΔTFPjt =TFPjt −TFPjt−τ.The first component represents the "within effect" calculated as the sum of firm-level productivity changes, weighted by its initial market share. The second component represents the "between effect" (or the reallocation effect). It measures changes in market shares weighted by the deviations of initial firm productivity from the initial overall industry average. The third component is the "covariance effect" of the firms’ productivity variations and market shares changes. The last two terms in equation 10 are the entry and the exit effects that represent the contribution of entering and exiting firms to the sector level TFP growth.
The aggregate productivity increased from 1991 to 2002 in all industries, except Food and Tobacco. The increases are, in most cases superior to 15% what represents a moderate increase of 1.3% per year. Industries that have the highest increase in productivity (3.3% per year) are the industries of rubber and plastic products and electrical and optical equipments. In this period, we do not find that reallocation among firms had contributed positively to the growth of productivity. Only in some industries like wood and chemicals, this reallocation explains a great part of the productivity growth.
The growth of intra-firm productivity weighted by initial market share (“within effect”) is always positive except for the industry of Leather products. This effect explains most part of TFP growth in textile, wood, paper, printing products, other non metallical mineral products, basic metals, machinery and equipment and other manufactured products. The higher the initial market shares of the firms that increase their productivity are, the higher this effect will be. The “between effect” is mostly negative (12 sectors of 17) and has a poor contribution on aggregate productivity growth. The “covariance effect” for all the sectors except wood, paper, printing products and other manufactured goods, is positive. In chemical products, machinery and equipment, vehicles and other transport equipment, this effect seems to play an important role in the aggregate productivity growth. The effect of exit is very weak and mostly positive but in four industries, this effect is reflecting negatively the fact, that
firms that exit our sample are not necessarily less productive than the average. On the opposite, the entrance of firms is positive and has a big impact on aggregate productivity growth of leather and leather products, wood, paper, rubber and plastics products and electrical and optical equipments. Since we consider as entrant firms, all firms that enter after 1991 and still exist in 2002, this effect partly reflects the productivity growth of these firms after their entrance. This result is in line with the theoretical predictions according to which an increase in competition, forces entering firms to have a higher level of productivity.
2.2. Estimation strategy
The next step consists of estimating the effect of trade policy measures on TFP. Unlike most studies, except Fernandes (2007), we control for lagged productivity since we believe that TFP determinants are highly persistent. In contrast to Fernandes (2007) who run OLS and fixed effects estimations of this equation accounting for plant fixed effect, we use dynamic panel data techniques. Indeed, our data set allows us to take into account other crucial observable characteristics of the firms like import and export intensities, that may influence their reaction to trade. However, these characteristics are not strictly exogenous and fixed-effect estimations may lead to biased and inconsistent estimates. We prefer then the system– Generalized Method of Moments (GMM) method proposed by Blundell and Bond (1998) to deal with this issue10. They show that when the dependent variable follows a path close to a random walk, the differenced-GMM from Arellano and Bond (1991) has poor finite sample properties, and it is downwards biased, especially when T is small. Therefore, Blundell and Bond (1998) propose another estimator (the System-GMM) derived from the estimation of a system of two simultaneous equations, one in levels (with lagged levels as instruments) and the other in first differences (with lagged first differences as instruments). In multivariate dynamic panel models, the System-GMM estimator is shown to perform better than the differenced-GMM when series are persistent and there is a dramatic reduction in the finite sample bias due to the exploitation of additional moment conditions (Blundell and Bond (2000). This estimation method allows us to assume that the firms’ characteristics and the import penetration rate are endogenous variables. Their first (or second) difference are instrumented by the lags of their own first (or second) difference and all
10
Another possibility is proposed by Fernandes (2007) and referred as the direct approach. It consists of introducing trade policy indicators and all characteristics in the first equation of the production function. Thus, she finally finds that there is no strong difference between the direct and indirect approaches.
exogenous variables. Thus, to capture the impact of trade policy changes, we use the following framework: it i t T jt C it it it TFP X X TFP =α0+α1 −1+β′ +γ′ +η +η +ε (11)
where TFPit is a total factor productivity at the firm level as measured by equation 711,
XCitis a vector of firm’s characteristics , XTjt is a vector of trade variables, ηt are time
specific effects which take into account macroeconomic shocks common to all firms, ηi
an individual specific effect and εit is an error term.
We check the impact of trade intensification using two trade policy variables: tariff rates and import penetration rates. For tariffs, we use the tariffs for the Most Favoured Nation (MFN)12 of the EU since Spain already adapted its tariffs to the CET in 199113. We choose to use the simple average of these indicators at the industry level since a weighted average (using imports or value added as weights) tends to underestimate tariffs. However, it could be argued that tariffs are endogenously determined, but we think that using EU tariffs rates guarantees a sufficient disconnection between the choice of these tariffs and Spanish lobbies. Thus, we use the lagged value of tariffs. Tariffs are supposed to protect firms and should have a negative impact on TFP. We define the Import Penetration Rate at the industry level for year t (IPRjt), as the ratio between imports and imports plus production at the two-digit level.
Since the IPR directly depends on the production of the industry, there is also a potential endogeneity bias in this case, and for this reason, we consider it as endogenous variable in our system. We also take into account the Herfindahl index calculated as the sum of the squared market share of firms for an industry. The higher the Herfindahl index, the less competitive is the market. We guess that in non-competitive industries, firms adjust their margins in response to trade liberalisation, rather than their productivity, so, we expect a negative sign for this variable. In the same line, the market share (as indicated by the firm) is an interesting variable. It gives a subjective view of the performance of the firm that can differ from the one we observe. This is mainly due
11
Industry indicators are not necessary in our regression analysis because the reference firm included in the total factor productivity measure plays the same role. To integrate industry indicators would absorb the reference firm.
12
Note that we find same results with the use of the Effectively Applied Rates and with the weighted average of MFN tariffs.
13
Tariffs at the 2-digit level of Nace classification were aggregated according to the ISIC Rev.3 classification to make it homogeneous with the classification used in the ESEE.
to the fact that an entrepreneur refers to a precise market in terms of products, while we calculate the market share as the ratio of the firm output and the output of the whole industry. As explained, firms with larger market shares may increase their TFP in response to competitive pressure or reduce their margins. Though, it can be the case that more productive firms capture a larger share of the market. Then, we cannot clearly predict the sign of this variable.
Grossman and Helpman (1991), Ethier (1982), Markusen (1989) pointed out that foreign competition may also affect the incentives to innovate; increase technology transfers or raise intra-firm productivity through an increase in the variety of intermediate inputs or capital goods due to higher quality and/or better technology. To test for this hypothesis, we also include the import share of firms to explain the firms’ TFP and expect a positive impact of this variable. Another important hypothesis of the literature about integration is that it allows better access to the international markets. However, Spanish producers were already granted free-access from 1986 onwards. The rapid increase of Spanish exports all over the 1990s is sufficient to think that the effects of the EU entry were diffused over time. It could be the case that a decrease in trade costs in the EU lowered the minimum productivity level that Spanish exporters needed to enter the EU market. Wagner (2007) summarises the results of 45 econometric studies with micro data referred to 33 countries. He concludes that exporters are, in general, more productive than non-exporters. This may be due to the "learning by exporting" process that is the fact that productivity may improve following the access to foreign markets. Firms access useful technological innovations, international contacts facilitate the technological diffusion and foster a more efficient organisation of firms. Alternatively, it may be explained by the presence of sunk costs at exporting. The most productive firms self-select into the export markets because they are more likely to cope with the sunk costs of entry and survive in the international market. In the Spanish case, Delgado, Fariñas and Ruano (2002) identify a self-selection effect, while they find that learning by exporting holds only for younger firms. For all these reasons, we expect the export intensity to have a positive effect on TFP. Finally, the link between FDI and TFP appears robust in most studies for developing countries, confirming the hypothesis of Coe and Helpman (1995) that openness can also foster technological spillovers through FDI. It seems that some kind of joint venture or participation of foreign companies brings new managerial abilities and techniques that benefit to TFP. We also include the foreign capital share in order to account for this effect.
3.
Results
In this section, we present the results of various sets of estimations. First, we study the average sensitivity of Spanish firms’ TFP to import penetration rate, tariff rate and some characteristics of firms like the share of foreign capital, market share and export ratio and competition in the market measured by the Herfindahl index. We insist on the different effect the trade indicators have on TFP. Secondly, we focus on the importance of firms’ import intensity by adding the import intensity as an explanatory variable. Finally, we check some asymmetries among firms in their reaction to trade policy indicators. We show that reactions differ depending on their size, import and export status, and foreign ownership.
3.1. Average sensitivity to protection and competition
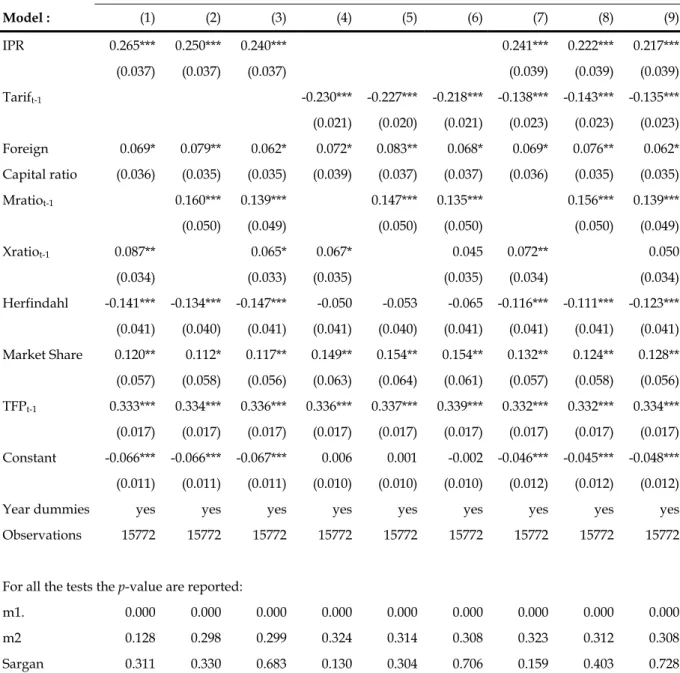
We first look at the average sensitivity of TFP to trade measures by estimating equation 11 using the System-GMM method14. Table 5 in appendix 1shows the results of estimations including either import penetration rate, tariff rate or both indicators. Estimations using the GMM method are based on instruments dated t-2 and before. These levels were chosen according to the results of the Sargan test and the test of autocorrelation of order 2.
Our results15 show that IPR and tariffs have respectively a positive and a negative impact16. These results are in harmony with the theoretical predictions. Though, it was not so evident that, in the case of a European country, the sensitivity of TFP to tariffs will be significant. More interesting is the fact that foreign competition measured by IPR and tariffs have complementary effects. Indeed, when we introduce both variables in the regression, there are both significant at the 1-% level, the
14
To control the results from the GMM estimation, we implement the same regressions with OLS and within groups. As expected, OLS levels appear to give an upward-biased estimate of the coefficient of the lagged dependent variable whereas within groups give a downward-biased estimate of this coefficient.
15
Another important issue is the case of the food sector that is highly protected by the EU. The entry of Spain into the EU consisted in a raise in the protection level toward third countries, and thus a reorientation of its import, production and export in this sector. Then, it could be the case that external tariff had protected Spanish firms from the international competition in this sector. We ran the estimations excluding this sector and obtained similar results (available upon request), which confirms that the negative impact of protection on productivity is an important concern for European countries.
16
coefficient of IPR estimate remains the same while the one of tariff is lowered. One may ask if the potential correlation between the two variables biases these coefficients estimate. Let us recall that EU tariffs can be considered as exogenous for the Spanish economy and they apply for Spanish imports coming from non-EU countries. Consistent with this fact, IPR is only weakly correlated with the tariff rate (30%). IPR represents the presence of foreign products in this market and in particular of European products, while tariffs are more a measure of government intervention and a component of international prices.
These indicators allow us to capture different dimensions of the increasing competition. Namely, the increase of imports works through a decrease in domestic market share and the decline of tariffs pressures domestic products’ prices down. According to the estimations that take into account both indicators, the sensitivity is rather large: a 10% reduction in tariff will lead to an increase of 1.4% of TFP and an increase of IPR of 10% would lead to an increase of 2.2%. These results are very important since they confirm a high sensitivity to the tariffs even if they are lower than in the eighties.
The characteristics of firms we introduced are significant and confirm, as do other studies, that the productivity distribution is not a random process but can be controlled by an explanatory process. The shares of exports in production and the share of foreign capital in total capital are included in estimations because exporters and the affiliates of foreign companies are expected to be more productive than the average in general. The share of foreign capital has a positive and significant impact only at the 10% level. The coefficient of the export to output ratio is positive and significant. Sometimes, when the import to output ratio is included, the export to output ratio is not significant. It may be explained by some correlation between the two variables (31%), corresponding to the fact that exporters prefer to import their intermediate materials in order to keep their production costs under control. It is possible that the level of productivity is better explained by the participation in the export market than by the intensity of exports. Concerning the effect of market structure, the Herfindahl index calculated at the industry level has a negative sign, while the market share of the firm as indicated by the respondent of the survey has a positive effect on TFP. These results indicate that firms, in highly concentrated industries, have a lower level of TFP than firms in other industries, while TFP of firms with higher market share will have higher level of TFP or practice a higher price what overestimate their TFP.
3.2. Additional gains from imported inputs
Our results show that the connections of firms with the international market influence their productivity level. The effect of tariffs and import penetration rates on productivity is often linked to the idea that competition accounts for the main source of trade liberalisation gains. However, the decrease of tariffs and non-tariff barriers generates a reduction of the price of imported inputs as well. It also increases the amount of bought inputs as well as their diversity. Domestic firms have access to a wider range of qualities for their intermediate goods at lower prices and/or to unknown technologies. This technology transfer may improve their productivity as well. We study this issue by taking into account the firms’ import shares. This variable has a positive and significant impact on TFP, and the other coefficient estimates (in particular IPR and Tariff) are not affected by this new variable. Based on this evidence, it is obvious that Spanish manufacturing firms benefited from an additional positive effect of openness via imports. This “technological effect” is complementary to the previous two effects of protection and foreign competition analysed.
3.3. Asymmetries in the sensitivity to protection and competition
It is especially interesting to study whether the effect of trade variables on firm level productivity is conditioned by the firms’ characteristics. Our previous results describe accurately the firms’ average behaviour, but data at the firm level allow for a deeper analysis of heterogeneity of firms. In particular, size, origin of capital, export and import status may not explain directly their TFP level, but could explain the fact that they react differently to the same changes in trade indicators. In turn, this variety of reactions will translate in different productivity levels. Obviously, there are some correlations between these characteristics as shown in the summary statistics (Table 1 in appendix 1). In particular, large firms have, on average, larger export intensities, import intensities and share of foreign capital than small firms. Thus, the share of small firms that export or import is rather low compared to the one of large firms.
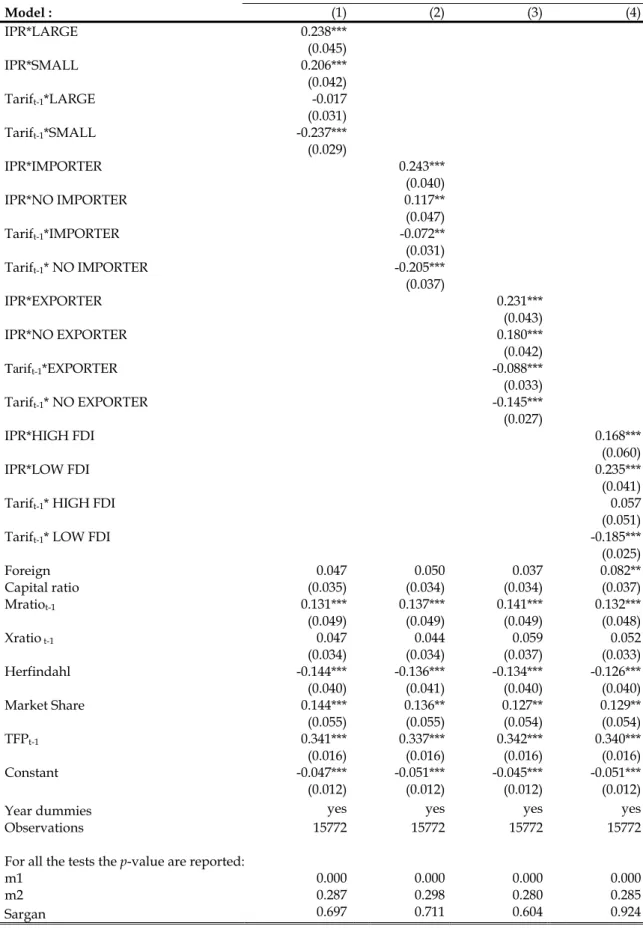
In this section, we propose further estimations to investigate this issue. To this aim, we interact trade openness indicators with dummies that distinguish among these types of firms. The dummies we consider are: LARGE, firms with more than 50 employees in its first year in the sample; HIGH FDI, takes the value 1 for firms with more than 10% of the capital coming from abroad at least one year in the sample and 0 otherwise; EXPORTER takes the value 1 for firms that export more than 10% of their production at least one year in the sample and 0 otherwise; IMPORTER takes the value
the counterpart of LARGE and LOW FDI, NO EXPORTER and NO IMPORTER are respectively the counterparts of HIGH FDI, EXPORTER and IMPORTER. They take the value 1 when their counterpart takes the value 0 and the value 0, otherwise. Results are displayed in Table 6 in appendix 1.
Concerning size, our results show that the presence of foreign products has a similar impact on the productivity of large and small firms. Larger firms seem to react in a similar way as small firms to the increase of imports. In contrast, the size of firms matters, concerning their reactions to tariff cuts. Small firms are largely sensitive to tariffs while the coefficient estimate is not significant for large firms. IPR not only reflects the presence of non-EU products, but also of EU products in the Spanish market, while tariffs only affect non-EU products. The insensitivity of large firms to tariffs may reflect the fact that large firms are more sensitive to the competition at the EU level, while small firms are sensitive to any kind of competition. This result may also reflect the fact that EU products represent the main part of Spanish imports. Nevertheless, small firms are also sensitive to tariffs on third country products while large firms are not. When we take into account import status (column 2), the technological effect appears clearer than in previous estimations. While non-importing firms raise their productivity 1.2 % if IPR increases 10 %, the importers’ productivity increases 2,4% in the same while. Without more qualitative information about imported capital and intermediate goods and the share of each one of the two categories, it is difficult to test if the firms’ imports translate into better technology, better quality or better prices. Indeed, our results show that importing firms benefit from an additional positive effect when foreign competition increases. Firms that do not import are 2 times more sensitive to tariffs than importers. Non-importers are more affected by tariff cuts, which is consistent with the fact that non-importers are mostly small firms that are also more sensitive to third countries prices. We find some similar asymmetries among exporters and non-exporters and among firms with low or important foreign participation. Exporters take more advantage of foreign competition than non-exporters and are less sensible to tariffs. The same result holds for small firms and firms with lower foreign participation whose TFP is more sensitive to tariffs than large and foreign firms (non-significant). More surprisingly, firms with foreign ownership benefit less from foreign competition than others.
In sum, small firms and those that do not import or export or, firms with mainly domestic ownership react more positively to tariff cuts. Tariff rates are a direct component of foreign products prices and the weakest firms (small firms, non-exporting, non-importing or fully domestic owned firms) react stronger to prices than
or fully owned by foreigners) are more willing to produce under increasing returns. They face costs of production lower enough to decrease their prices via a reduction of their margin. On the opposite, the import penetration rate takes into account the reduction of non-tariff barriers of trade and the intensification of trade inside the EU. A higher level of this variable represents more foreign products on the domestic market. When the number of foreign products increases, the range of varieties available in the market raises. This process improves the quality of products and can also reduce the quantity sold by domestic firms. At this moment, even the most competitive firms have to react to the intensification of competition. In other words, when an increase of trade influences foreign prices, it does not influence the productivity of the most competitive firms but on the opposite, when there is a strong additional increase in the imported quantity and a quality improvement then, all the firms react strongly. In the period under study, Spanish tariffs for EU products were already set to zero, but the presence of European products in the Spanish market increases all over the period. It is then logical to find that all firms may have been affected by this phenomenon. During this post-liberalisation process, the variety of products have increased and in particular the availability of capital and intermediate goods. Importers have been able to match with their needs or to find inputs with better quality or with technologies still unknown. Therefore, importers benefit from the additional positive effects on their productivity level.
4.
Conclusions
During the last decade, Spain has experienced a rapid growth of external trade without facing big trade imbalances. Considering the huge increase of Spanish internal demand from the early nineties, the question of how to increase domestic production, competitiveness and productivity has been a key issue for Spain. This country is often viewed as a successful case for new EU members that worry about large trade imbalances since Spain seems to have managed this transition process quite well over the nineties. Though, the competitiveness of the Spanish economy started to decrease especially after the introduction of the euro in 1999 and the trade deficit has increased sharply in last years. According to Chóren et al. (2004), the inflation has been very harmful for the competitiveness of the Spanish economy in last years but this is mainly explained by the increase of prices in the non trading sectors. In the trading sectors (manufactures), productivity of labour has increased slowly, laboral and financial costs has been maintained but margins are diminished because of the increase of others costs.
We also find that TFP of manufacturing industries has increased slowly all over the period which is not a very bad performance since employment in the manufacturing sectors has increased at the same time. This growth of TFP is explained by a combination of the increase of intrafirm productivity that is, an amelioration of the technologies used, and the entry of more productive firms in most sectors, which could be partly explained by the opportunities that offered the openness process. Despite this moderate growth of TFP, we show that the decline of European tariffs on third countries’ products and the increase of the presence of foreign products contributed positively to this process. Moreover, these two effects are complementary. Another important finding is that importing foreign products has an additional positive impact on TFP, and can be seen as a proof for a technological effect that allows for additional productivity improvements.
We confirm however theoretical predictions of the importance of heterogeneity of firms. Each type of firm does not react in the same way since some firms are more sensitive than others to tariffs and competition. In particular, small firms and firms that do not participate in foreign markets via exports, imports or ownership can be considered as more “sensitive” than others to tariff reductions. The effect of competitive pressure on TFP is similar for firms with different sizes. In contrast, importers and exporters react more positively to foreign competition in terms of TFP gains than other firms.
Our paper concludes that, even in a European country with relatively low levels of protection such as Spain, there are additional gains to expect from the trade liberalisation process. However, a large part of the positive effect comes from the presence of foreign products and the more indirect effects of openness rather than from a tariff reduction.
Appendix 1
TABLE 1. Summary statistics Exporter* versus Non-exporter
All Small firms Large firms
Variables Export. Non Exp. Export. Non Exp. Export. Non Exp.
Production 9 316 340 508 732 404 155 181 479 15 300 000 3 059 179 Number of employees 327 38 27 20 526 174 Intermediate consumption 5 431 087 245 136 226 445 96 640 8 897 566 1 402 444 Capital 4 166 867 255 124 120 067 60 243 6 862 182 1 773 935 Export Share 22.5 13.5 28.6 Import Share 11.3 1.9 5.8 1.6 15.1 3.8
Foreign Capital Share 24.6 1.3 4.4 0.4 38.0 8.3
Importer* versus Non-importer
All Small firms Large firms
Variables Import. Non Imp. Import. Non Imp. Import. Non Imp.
Production 9 222 062 257 821 430 983 147 004 14 900 000 1 730 882 Number of employees 324 28 28 19 517 139 Intermediate consumption 5 366 680 122 751 245 867 71 969 8 702 912 797 783 Capital 4 134 707 116 008 128 204 49 857 6 744 961 995 333 Export Share 21.2 2.4 11.8 2.0 27.4 8.9 Import Share 11.8 7.1 14.9
Foreign Capital Share 24.3 0.6 4.6 0.2 37.2 6.7
Source: ESEE. Production, intermediate consumption and capital in 1.000 PTAS. Small firms are those that enter the database with less than 50 employees.
* Exporter: Firms that export at least one year during the period under study.
Source: ESEE. Production, intermediate consumption and capital in 1.000 PTAS. Small firms are those that enter the database with less than 50 employees.
TABLE 2. Production estimates with Olley and Pakes (1996) method
Industry l k m N
1 Food and tobacco 0.280*** 0.163*** 0.505*** 2890
(0.011) (0.019) (0.006)
2 Textiles and textile products 0.401*** 0.043** 0.433*** 2232
(0.012) (0.018) (0.006)
3 Leather and leather products 0.273*** 0.136*** 0.488*** 652
(0.023) (0.011) (0.012) 4 Wood 0.389*** 0.278*** 0.360*** 526 (0.029) (0.022) (0.017) 5 Paper 0.292*** 0.092*** 0.577*** 602 (0.020) (0.012) (0.016) 6 Printing products 0.472*** 0.105*** 0.500*** 1100 (0.020) (0.009) (0.011) 7 Chemical products 0.334*** 0.184*** 0.499*** 1198 (0.014) (0.010) (0.009)
8 Rubber and plastic products 0.394*** 0.115*** 0.469*** 1155
(0.014) (0.011) (0.009)
9 Other non-metallic mineral product 0.415*** 0.199*** 0.449*** 1421
(0.014) (0.007) (0.010)
10 Basic metals 0.224*** 0.092*** 0.626*** 688
(0.016) (0.021) (0.009)
11 Fabricated metal products 0.329*** 0.096*** 0.523*** 1900
(0.013) (0.018) (0.007)
12 Machinery and equipment 0.416*** 0.037*** 0.513*** 1527
(0.016) (0.021) (0.008)
13 Office equipment and precision 0.416*** 0.079*** 0.523*** 352
(0.036) (0.017) (0.016)
14 Electrical and optical equipment 0.383*** 0.103* 0.565*** 1506
(0.014) (0.009) (0.008)
15 Vehicles motor 0.365*** 0.100*** 0.532*** 957
(0.017) (0.004) (0.009)
16 Other transport equipment 0.300*** 0.119*** 0.559*** 358
(0.032) (0.011) (0.016)
17 Other manufactured products 0.393*** 0.068*** 0.517*** 1478
(0.015) (0.024) (0.009)
TABLE 3. MFN tariffs, EU
1991 1996 2002
1 Food and tobacco
2 Textiles and textile products 3 Leather and leather products 4 Wood
5 Paper
6 Printing products 7 Chemical products 8 Rubber and plastic products 9 Other non-metallic mineral product 10 Basic metals
11 Fabricated metal products 12 Machinery and equipment n.e.c 13 Office equipment and precision 14 Electrical and optical equipment 15 Vehicles motor
16 Other transport equipment 17 Other manufactured products
42.28 10.81 8.34 5.52 7.97 4.79 7.12 7.23 5.53 5.18 5.48 4.29 5.39 6.21 8.4 4.67 5.73 37.77 10.14 7.35 4.25 5.46 3.73 4.85 6.13 4.32 3.83 4.03 2.81 3.58 4.78 7.08 3.23 4.02 33.81 9.20 6.52 3.45 1.50 1.47 4.64 4.87 3.42 5.38 2.89 1.85 1.54 2.68 6.34 2.32 2.72
TABLE 4. Decomposition of productivity growth (1991-2002), Foster, Haltiwanger and Krizan (1998)
Industry Within effect Between effect Covariance effect Entry effect Exit effect Total
1 Food and tobacco 0.024 -0.081 0.067 -0.021 0.049 -0.059
2 Textiles and textile products 0.091 0.014 0.092 0.037 -0.009 0.242 3 Leather and leather products -0.004 -0.031 0.047 0.173 0.027 0.157
4 Wood 0.242 0.022 -0.054 0.122 0.024 0.308
5 Paper 0.133 -0.001 -0.032 0.192 0.005 0.288
6 Printing products 0.126 -0.001 -0.046 0.095 0.008 0.166
7 Chemical products 0.077 0.044 0.102 0.072 0.019 0.276
8 Rubber and plastic products 0.084 0.004 0.079 0.173 0.005 0.334
9 Other non-metallic mineral product 0.104 0.012 0.085 0.058 0.016 0.243
10 Basic metals 0.093 -0.007 0.017 0.084 0.017 0.171
11 Fabricated metal products 0.029 -0.003 0.019 0.018 0.040 0.023
12 Machinery and equipment n.e.c 0.098 -0.020 0.101 0.037 -0.007 0.223 13 Office equipment and precision 0.016 -0.002 0.020 0.060 0.011 0.083 14 Electrical and optical equipment 0.052 -0.007 0.086 0.209 0.011 0.329
15 Vehicles motor 0.027 -0.036 0.110 0.099 0.006 0.195
16 Other transport equipment 0.020 -0.014 0.107 0.002 -0.031 0.147
17 Other manufactured products 0.160 -0.023 -0.088 -0.014 -0.016 0.051
TABLE 5. Average effect of import penetration rate and tariffs on TFP (1991-2002) GMM SYS (t-2) Dependent variable: ln(TFPit) Model : (1) (2) (3) (4) (5) (6) (7) (8) (9) IPR 0.265*** 0.250*** 0.240*** 0.241*** 0.222*** 0.217*** (0.037) (0.037) (0.037) (0.039) (0.039) (0.039) Tarift-1 -0.230*** -0.227*** -0.218*** -0.138*** -0.143*** -0.135*** (0.021) (0.020) (0.021) (0.023) (0.023) (0.023) Foreign 0.069* 0.079** 0.062* 0.072* 0.083** 0.068* 0.069* 0.076** 0.062* Capital ratio (0.036) (0.035) (0.035) (0.039) (0.037) (0.037) (0.036) (0.035) (0.035) Mratiot-1 0.160*** 0.139*** 0.147*** 0.135*** 0.156*** 0.139*** (0.050) (0.049) (0.050) (0.050) (0.050) (0.049) Xratiot-1 0.087** 0.065* 0.067* 0.045 0.072** 0.050 (0.034) (0.033) (0.035) (0.035) (0.034) (0.034) Herfindahl -0.141*** -0.134*** -0.147*** -0.050 -0.053 -0.065 -0.116*** -0.111*** -0.123*** (0.041) (0.040) (0.041) (0.041) (0.040) (0.041) (0.041) (0.041) (0.041) Market Share 0.120** 0.112* 0.117** 0.149** 0.154** 0.154** 0.132** 0.124** 0.128** (0.057) (0.058) (0.056) (0.063) (0.064) (0.061) (0.057) (0.058) (0.056) TFPt-1 0.333*** 0.334*** 0.336*** 0.336*** 0.337*** 0.339*** 0.332*** 0.332*** 0.334*** (0.017) (0.017) (0.017) (0.017) (0.017) (0.017) (0.017) (0.017) (0.017) Constant -0.066*** -0.066*** -0.067*** 0.006 0.001 -0.002 -0.046*** -0.045*** -0.048*** (0.011) (0.011) (0.011) (0.010) (0.010) (0.010) (0.012) (0.012) (0.012)
Year dummies yes yes yes yes yes yes yes yes yes
Observations 15772 15772 15772 15772 15772 15772 15772 15772 15772
For all the tests the p-value are reported:
m1. 0.000 0.000 0.000 0.000 0.000 0.000 0.000 0.000 0.000
m2 0.128 0.298 0.299 0.324 0.314 0.308 0.323 0.312 0.308
Sargan 0.311 0.330 0.683 0.130 0.304 0.706 0.159 0.403 0.728
TABLE 6. Interaction of import penetration rate and tariff with firm’s characteristics GMM SYS (t-2) Dependent variable: ln(TFPit) Model : (1) (2) (3) (4) IPR*LARGE 0.238*** (0.045) IPR*SMALL 0.206*** (0.042) Tarift-1*LARGE -0.017 (0.031) Tarift-1*SMALL -0.237*** (0.029) IPR*IMPORTER 0.243*** (0.040) IPR*NO IMPORTER 0.117** (0.047) Tarift-1*IMPORTER -0.072** (0.031) Tarift-1* NO IMPORTER -0.205*** (0.037) IPR*EXPORTER 0.231*** (0.043) IPR*NO EXPORTER 0.180*** (0.042) Tarift-1*EXPORTER -0.088*** (0.033) Tarift-1* NO EXPORTER -0.145*** (0.027) IPR*HIGH FDI 0.168*** (0.060) IPR*LOW FDI 0.235*** (0.041)
Tarift-1* HIGH FDI 0.057
(0.051)
Tarift-1* LOW FDI -0.185***
(0.025) Foreign 0.047 0.050 0.037 0.082** Capital ratio (0.035) (0.034) (0.034) (0.037) Mratiot-1 0.131*** 0.137*** 0.141*** 0.132*** (0.049) (0.049) (0.049) (0.048) Xratio t-1 0.047 0.044 0.059 0.052 (0.034) (0.034) (0.037) (0.033) Herfindahl -0.144*** -0.136*** -0.134*** -0.126*** (0.040) (0.041) (0.040) (0.040) Market Share 0.144*** 0.136** 0.127** 0.129** (0.055) (0.055) (0.054) (0.054) TFPt-1 0.341*** 0.337*** 0.342*** 0.340*** (0.016) (0.016) (0.016) (0.016) Constant -0.047*** -0.051*** -0.045*** -0.051*** (0.012) (0.012) (0.012) (0.012)
Year dummies yes yes yes yes
Observations 15772 15772 15772 15772
Appendix 2. Data
For the cleaning process, we choose to use interpolation to fill the gaps for a particular variable if a firm reported no value in a given year, while values were reported in the year prior and the year after the missing one. In particular, we did so, for all the components of the value added, labour and investment, in order to obtain better estimates for the TFP. This only applies for 114 observations of 24241. We dropped from the sample all the observations corresponding to firms that did not answered this year except if data were interpolated using the criterion explained above. The capital stock is measured using the inventory perpetual method with a depreciation rate of 9% base on the average depreciation rate as used in FBBA (2005). After eliminating the firm for which we do not have fixed asset in any year we have 3167 observations per year. We finally dropped observations with unrealistic large spikes in the data (e.g. value-added negative, growth in value added of more than 300% with a reduction of employment).
We use production price index at 3-digit industry level to express in constant terms the production and the intermediary consumption. To deflate the capital, we deflate the investment by the investment price index at 3-digit level. The other variables do not need to be deflated because they are expressed in numbers or in ratios. Deflators come from Instituto Nacional de Estadística.
References
AMITI, M., KONINGS, J. (2005): Trade liberalisation, intermediate inputs, and productivity: evidence from Indonesia″. IMF Working Paper, 05/146.
BARRIOS, S., GOERG, H., STROBL, E. (2003): Explaining Firms' Export Behaviour: R&D, Spillovers and the Destination Market. Oxford Bulletin of Economics and Statistics 65(4), 475-496, 09.
BARRIOS, S., STROBL, E. (2004): Learning by Doing and Spillovers: Evidence from Firm-Level Panel Data. Review of Industrial Organization 25(2), 175-203, 06
BERNARD, A., EATON, J., JENSEN, J. B., KORTUM, S.(2003): Plants and productivity in international trade. American Economic Review 93, 1268–1291.
BERNARD, A.B., JENSEN, J.B., SCHOTT, P.K. (2006): Trade costs, firms and productivity. Journal of Monetary Economics 53(5), 917-937.
BLUNDELL, R., BOND, S. (1998): Initial Conditions and Moment Restrictions in Dynamic Panel Data Models. Journal of Econometrics 87, 115-143.
BLUNDELL, R., BOND, S. (2000): GMM Estimation with Persistent Panel Data: an Application to Production Functions. Econometric Reviews 19(3), 321-340.
CAMPA, J.M. (2004): Exchange rates and trade: How important is hysteresis in trade? European Economic Review 48, 527-548.
CAÑADA, A., CARMENA, A. (1991): Los cambios en el sistema fiscal arancelario: repercusiones sobre la competitividad de España (1986-1989). Boletín de Información Comercial Española 2263, 11-27.
COE, D.T., HELPMAN, E. (1995): International R & D and Spillovers. European Economic Review 39, 859-887.
CHORÉN P, GOERLICH F, MILGRAM J, ROBLEDO JC, SOLER A, SERRANO L, UNAL-KESENCI D, MAS M, PEREZ F (Dir) (2004): La competitividad de la economía española: inflación, productividad y especialización, La Caixa, colección estudios económicos, 209 página
CUÑAT, A., MAFFEZZOLI, M. (2007): Can Comparative Advantage Explain The Growth Of US Trade?. The Economic Journal 117 (April), 583–602.
DELGADO, M.A., FARIÑAS, J.C., RUANO, S. (2002): Firm productivity and export markets: a non-parametric approach. Journal of International Economics 57, 397-422.
DRIFFIELD, N.L., KAMBHAMPATI, U.S. (2003): Trade liberalisation and the efficiency of firms in Indian manufacturing. Review of Development Economics 7(3), 419-430.
EATON, J., KORTUM, S. (2002): Technology, geography and trade. Econometrica 70(5), 1741-1780.
ETHIER, W. (1982): National and international returns to scale in the model theory of international trade. American Economic Review 72(3) 389-405.
FARIÑAS, J.C., MARTIN-MARCOS, A. (2007): Exporting and economic performance: firm-level evidence for Spanish manufacturing. The World Economy 4, 618-646.
FARIÑAS, J.C., RUANO, S. (2004): The dynamics of productivity: a decomposition approach using distribution functions. Small Business Economics 22, 237-251.
FARIÑAS, J.C., RUANO, S. (2005): Firm productivity, heterogeneity, sunk costs and market selection. International Journal of Industrial Organization 23, 505-534.
FERNANDES, A.M. (2007): Trade policy, trade volumes and plant-level productivity in Colombian manufacturing industries. Journal of International Economics 71(1), 52-71. FOSTER, L., HALTIWANGER, J., KRIZAN, C.J.(1998): Aggregate Productivity Growth:
Lessons from Microeconomic Evidence. NBER Working Papers 6803, National Bureau of Economic Research, IncFrankel,
FRANKEL J.A., STEIN, E., WEI, S.-J. (1996): Regional Trading Arrangements: Natural or Supernatural. American Economic Review 86(2), 52-56, May.
GROSSMAN, G., HELPMAN, E. (1991): Innovation and growth in the global economy. Cambridge, Massachusetts: MIT Press.
HARRISON, A. (1994): Productivity, imperfect competition and trade reform: theory and evidence. Journal of International Economics 36, 53–73.
HELPMAN, E., KRUGMAN, P. (1985): Market Structure and Foreign Trade. London, The MIT Press.
HELPMAN, E., MELITZ, M.-J, YEAPLE, S.-R. (2004): Export versus FDI with Heterogeneous Firms. American-Economic-Review 94(1): 300-316.
HUERGO, E., JAUMANDREU J. (2004): Firms’ age, process innovation and productivity growth. International Journal of Industrial Organization 22(4), 541-559.
KRISHNA, P., MITRA, D. (1998): Trade liberalisation, market discipline and productivity growth: new evidence from India. Journal of Development Economics 56, 447-462. KRUGMAN, P.R. (1979): Increasing returns, monopolistic competition and international trade.
Journal of International Economics 9, 469-479.
MAÑEZ, J.A., ROCHINA, M.E., SANCHIS, J.A. (2004): The decision to export: a panel data analysis for Spanish manufacturing. Applied Economics Letters 11(11):669-673.
MARKUSEN, J.R. (1989): Trade in producer services and in other specialized intermediate inputs. American Economic Review 79(1), 85-95.
MELITZ, M. (2003): The impact of trade on intra-industry reallocations and aggregate industry productivity. Econometrica 71, 1695–1725.
MERINO, F., SALAS, V. (2002): Causes and consequences of exports' channel integration. Spanish Economic Review 4(4), 239-259.
OLLEY, G.S., PAKES, A. (1996): The dynamics of productivity in the telecommunications equipment industry. Econometrica 64, 1263– 1297.
PAKES, A. (1994): Dynamic structural models, problems and prospects Part II: Mixed continuous-discrete control problems and market interactions”, in Advances in Econometrics, Cambridge University Press.
PANAGARIYA, A., KRISHNA, P. (2002): On necessarily welfare-enhancing free trade areas. Journal of International Economics 57(2), August, 353-367.
PAVCNIK, N. (2002): Trade liberalisation, exit and productivity improvements: evidence from Chilean plants. Review of Economic Studies 69, 245–276.
SALOMON, R., SHAVER, J. M. (2005): Learning by Exporting: New Insights from Examining Firm Innovation. Journal of Economics and Management Strategy, 14 (2): 431-460. SCHOR, A. (2004): Heterogeneous productivity response to tariff reduction. Evidence from
Brazilian manufacturing firms. Journal of Development Economics 75, 373-396.
STOKEY N. (1991): Human capital, product quality, and growth, Quaterly Journal of Economics 106(2), 587-616.
TAMAMES, R. (1986): La Unión Europea. Alianza, Madrid 1996, 3ª ed.
TOPALOVA, P. (2004): Trade liberalisation and firm productivity: the case of India. IMF Working Paper 04/28.
TREFLER, D. (2004): The Long and Short of the Canada-U.S. Free Trade Agreement. The American Economic Review 94(4), 870-896.
TYBOUT, J.R. (2000): Manufacturing firms in developing countries: how well do they do and why? Journal of Economic Literature XXXVIII, 11– 44.
TYBOUT, J.R., DEMELO, J., COBO, V. (1991): The effects of Trade Reforms on Scale and Technical Efficiency: new Evidence from Chile. Journal of International Economics 31, 231-59.
TYBOUT, J.R., WESTBROOK, D. (1995): Trade Liberalisation and Dimensions of Efficiency Change in Mexican Manufacturing Industries. Journal of International Economics 39, 53-78.
WAGNER J. (2007): Exports and Productivity: A Survey of the Evidence from Firm-level Data. The World Economy 30(1), 60-82, 01.
WEI, S.J., FRANKEL, J.A.(1996): Can regional blocs be a stepping stone to global free trade? a political economy analysis. International Review of Economics & Finance 5(4), 339-347.
XIE X. (1999): Contagion through interactive production and dynamic effects of trade, International Economic Review 40(1), 165-186.
YEAPLE, S.R. (2005): A simple model of firm heterogeneity, international trade, and wages. Journal of International Economics 65, 1-20.
YOUNG A. (1991): Learning by doing and the dynamic effects of international trade, Quarterly Journal of Economics 106, 369-405.