A COMPARATIVE ANALYSIS OF THE DANGERS OF CAPITAL INFLOWS
by
Lawrence Mark Segall
`
Thesis submitted in fulfilment of the requirements for the degree of Master of Management in Finance & Investment
in the
FACULTY OF COMMERCE LAW AND MANAGEMENT WITS BUSINESS SCHOOL
at the
UNIVERSITY OF THE WITWATERSRAND
2 DECLARATION
I, Lawrence Mark Segall, declare that the research work reported in this dissertation is my own, except where otherwise indicated and acknowledged. It is submitted for the degree of Master of Management in Finance & Investment in the University of the Witwatersrand, Johannesburg. This thesis has not, either in whole or in part, been submitted for a degree or diploma to any other universities.
3 TABLE OF CONTENTS 1.1 Abstract 8 1.2 Introduction 8 1.3 Objectives 9 1.4 Limitations 10 1.5 Methodology 10 1.6 Problems Statement 11 2.1Literature Review 15
2.2 Introduction to Literature Review 15
2.3 Definition of Current Account 15
2.4 Current Account Deficit 17
2.5 Capital Account 17
2.6 Portfolio Inflows 18
2.7 Foreign Direct Investment (FDI) 18
2.8 Cost and Benefits of Capital Inflows 19
2.9 Link Between Current and Capital Account 19
3.1South African Current Account Deficits 21
4
3.3 Capital Inflows into South Africa 25
3.4 Current Account Deficits in Argentina 29
3.5 Average Current Account Deficit – Argentina 30
3.6 Capital Inflows into Argentina 31
3.7 Comparative Analysis 38
4.1 Consequences of High Portfolio Inflows 39
4.2 Sudden Stops 39
4.3 Outcomes of a Sudden Stop 41
5.1 Solution to Sudden Stops 42
5.2 Foreign Direct Investments (FDI) 42
5.3 FDI: Good or Bad 43
5.4 The Advantages of FDI 43
5.5 The Disadvantages of FDI 44
5.6 FDI in South Africa 45
5.7 Conclusion 46
6.1 Appendices 48
5 LIST OF FIGURES
Figure 1.1 South African Current Account Deficits from 2006 to 2010 13
Figure 1.2 Argentinean Current Account Deficits from 2006 to 2010 14
Figure 1.3 Portfolio inflows as a Percentage of GDP into South Africa 23
Figure 1.4: Capital Inflows into South Africa 24
Figure 1.5 Capital Flows to LAC-7 countries 26
Figure 1.6 Correlation between Capital flows and Gross Output
in Argentina 34
Figure 1.7 Portfolio inflows as a Percentage of GDP into Argentina 37
Figure A: Current Account Balance, December 2010 48
Figure B: Current Account Balance, December 2009 49
Figure C: Current Account Balance, December 2008 49
Figure D: Current Account Balance, December 2007 50
Figure E: Current Account Balance, December 2006 50
Figure F: Current Account Balance, December 2005 51
Figure G: Current Account Balance, December 2004 51
Figure H: Current Account Balance, December 2003 52
Figure I: Current Account Balance, December 2002 52
6
Figure K: Current Account Balance, December 2000 53
Figure L: Inflows into South Africa in 2010 and 2011 54
Figure M: Inflows into South Africa in 2009 and 2010 55
Figure N: Inflows into South Africa in 2008 and 2009 55
Figure O: Inflows into South Africa in 2007 and 2008 56
Figure P: Inflows into South Africa in 2006 and 2007 56
Figure Q: Inflows into South Africa in 2006 and 2007 57
Figure R: South African GDP Figures From 1998-2009 in
South African Rand 58
LIST OF TABLES
Table 1.1 Example of the current account 16
Table 1.2 Trade Deficits and Surpluses 20
Table 1.3: Summary of South African Current Account Deficits as a Percentage of GDP
from 2006-2009 21
Table 1.4 Current Account Deficits as a Percentage of GDP adjusted
7
Table 1.5 Average South African Current Account Deficit as a Percentage
of GDP 24
Table 1.6 Portfolio Inflows and Current Account Deficits 25
Table 1.7 Proportions of Capital Inflows into South Africa 27
Table 1.8 Inflows and Total Capital inflows (R Billion) 29
Table 1.9 Argentina Current account Deficit 30
Table 1.10 Capital Inflows into Argentina from 1992-1998 36
8 1.1 Abstract
This report examines the effects of running a high current account deficit in conjunction with large short term capital inflows into South Africa. In order to gain a better understanding of such effects, a comparative analysis with the Argentinean economy shall be undertaken. Argentina has experienced episodes of large capital inflows, preceded by periods of minimal capital inflows. This caused an economic slowdown in Argentina. Similarities are evident between the types of inflows into both South Africa and Argentina, with short term portfolio inflows being dominant. Nevertheless, Argentina received roughly 1.75 times the amount of portfolio inflows at its peak capital inflow as compared to South Africa. These figures suggest that South Africa is at a lesser risk (of being overly reliant on short-term inflows) compared to Argentina owing to the lower amount of portfolio inflows, however this is not the case. South Africa has extremely low foreign direct investment (FDI) numbers, which elucidates instability in terms of capital inflows (FDI provides stable inflows of capital for a long period of time). FDI is considered to be a source of long term inflows and thus more stable. Low FDI figures and, high portfolio inflows along with the high current account deficit figures indicate that South Africa may be in danger of being over-reliant on portfolio inflows to finance its high current account deficit. South Africa has been running an average current account deficit of 4.9 percent from 2006-2010, with portfolio inflows as a percentage of total capital inflows from 2006 until 2009, averaging 54 percent.
9 1.2 Introduction
When a country runs a current account deficit, this deficit needs to be financed. In this, the link between the current and capital accounts can be seen. There are various ways in which a current account deficit can be financed. South Africa for example, has financed it high current account deficits, which peaked at 9.2 percent of GDP in Q1 of 2008 and averaged 4.9 percent of GDP from 2006-2009, mainly through short term portfolio inflows. Short-term inflows are- as indicated by their name- of the short term nature. As a result, they can be reversed easily, elucidating that the financing of a current account deficit in this way may not be sustainable in the long run. This situation gives rise to major concerns over the
sustainability of the South African current account deficit. Argentina, by comparison, has experienced a similar situation to South Africa between 1993 and 2000 in which it relied heavily on large quantities short-term capital inflows not only to finance its current account deficit but also to promote economic growth. The similarities between the sustainability of the South African and Argentinean current account deficit include the following:
• Both countries ran current account deficits
• Both countries have had large inflows of capital, mainly in the form of short term inflows
This, among other factors, such as the similarity between GDP figures and population size, allows for a comparison to be made between the two countries. The sample period is from 2006- 2010 for South Africa, and 1993-2000 for Argentina.
1.3 Objectives
The objectives of this report include the following:
10
• Analysis of the types and proportions of capital inflows into South Africa. • Determining if there is a link between current account deficits and capital inflows. • Determining the effects that short term capital inflows can have on a country’s
economy for both South Africa and Argentina,- and on using such inflows as a means to finance a current account deficit.
• Comparison between capital inflows into South Africa from 2006 to 2009 and Argentina between 1993 and 1998.
• Analysis of the Argentine financial crises experienced between 1993 and 1998 due to a sudden stop of capital inflows.
• Correlate any findings and similarities between SA and Argentina and arrive at conclusions.
1.4 Limitation
This paper is an empirical examination of the effects of the current account deficits and capital inflows into South Africa. The research proposes practical solutions based on figures obtained from published papers, working papers, IMF data, South African Reserve Bank data, Banco Central del la Republica Argentina data.
1.5 Methodology
The research methodology for this paper shall be a quantitative analysis of all related data, the researcher will work with secondary data and shall employ a descriptive narrative on the numbers produced by other academic articles as well as data produced by the South African Reserve Bank and Banco Central del la Republica Argentina.
The researcher shall do the following:
11
• Analyse current account figures for Argentina from 1991-2000
• Analyse capital inflows (types and amounts) into both South Africa and Argentina over the same sample periods as mentioned above.
• Compare the above figures and draw conclusions
1.6 Problem Statement
South Africa has been running a high current account deficit for a number of years, from 2006-2009, in particular. This is confirmed in Table 1.3 below. Such a deficit is an indication that a country is living beyond its means Balchin, 2009). When a country runs a current account deficit, this deficit needs to be financed. A current account deficit can be financed through capital inflows such as portfolio inflows, Foreign Direct Investment (FDI) and Other Investments, by borrowing money or by the drawing down of previously accumulated wealth or reserves. The nature of such capital inflows can either be short term or long term. An example of a short-term inflow is a portfolio inflow, which involves the purchase of domestic shares or bonds by foreigners (Resnick and Eun, 2009, p.65). Portfolio inflows have been the major component of capital inflows into South Africa, (Mohammed, 2007, p.3) (Table 1.7) and due to its reversibility, many economists have become concerned that these short-term inflows finance the high current account deficit. The sudden slowdown of capital inflows for a considerable period of time is a phenomenon known as a sudden stop (Calvo and Reinhart, 2000, p.2). Portfolio inflows, in particular, are the main type of inflows that can be reversed easily and quickly. This means that these inflows are more susceptible to inducing a sudden stop when compared to long term inflows.
12
Previous episodes of sudden stops include the following:
• Chile experienced a sudden stop of capital inflows following the Russian/Asian crisis. The rapid halt in capital inflows came mainly in the form of portfolio inflows, which were a large component of its total capital inflow (Calvo & Talvi, 2005, p.7).
• East Asian Countries1 experienced large capital inflows (short term bank loans) prior to the 1998 Russian/Asian crisis. Capital inflows decreased by 250 percent from 1996 to 1998 (Bustelo, 2004, p.7), wreaking havoc on not only East Asia, but many other countries too.
A sudden stop of capital inflows for a sustained period of time can be extremely harmful to an economy. The reason a sudden stop is so harmful is that it dries up available funds rapidly, thus leaving a country short on finance. The nature of capital inflows into a country is thus of great concern due to the stronger probability that short term inflows can be reversed.
However, this is mainly the case when a country has a current account deficit that needs to be financed. China, for example, has no current account deficit, so a sudden stop would be less harmful to the Chinese economy. Considering that portfolio inflows have been the major type of capital inflows into South Africa (Table 1.7), such inflows have been the major financier of the current account deficit Therefore, - a stop in such flows could possibly signal that the current account deficit is unsustainable. The deficit is unsustainable in the sense that the financing of the current account deficit is not guaranteed. If this is indeed the case, where inflows are insufficient to cover the current account deficit, then the country needs to implement domestic austerity measures (e.g. cut government expenditure or increase tax which could be one of the ‘causes’ of the CA deficit).
1
13
Argentina has previously experienced episodes in which a sudden decrease in capital inflows occurred. This created a sufficient platform for an adequate comparative analysis to be made with South Africa. Argentina was chosen as a suitable partner for the above comparison due to the similarities between South Africa and Argentina’s gross domestic product (GDP) and population size. Argentina and South Africa both have nominal GDP’s hovering around 300 million U.S Dollars and, due to this similarity, a comparison can thus be made (World Bank, 2010). Both countries also have a similar current account deficit pattern, which can be seen effectively below in Figures 1.1 and 1.2.
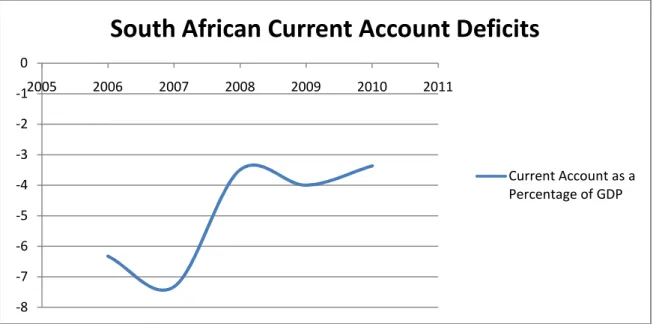
Figure 1.1 South African Current Account Deficits from 2006 to 2010
Source: Data Extracted from Table 1.3 -8 -7 -6 -5 -4 -3 -2 -1 0 2005 2006 2007 2008 2009 2010 2011
South African Current Account Deficits
Current Account as a Percentage of GDP
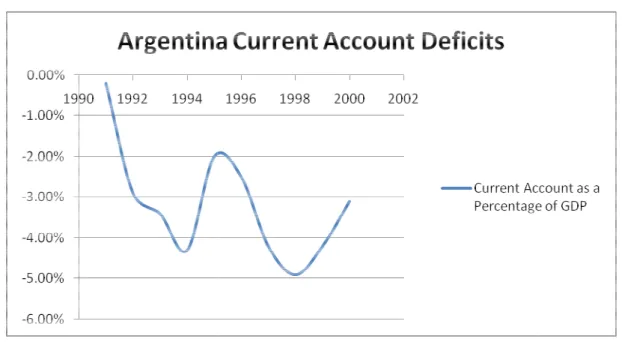
Figure 1.2 Argentinean Current Account Deficits from 2006 to 2010
Source: Data Extracted from Table 1.8
Figures 1.1 and 1.2 show a similar pattern with the current account deficits both increasing and then decreasing, then again increasing and decreasing
14
Current Account Deficits from 2006 to 2010
Extracted from Table 1.8
Figures 1.1 and 1.2 show a similar pattern with the current account deficits both increasing and then decreasing, then again increasing and decreasing
15 2.1 Literature Review
2.2 Introduction to Literature Review
This literature review is focused on the main themes of the research, namely capital inflows, current account deficits and all related effects and consequences. The review begins with an overview of the current account, the current account deficit and the capital account, which is important for fully understanding the terminology and conclusions that follow. Having understood all basic terminology, the research then moves onto the actual figures on the current account in South Africa and Argentina, as well as to the capital inflows into South Africa and Argentina. Lastly, the research draws conclusions and recommendations from the above findings.
2.3 Definition of the Current Account
Prior to understanding the current account deficit, the current account of the balance of payments must first be understood. Resnick and Eun (2009, p.62) state that the current account includes the export and import of goods and services. The current account is the difference between a nation's total export of goods, services, and transfers, and its total imports of them, as well as the difference between interest income and interest expenses.
The current account can thus be broken up further into 4 sub-categories:
1. Merchandise trade 2. Services
3. Factor income 4. Unilateral transfers (Resnick and Eun, 2009, p.63)
16
Examples of merchandise trade include imports or exports of tangible goods, such as oil, machinery, or food. Therefore, if a country is importing more merchandise than it is
exporting, then that country is running a trade deficit. The idea of services is simpler: It is the payment or receipt of payment for professional services rendered (engineering, accounting etc), tourist expenditure, intellectual property and so on. Factor income includes the receipt or payment of dividends, interest, or other income on foreign investments. Lastly, unilateral transfers include foreign aid, repatriations etc.
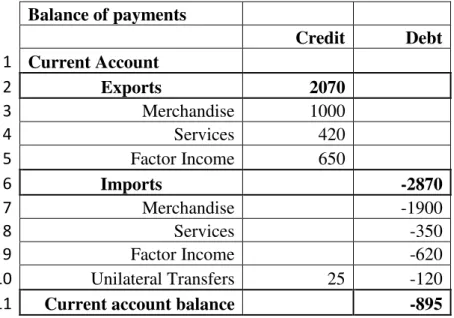
In Table 1.1 below, a fictional example of a current account is shown. Generally speaking, any money received from a foreign entity will be credited, as can be seen in columns 3, 4 and 5. This will be registered with a positive sign and recorded as an income. The opposite occurs when payment is made to foreign entities, as seen in columns 7, 8 and 9. This will be
recorded as a debit and is given a negative sign and thus can be thought of as an outflow of money.
Table 1.1 Example of the current account
Balance of payments Credit Debt 1 Current Account 2 Exports 2070 3 Merchandise 1000 4 Services 420 5 Factor Income 650 6 Imports -2870 7 Merchandise -1900 8 Services -350 9 Factor Income -620 10 Unilateral Transfers 25 -120
11 Current account balance -895
17
The total represented in the second row is calculated by adding rows 3 to 5. The total represented in row 6 is calculated by the addition of rows 7 to 9. One can clearly see a negative sign in row 11, which is an addition of rows 2, 6 and 10. The -895 indicates that in this example, there is an overall deficit on the current account of the balance of payments.
2.4 Current Account Deficit
The current account deficit can now be discussed and analysed further. A current account deficit occurs when a country's import costs of services, goods and transfers is greater than its export costs of services, goods and transfers (Balchin, 2009).
2.5 Capital Account
The current account cannot be analysed without simultaneously looking at the capital
account, as illustrated in Dreper and Freytag (2009, p.5), who state that in order to gain a real understanding of the current account, an analysis of the capital account is also required. Resnick and Eun (2009, p.64) further state that the capital account includes all the purchases and sales of assets, such as stocks, bonds, real estate and businesses.
The capital account, like the current account, can also be broken down into 3 categories:
1. Portfolio investment 2. Direct investment 3. Other Investment
18 2.6 Portfolio Inflows:
Portfolio flows involve the purchase or sale of shares or bonds. Capital markets have become highly integrated and globalised over the last decade, and it has become increasingly easier to access foreign capital markets. This is largely due to technological advancements, the need for portfolio diversification (in order to minimize risk) and the fact that multi-national-corporations (M.N.C’s) source capital from foreign markets (Resnick and Eun, 2009, p.16). In line with the above, such portfolio inflows have also been the major component of capital inflows into South Africa (Mohammed, 2007, p.3). Buying bonds can easily change into selling bonds, and thus a portfolio inflow can easily be converted into an outflow. The factor driving this volatile pattern is the consistently changing market environments. An investor who invests in the short term has the ability to increase or decrease funds hastily, when he/she feels the market has changed. For this reason, many economists have questioned both South Africa’s large current account deficit between 2006 and 2009 and the way in which it is financed. An immediate halt in capital inflows can be harmful to an economy, as it will dry up available funds and could force the government to adopt austerity measures in order to reduce the current account deficit.
2.7 Foreign Direct Investment (FDI)
FDI is a type of investment that earns dividends in organisations which operate outside of the local region of the investor (Resnick and Eun, 2009, p.65). FDI provides a more stable means of capital inflow due to its long term commitment. Resnick and Eun (2009, p.65) define FDI as the process of setting up business operations in a foreign country.
19 2.8 Costs and Benefits of Capital inflows
A capital inflow is as an inflow of money into a country from a foreign source. According to this definition, one would immediately assume there are no negative sides to capital inflows; however this is not the case. Let us consider a person who has a large income. This person could consume, i.e. live a life in accordance with that income, including lavish holidays, food and homes. This person could also use that income to save; that is to invest in shares, bonds or other securities in order to provide a stable income for the future. However, should this person’s income decrease, so too will his livelihood, and the adjustment to a more simple life may be extremely difficult. This applies similarly in the cases of countries. As a country receives large capital inflows, it is allowed to either spend that money in a productive manner (investments, infrastructure, increasing reserves) or consume it (imports, consumption, rising share index and capital flight). However, an adjustment phase may need to take place should those inflows come to a halt. In this lie the dangers of capital inflows. The uncertainty of capital inflows, and in particular short term inflows, perpetuates a dangerous situation for government and the economy, as during the adjustment phase, the economy and people may suffer. Jobs can be lost and the livelihood of a country’s citizens may decrease.
2.9 The Link between the Current and Capital Account
The link between the current and capital account can be confirmed by the data illustrated in Table 1.2 below. Table 1.2 below shows the trade surplus/deficits that The United States of America (USA) ran from 1989-2006. One can see that America ran a current account deficit, although it backed that deficit up by running a constant capital account surplus.
20 Table 1.2 Trade Deficits and Surpluses
Year Balance on current account Balance on capital account Trade Surplus/Deficit 2004 -100 50 -50 2005 -235 215 -20 2006 -250 275 25 2007 -315 325 10 2008 -285 345 60
Source: Fictional Example
The trade surplus/deficit as seen in the above table is calculated by the addition of the current account balance and capital account balance. It is the overall number for the balance of payments. One can see that there is a trade deficit in the 2004 and 2005 trade surplus. In the above fictional example, the country was able to run a current account deficit from 2006 to 2008, as it was backed up by a larger capital account. However, in 2002 and 2003, the balance on the capital account was not sufficient to cover the current account deficit. Generally, first world countries are able to run large current account deficits as they are backed up by larger capital accounts surpluses, e.g. the USA.
The above table clarifies how a country is able to run a deficit on the current account or the capital account provided it is backed by the other. A current account deficit can be offset by a surplus on the capital account and accordingly the reverse hold true. An analysis into the capital and current account should be conducted in order to examine if any actions should be taken in order to reduce or increase the numbers. The analysis will take a careful look at the financing of such a deficit, and if this financing is of the short -term (unsustainable) nature, it would be advised to decrease its current account deficit.
21 3.1 South African Current Account Deficits
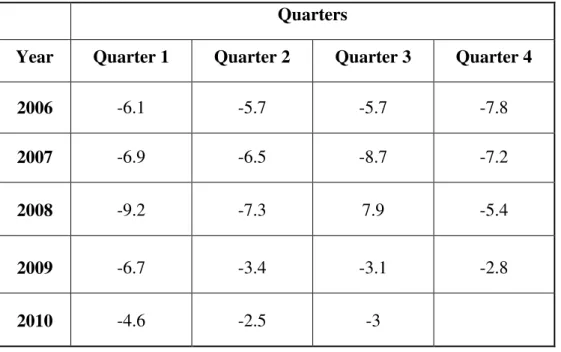
Table 1.3 (below) shows a key period in South Africa’s recent economic history. One can identify the large and persistent current account deficits over such periods which required financing. As confirmed in Table 1.3, the current account deficit peaked in the first quarter of 2008 at 9.2 percent of GDP.
Table 1.3: Summary of South African Current Account Deficits as a Percentage of GDP from 2006-2009
Quarters
Year Quarter 1 Quarter 2 Quarter 3 Quarter 4
2006 -6.1 -5.7 -5.7 -7.8
2007 -6.9 -6.5 -8.7 -7.2
2008 -9.2 -7.3 7.9 -5.4
2009 -6.7 -3.4 -3.1 -2.8
2010 -4.6 -2.5 -3
Source: Data Extracted from December SARB Quarterly Bulletins from 2006-2010 in Appendix A
The large South African current account deficits that can be seen in Table 1.3 form the basis of this study. In the event of a country running a high current account deficit, an investigation into this deficit needs to be conducted. This investigation should cover topics such as the financing of the current account deficit and the sustainability of that deficit. In the context of
22
this paper, the sustainability of a current account deficit can be thought of as a maintainable-that is sustainable-current account deficit. It can be considered as maintainable due to the fact that such a deficit does not spiral out of control, and can be financed with a relative amount of ease. These two topics are imperative for a country to consider.
A current account deficit is considered to be overly high should it reach over 5 percent of GDP. This is confirmed by Milesi-Ferretti and Razin (1996, p.65) who state that any current account deficit above 5 percent of GDP should raise concern, and thus action should be taken to reduce this deficit. Evidently, South Africa has been above this limit from Q1 in 2006 until Q1 in 2009. Milesi-Ferretti and Razin (1996, p.65) further hold the threshold at 5 percent, based on research done on a number of countries, using economic data produced. The 5 percent figure is merely an average figure, as some first world countries can manage a current account deficit larger than 5 percent (USA, Australia, Israel), whilst other third -world
countries cannot manage such a deficit (Thailand, Indonesia). Milesi-Ferreti and Razin(1996, pg 65) state that the 5 percent benchmark is merely an informative indicator of sustainability. They further conclude that each current account deficit should be examined with the
following in order to determine the level of sustainability:
• Exchange Rate policy • Degree of openness
• Level of Saving and Investment • Financial system stability
A sustainable high current account deficit can be interpreted more precisely as meaning that if a country borrows a lot of capital, it needs to be able to make interest and principal
23
default), and that it can meet both its present and future obligations. This is worrying considering that South Africa’s current account deficit has been hovering around the 7.0 percent mark from Q3 in 2007 to Q3 in 2008, and reached a peak of 9.2 percent in Q1 in 2008 according to data produced by the South African Reserve Bank, which can be seen in Table 1. 3.
Prior to 2006, its current account deficit was considerably lower, as confirmed in Table 1.4 (below). This is extremely relevant when contrasted to Table 1.3, in which the current
account deficits (as a percentage of GDP) were recorded as high as 9.2 percent. This is highly relevant as such a deficit needs to be financed and, in the South African context, the main way in which such a deficit is financed was, and still is, through short-term portfolio inflows, as confirmed in Table 1.7.Such inflows are variable and fickle, and thus have the highest possibility of turning into an outflow.
Table 1.4 Current Account Deficits as a Percentage of GDP adjusted yearly
Year Current account deficit/ G.D.P
2000 0.34 percent 2001 0.167 percent 2002 0.28 percent 2003 0.88 percent 2004 3.36 percent 2005 3.80 percent
Source: Data Extracted from December Quarterly bulletins in Appendix A
Table 1.4 (above) shows that prior to 2006, the current account deficit was low and thus does not form part of this study. It does however serve the purpose of confirming that the years
24
2006-2010 are imperative to be examined, and shall be the years from which data shall be extracted.
3.2 Average Current Account Deficits – South Africa
Table 1.4 (below) shows the yearly current account deficits from 2006 until 2010. Table 1.3 also then takes an average of the yearly figures to give an indication of the extent of the current account deficit.
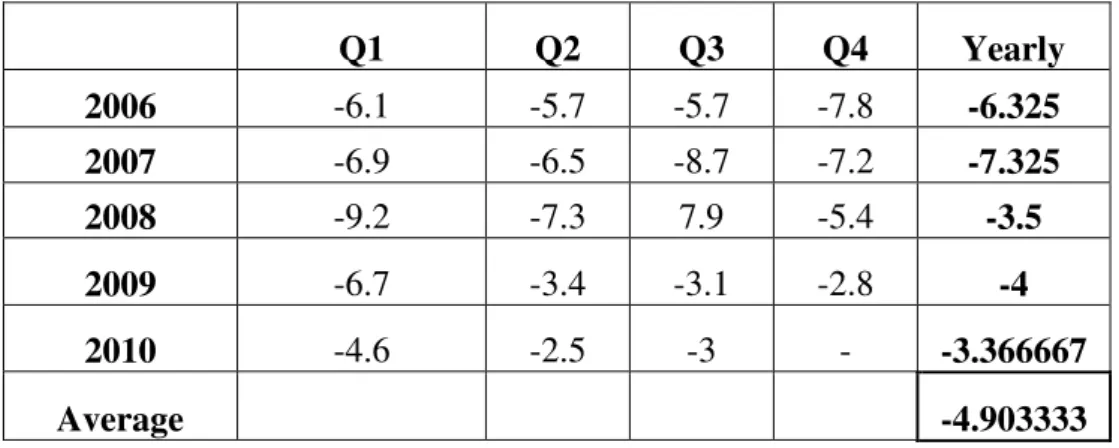
Table 1.5 Average South African Current Account Deficit as a Percentage of GDP
Q1 Q2 Q3 Q4 Yearly 2006 -6.1 -5.7 -5.7 -7.8 -6.325 2007 -6.9 -6.5 -8.7 -7.2 -7.325 2008 -9.2 -7.3 7.9 -5.4 -3.5 2009 -6.7 -3.4 -3.1 -2.8 -4 2010 -4.6 -2.5 -3 - -3.366667 Average -4.903333
Source: Data Extracted from Quarterly bulletins in Appendix A
Table 1.5 (above) confirms that from 2006-2010, the average current account deficit was approximately 5 percent. This figure shows the high current account deficit that South Africa has been running and the danger can thus be seen. This further shows that South Africa has been running a current account deficit at the threshold of what is considered dangerous as confirmed by Milesi-Ferreti and Razin (1996, p.65).
25 3.3 Capital Inflows into South Africa
South Africa has experienced high portfolio investments in the last decade. After the advent of constitutional democracy in April 1994, South Africa experienced a net inflow of capital for the first time in approximately ten years (Mohammed, 2007, p.4).
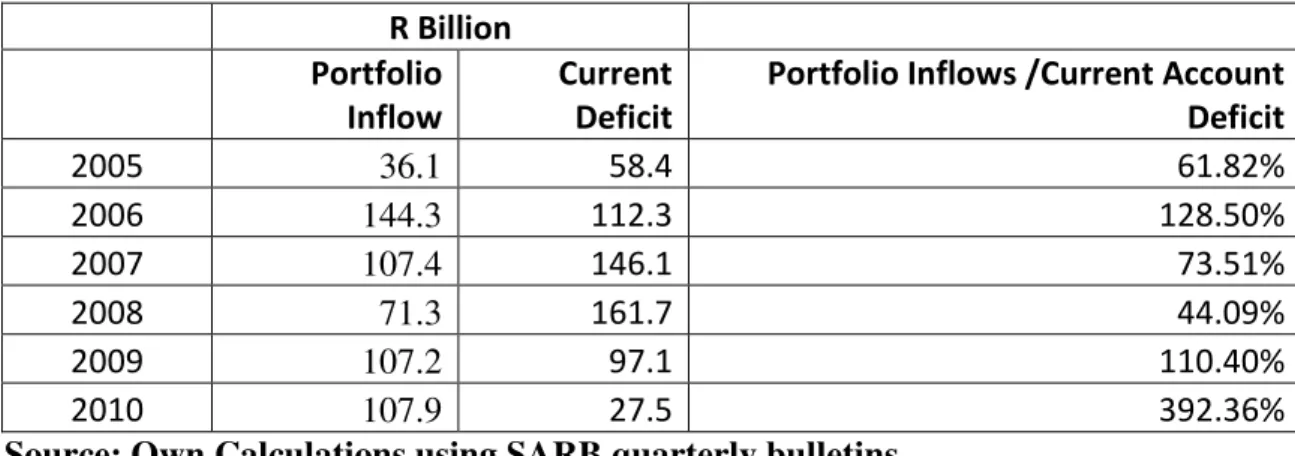
In the table below (1.a), one can see that the amount of portfolio inflows from 2005 to 2010 did not drop below 44 percent and in some cases exceeded the actual deficit.
Table 1.6 Portfolio Inflows and Current Account Deficits
R Billion Portfolio Inflow Current Deficit
Portfolio Inflows /Current Account Deficit 2005 36.1 58.4 61.82% 2006 144.3 112.3 128.50% 2007 107.4 146.1 73.51% 2008 71.3 161.7 44.09% 2009 107.2 97.1 110.40% 2010 107.9 27.5 392.36%
Source: Own Calculations using SARB quarterly bulletins
Despite this, inflows were relatively low, when contrasted to similar developing economies2, due to the temperamental political situation in South Africa during the establishment of the newly democratic republic. Foreign investors still had concerns regarding the change in government, and thus figures remained low. Nevertheless, South Africa recorded high figures during its economic boom period beginning in 2005. Such inflows were crucial in financing
2 Chile had a cumulative inflow/GDP of 25.8 percent between 1989 and 1994, Malaysia had a cumulative inflow/GDP of 45.8 percent between 1989 and 1994, Hungary had a cumulative inflow/GDP of 41.3 percent between 1993 and 1994 (Calvo & Reinhart, 2000,pg 5)
26
its high current account deficits as well as promoting strong economic growth over the same period. Figure 1.3 (below) shows South Africa’s portfolio inflows as a percentage of GDP.
Figure 1.3 Portfolio inflows as a Percentage of GDP into South Africa
Source: Data Extracted from Quarterly Bulletins to be found in Appendix B and in particular Figures Q and T
Figure 1.3(above) shows the quantities of portfolio inflows into South Africa from 1998 through till 2010. It is important to note that one can see the large spike in portfolio inflows followed by a rapid decrease
Figure 1.3 thus further confirms the variability of portfolio inflows. There was a sharp reversal in portfolio investments in South Africa in 2007 and 2008 during the recent credit crisis. South Africa, despite experiencing negative portfolio flows in 2008, has recovered remarkably in terms of portfolio figures. Figure 1.3 (above) shows this clearly. After the 2008
-4 -2 0 2 4 6 8 10 1996 1998 2000 2002 2004 2006 2008 2010 P o rt fo li o I n fl o w a s a % o f G D P Year
South Africa
27
crash, an upward sloping curve of portfolio inflows is evident. This can been further
confirmed by the fact that the JSE/FTSE all share price index had an index value of 31 298 in November 2010. One can compare this to its all time high of 33 233 in May 2008 prior to the Credit Crisis. Seria (2010) confirms this upward sloping curve of inflows by stating that South Africa is currently (as of October 2010) at risk of a positive surge in capital inflows.
Table 1.6 (below) along with figure 1.4 (below) supplements Figure 1.3 (above) in that it shows the proportion of portfolio investments as compared to foreign direct investments and other investments. This illustrates that inflows are dominated by short-term and variable inflows, thus creating potentially unsustainable means to finance this current account deficit.
Table 1.7 Proportions of Capital Inflows into South Africa
Year Portfolio Investments/Total Capital Inflows Other Investments/Total Capital Inflows Direct Investments/Total Capital Inflows 2005 35.08 26.14 38.78 2006 70.42 31.33 -1.76 2007 52.16 28.31 19.52 2008 -141.30 94.27 147.04 2009 95.20 -35.52 40.32 2010 85.98 10.60 3.43
28 Figure 1.4: Capital Inflows into South Africa
(Source: Mohammed, 2007, p.12)
Figure 1.4 (above) uses data from Table 1.6 to show that portfolio inflows have vastly out-numbered direct inflows and other investments into South Africa.. Resnick & Eun (2009, p.66) clarify other investments as including all other transactions such as bank deposits, trade credits, currency transactions etc. As previously mentioned, the composition and amounts of inflows into a country are crucial. The high number of portfolio inflows (Table 1.7 below) into South Africa is an indication that the financing of the high current account deficit (over 5 percent) is a cause for concern.
-200 -150 -100 -50 0 50 100 150 200 250 300 2005 2006 2007 2008 2009 2010 Direct Investments/Total Capital Inflows Other Investments/Total Capital Inflows Portfolio Investments/Total Capital Inflows
29
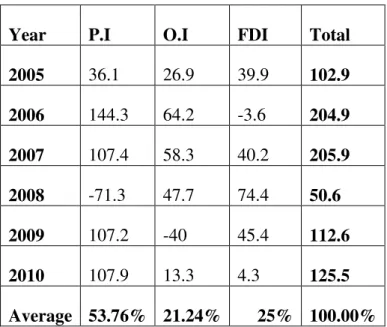
Table 1.8 Inflows and Total Capital inflows (R Billion)
Year P.I O.I FDI Total
2005 36.1 26.9 39.9 102.9 2006 144.3 64.2 -3.6 204.9 2007 107.4 58.3 40.2 205.9 2008 -71.3 47.7 74.4 50.6 2009 107.2 -40 45.4 112.6 2010 107.9 13.3 4.3 125.5 Average 53.76% 21.24% 25% 100.00%
Source: Own Calculations using SARB quarterly bulletins
Table 1.7 (above) shows the average capital inflows into South Africa. As can be seen, from 2006 to 2010, portfolio inflows as a percentage of total capital inflows reached 53.76 percent. This is more than double both other investments and direct investments. This shows the dominance of portfolio inflows into South Africa.
In order to make an adequate comparison with Argentina, it is imperative to investigate the Argentine figures as done with South Africa.
3.4 Current Account Deficits in Argentina
Argentina, like South Africa, has been running persistent current account deficits from 1990 until 2001 (Pescoe, p.101). Argentina recorded a current account surplus in 2002, the first time in over a decade. Such figures can be seen in Table 1.8 (below).
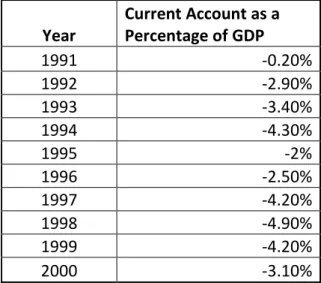
30 Table 1.9 Argentina Current account Deficit
Year Current Account as a Percentage of GDP 1991 -0.20% 1992 -2.90% 1993 -3.40% 1994 -4.30% 1995 -2% 1996 -2.50% 1997 -4.20% 1998 -4.90% 1999 -4.20% 2000 -3.10% Source: IMF (2004)
Table 1.8 (above) shows these current account deficits clearly. Argentina’s current account deficit peaked around 1998, with its figure reaching 4.9 percent. Although the current account deficit may not appear to be a danger due to it not being overly high, it still was a factor which assisted in derailing the Argentine economy during the 90’s.
The higher the current account deficit increased the risk on being reliant on reversible capital inflows as well as enhancing the adverse effects of an accumulation of short term debt creating speculative attacks on the Peso (Bustelo, 2004, p.5).
The reason behind Argentina’s large increase in the current account deficit from 1995 to 1998 was due to a widening trade deficit (Bustelo, 2004, p.14), a currency real appreciation (fall in the terms of trade and a worsening of the investment income account (Bustelo, 2004, p.21). These figures are important to note for a comparison -with the South African figures. .
31 3.5 Average Current Account Deficit - Argentina
By using data, obtained from Table 1.8 (above), one can compute that the average current account deficit from 1993 to 2000 in Argentina was recorded as 3.58 percent of GDP. This allows us to make a comparison with South Africa. The figure 3.58 percent of GDP is substantial, however this number indicates that the current account deficit did not spiral out of control.
These deficits are relatively low compared to South Africa’s peak in Q1 of 2008, of 9.2 percent, along with its average of 4.9 percent of GDP during the sample period.
3.6 Capital Inflows into Argentina
Argentina experienced a sudden stop of capital inflow in the last two decades on two
occasions, during the Tequila Crisis of 1995 and the Russian/Asian crisis of 1998. Both these crises are important to consider, as they both resulted in a demise of capital inflows into Argentina.
The Mexican Tequila Crisis is explained by academics as having been caused by fiscal debts and high current account deficits that were not sustainable (Calvo, 1998, p.1). The latter is an important argument of this report, due to its examination of the connection between capital inflows and the current account. Calvo (1998, p.35) further states that the Mexican current account deficit reached 8 percent in 1994, and was expected to reach 9 percent in 1995. Mexico’s Tequila Crisis caused a decrease in capital inflows into Central and South America, which consequently affected Argentina through a decrease in capital inflows and investments, thereby causing a recession. (Hausmann & Velasco, 2002, p.4). The recession in Argentina was caused, in short, by three factors namely the incompatibility between the fixed exchange rate and the fiscal policies; the sudden stop of capital inflows; and lastly the exchange rate
32
regime. The recession caused the Argentine Peso to depreciate by 350 percent in the first 9 months of the recession, unemployment reached 25.9 percent, GDP declined by 4.4 percent in 2001 and a further 11 percent in 2002 (Bustelo, 2004, p.9).
Argentina’s economy suffered another major collapse in the beginning of 1998, coinciding with the Russian/Asian Crisis of 1998 (Calvo and Talvi, 2005, p.1). The Russian/Asian Crisis of 1998 was caused by a large decrease in commodity prices, which adversely affected East-Asian countries, such as Thailand, Indonesia, South Korea, Malaysia and Philippines (Schmidt, 2009). The Russian currency collapsed-due to market pressure to increase its exchange rate- thereby forcing the Kremlin to default on both public and private debt (Chiodo and Owyang, 2002) This affected Argentina through a decrease in investments from East Asia, which eventually crippled its economy to the extent that its payment system came to a halt (Calvo and Talvi, 2005, p.1). These sudden decreases in capital inflows succeeded periods of high capital inflows into Latin America. Frankel & Okongwu (1995, p.1) confirm this by stating that beginning in 1990, a large amount of capital inflows, in particular
portfolio inflows, poured into Latin America.
The above periods of large capital inflows were followed by periods of low inflows, having an adverse effect on the Argentine economy. Whilst the capital inflows into Argentina stimulated economic growth, it also reinforced negative trends such as increasing
consumption and imports. Calvo and Talvi (2005, p.25) state that the Argentine recession in 2000 was caused in part by the large devaluation of the Argentine Peso as a result of the sudden stop of capital inflows during the Russian/Asian crisis of 1998.
Thus, when these inflows halted, austerity measures became necessary, harming both the economy and its people through an increase in taxes and a reduction in government spending
33
thus slowing down the economy. These peaks and troughs can be clearly seen in Figure 1.5 below.
Figure 1.5 Capital Flows to LAC-7 countries
(Source: Calvo and Talvi, 2005, p.6).
Figure 1.5 confirms the fact that Argentina experienced a sudden and large decrease of
capital inflow. In July 1994 and April 1998, Argentina entered into periods of minimal capital inflows, which severely dented and damaged its economy. This is effectively illustrated below in Figure 1.5, which shows that during the Mexican Tequila Crisis, capital inflows dropped by approximately 60 percent from the latter stages of 1993 until early 1995.
Capital inflows into LAC-73 countries again fell drastically from 5.5percent of GDP in Q2 of 1998 to 1.9 percent of GDP in Q2 of 1999 (Calvo and Talvi, 2005, p.7). This drastic fall in
3
34
capital inflows was largely due to short term flows which were withdrawn quickly and in large quantities. Calvo and Talvi (2005, p.7) states that roughly 80 percent of capital inflows were of a short term nature. The reverse in capital inflows during the above Crises can be clearly seen above in Figure 1.5.
Once capital inflows decrease, or turn from an inflow into an outflow, so too does output. The reason for this is that a dry up of available funds can decrease potential projects, thus further decreasing output and growth. Moreover, a decrease in government spending may also lead to a decrease in GDP. It is clearly evident that Argentina experienced this in 1998 and 2002, once there was a reversal in capital inflows. The Figure below illustrates the corresponding decreases in flows and output.
Figure 1.6 Correlation between Capital flows and Gross Output in Argentina
35
Argentina’s GDP decreased, as capital inflows turned into outflows, confirmed in Figure 1.6 (above). As capital inflows became outflows, GDP decreased. Accordingly, during the Tequila crisis of 1995, Argentina’s GDP decreased by approximately 4 percent, as well as a further decrease of roughly 17 percent during the Russian crisis of 1998. During Argentina’s periods of high capital inflow (namely 1991-1997), GDP increased by an average figure of 6.1 percent per year.
Such figures are important as they indicate that short term capital inflows are potentially unsustainable in the sense that they can change into an outflow in a short period of time, which can thus have a negative effect on GDP and on the economy in general. But the effect of the inflow was positive, therefore the question arises whether or not the negative effect of capital inflows can be outweighed by any positive consequences that can be brought about by capital inflows. Despite the fact that capital inflows bring about an increase in GDP, if not used productively, capital inflows can be extremely harmful to an economy, should they be reversed. Thus, capital inflows in the long term are generally stable and productive for an economy as such inflows provide an inflow into a country for a number of years and cannot be reversed suddenly. However, short term capital inflows will have a negative effect should they be reversed suddenly and in large quantities.
36
Table 1.10 Capital Inflows into Argentina from 1992-1998
Type of Flow 1992 1993 1994 1995 1996 1997 1998 1992-1998 Inflows as a percent of Total Capital Inflows FDI 4.3 2.7 3.6 5.6 6.9 9.1 7.2 39.8 29.2217 PI 2.9 35.2 9.8 4.7 12 11.6 10.7 87.2 64.0235 Equity 1.1 4.9 3.1 1.1 1.4 1.4 -0.2 12.5 9.17768 Debt 1.7 30.3 6.7 3.6 10.2 10.2 10.9 74.4 54.6256 OI 1.8 -18.8 3.5 7.1 8.2 8.2 5.3 9.2 6.75477 Total 9.2 19.2 17 17.5 29.1 29.1 23.3 136.2 100 Source: (Bustelo, 2004, p.17) 4
Table 1.9 (above) shows the various types and quantities of capital inflows into Argentina over crucial periods. As can be seen in Table 1.9, from 1992 until 1998, portfolio inflows accounted for roughly 64 percent of capital inflows into Argentina. This extremely large proportion of portfolio inflows in relation to total capital inflows was one of many factors that led to the Crises experienced by Argentina. Such a large number of portfolio inflows (especially as a percentage of total inflows) shows the volatility in the type and quantity of capital inflows, as well as increasing the chance of a sudden withdrawal of large amounts of capital inflows. The probability of withdrawal however, should in principle be independent of the size of the flows. Higher inflows do indicate a higher exposure to sudden stops. But, there could be a higher probability of a small inflow turning into an outflow, and a lower
probability of a large inflow turning into an outflow.
4
37
Figure 1.7 Portfolio inflows as a Percentage of GDP into Argentina
Source: Data extracted from Table 1.6 by taking Portfolio Inflows over GDP
Figure 1.7 shows the variability in portfolio investments. The inconsistency in the slope of the graph can clearly be seen, as it increases and decreases numerous times. Particularly, in 1992 and 1993, portfolio investments soared, and then suddenly crashed in 1994, correlating with the Tequila Crisis of 1995. The above aids in confirming the crucial point, that financing a current account deficit through portfolio inflows is dangerous, due to the instability of such flows. One can also see that portfolio inflows peaked at 14 percent of GDP in 1993. This figure is extremely large when compared to South Africa’s peak.
3.7 Comparative Analysis
The comparative analysis between South Africa and Argentina can now thus take place. It is thus worthwhile to note the following:
0 5 10 15 20 25 30 35 40 1991 1992 1993 1994 1995 1996 1997 1998 1999 P o rt fo li o I n fl o w s ($ b il li o n ) Year
Argentina
38
• Argentina’s recession of 2000 was not sudden. Argentina was on a slow path to its crisis as was predicted by economists and financial experts (Bustelo, 2004, p.19). Two prior indicators of the Argentine Crisis include both the crises in 1994 and 1998, which had a far worse effect on Argentina than other Latin American countries. This is largely due to the fact that Argentina experienced large capital inflows, had pegged the Peso to the Dollar, and adopted a restrictive monetary policy, amongst other factors.
• South Africa hit a mild yet sudden crisis in 2008 albeit recovering strongly towards the latter of 20095. South Africa’s crisis correlated with a world financial crisis, of which some say was the worst crisis since the great depression.
• South Africa appears to be treading a fine line with a high amount of short term capital inflows which have reinforced negative trends.
• Portfolio inflows are volatile and variable, and are thus problematic if they reinforce negative trends in a country
5
Confirmed by the fact that the JSE/FTSE all share price index had an index value of 31 298 in November 2010. One can compare this to its all time high of 33 233 in May 2008 prior to the credit crisis of 2008.
39
It is thus worthwhile to note the following table of comparisons:
Table 1.11 Comparisons between South Africa and Argentina
Comparative Analysis
South Africa Argentina
Average Current Account
Deficit 4.9 % of GDP 3.58% of GDP
Peak Current Account Deficit 9.2% of GDP 4.9% of GDP Portfolio Inflows/GDP - peak 8% of GDP 14% of GDP Portfolio Inflows/Capital
Inflows 53.75% 65%
dominance of port flows
Absorbing capital inflows Negative manner-increase in consumption, imports, capital flight and rising share prices Capital Inflows and GDP
Positive correlation- As capital inflows increase so does GDP and the reverse holds true.
4.1 Consequences of High Portfolio Inflows
4.2 Sudden Stops
A sudden stop of capital inflows can be thought of as a sudden stop in net inflows. A sudden stop is thus generally associated with short term capital flows. Calvo and Reinhart (2000, p.3) state that a sudden dry up of capital flows must be met by reserve losses and a lower current account deficit.
A sudden stop of capital inflow will make it necessary for the country in which the sudden stop occurred to take action to alleviate the adverse effects that are brought about by a sudden stop. It is likely that the country’s currency will be deprecated in order to boost exports and thus further boost GDP. In addition, initially GDP will most likely decrease due to lower amounts of credit and thus less overall consumer spending.
40
Sula (2006, p.21) explains that a surge in capital flows into a country is an indicator that a country could experience a sudden stop due to the direct effect of large capital inflows not being warranted by the economic fundamentals, thus casing the need for these inflows to be adjusted downwards (Sula, 2006, p.4). It is further stated that the effects of a sudden stop will be greatly enhanced if the country is running a large current account deficit with a high number of portfolio inflows. Sula (2006, p.21) also clarifies that the type of capital flows coming into a country are important, as portfolio inflows and loans increase the likelihood of a sudden stop, whilst FDI will not increase this likelihood, as elaborated on later under the ‘Advantages of FDI section’. FDI is a long term investment, in which an investor cannot quickly withdraw funds, thus providing a stable means of inflow. Portfolio inflows, on the other hand, provide a short term inflow which can be extremely variable. This is highly relevant, as in the past (specifically 2006, 2007, 2008), South Africa has run a large current account deficit with figures reaching a peak of 9.2percent, in Q1 of 1998 confirmed in Table 1.3. South Africa has financed this deficit largely through portfolio inflows. . Therefore the possibility that South Africa could face a sudden stop crisis is substantial, and this sudden stop would have adverse effects on the economy, as discussed previously.
The rationale behind the connection between capital inflows and sudden stops can be explained in the manner below:
1. A surge in capital inflows increases the likelihood of a sudden stop (Milesi-Ferretti and Razin, 1996, p.26 and: Sula, 2006, p.4). This is true due to large amounts of inflows potentially causing a deterioration of the economic fundamentals of the recipient country if the inflow of capital is not being used productively.
41
2. Large amounts of inflows can inflate asset prices far beyond their true value, creating asset price bubbles (Milesi-Ferretti and Razin, 1996, p.26 and Sula, 2006, p.4). Over time, these bubbles pop, wreaking havoc on an economy which then has to readjust to lower asset prices Large inflows can also cause an appreciation of a currency, if it is floating, which may call for an intervention by government to keep the exchange rate constant thus adversely affect on an economy. An appreciation of a currency can hurt exports as the goods exported become more expensive.
3. If a rapid increase in capital inflows is not warranted by the economic fundamentals of a country, then limits on inflows may eventually have to be set at maintainable levels. This is particularly true when a country’s economic fundamentals do not anticipate large and sudden capital inflows. It has therefore been illustrated that large amounts of capital inflows can be harmful to an economy.
(Source: Sula, 2006, p.4)
4.3 Outcomes of a Sudden Stop
Calvo and Talvi (2005, p.14-16) note that an economy will face certain consequences following a sudden stop of capital inflows. Such consequences include a decline in GDP growth, confirmed in Figure 1.6; a decrease in investment and consumption due to instability concerns over the economy; a drop in asset prices and currency value; as well as an increase in interest rates in order to attract more foreign investment, which could be in the form of portfolio inflows
42 5.1 Solutions to Sudden Stops
5.2 Foreign Direct Investments (FDI)
As mentioned above under the ‘Capital Accounts section’, another possible way of financing a deficit is through foreign investment. FDI is the best solution to the problems that South Africa is facing. The main reason behind it, is that through FDI, a country acquires long term – and thus more stable - capital inflows.
FDI can be split up into 2 categories:
1. Mergers and acquisitions 2. Greenfields Investment
To gain a better understanding of these concepts, an example can be considered: a British bank is interested in buying a stake in a South African bank. This is an example of FDI, in the form of M&A, as this British bank will now have interests in South Africa, and the
performance of the South African economy. Furthermore, this is an example of an
acquisition. Another example could include the process of a foreign enterprise building a new operation in a foreign location from the ground up, describing a Greenfield investment. The benefits accrued through Mergers and Acquisitions (M&A’s) are generally lower when compared to those of a Greenfield investment (Mwilima, 2003, p.31).
The reason M&A’s are less beneficial than Greenfield investments are due to the following factors:
1. M &A’s does not promote immediate employment.
2. M &A’s promote anti-competitiveness by using international skills and resources to lower costs to out-price local companies.
43
3. M&A’s are less likely to transfer new technology and skills, compared to Greenfield investment
(Source: Mwilima, 2003, p.31).
5.3 FDI: Good or Bad
Ahlquist (2006, p.684) states that FDI is a means for a developing country to increase its economic growth and thus improve the welfare of its citizens. However, Ahlquist (2006, p.684) then goes on to state that FDI is another way in which richer countries take advantage of emerging markets. This leads us to now ask the question whether or not FDI is actually desired by developing countries, and whether or not it is beneficial to such countries.
5.4 The Advantages of FDI
Rappaport (2000) explains that FDI boosts the productivity of all firms in the recipient country, and not only those firms who are receiving the capital. The rationale behind this can be seen as a trickle-down effect. If certain sectors are generating large revenues, such
revenue, as a result, will boost other sectors to a lesser extent. This can be understood from the perspective of a firm that has more money to spend. Due to higher revenues or profits, a company will spend proportionally more, whether for expansion or general purposes. This effect will thus boost the firms that have not received any direct foreign capital, as the now richer firms spend more. Jenkins & Thomas (2002, p.13) confirm this by pointing out that by creating one job through FDI, a further 1.6 other jobs are also created in developing
44
Mwilima (2003, p.32) states that the attractiveness of an FDI inflow means that governments have given it much attention, especially in Africa. FDI has received such attention due to it generally being considered a long term stable investment, and thus an important means in financing a current account deficit. Mwilima (2003, p.31) confirms this by stating that FDI is a major stimulus to economic growth. Jenkins & Thomas (2002, p.11) further verify this by claiming that long term capital flows are more desirable and stable when contrasted to shorter term flows. FDI facilitates the transfer of new technology, improves local skills and, -
improves market access (Ahmed, Arezki & Funke, 2005, p.4).
5.5 The Disadvantages of FDI
Resnick and Eun (2009, p.65) state that there are certain political issues associated with FDI, especially with mergers and acquisitions.
After giving the advantages of FDI, Mwilima (2003, p.41) then describes the negative aspects of FDI:
1. FDI can have a negative impact on the level of competition in the domestic market. MNC’s have vast amounts of experience, capital, skills and knowledge, support services, and contacts, and can thus use these factors to drive out local production by offering cheaper products.
2. FDI can adversely affect the balance of payments if imports exceed exports. The trade deficit as a result of these high imports hinders developing countries thus causing FDI to affect the trade balance negatively. - But high exports are good for the trade surplus.
45
3. Large inflows of capital can increase the susceptibility of the economy to experience a crisis. Profits made from FDI investments can be taken out of the country as easily as a portfolio inflow, thus contributing to the reversal of capital inflows
5.6 FDI in South Africa
Over the last 25 years, South Africa has not attracted much foreign direct investment, especially when considering other emerging markets similar to South Africa such as Korea, Brazil, Tunisia and Poland (Arvanitis, 2006, p.64).
Arvanitis (2006, p.65) asserts the following:
1. From 1980 until 1993, FDI inflows into South Africa amounted to approximately $0.3 billion. However, that was still under the Apartheid regime and during a time of trade barriers and economic sanctions.
2. After 1993, and the downfall of the Apartheid regime in South Africa, FDI increased largely due to the liberalisation of the South African economy. Despite this increase, FDI still remained relatively low, in comparison to other emerging markets, at 1.3 percent of GDP for the period of 1994-2002. Other emerging economies, such as Korea, Poland and Tunisia have FDI flows as a percentage of GDP of between 2 percent and 5 percent, with China having FDI as a percentage of GDP at 3.8 percent from 1999 to 2002.
3. Arvanitis (2006, p.73) further points out that due to South Africa’s low marginal propensity to save, FDI is critical to enhance growth and economic activity.
46
FDI is an important feature of the South African economy. The current government has placed a great deal of emphasis on increasing the quantity of FDI. In order to increase FDI inflows, the South African government has committed to an unwavering and unfaltering conventional macro-economic policy (Mohamed, 2003, p.2). Such an unwavering and
unfaltering policy is based on the Washington Consensus. The Washington Consensus is a set of economic policies designed for developing countries, such as South Africa and Argentina. The idea behind such a consensus was intended for developing economies to adhere to, in order to stimulate growth and economic stability. The South African government has followed some, but not all, of these of rules and regulations (Mohamed, 2003, p.2). South Africa has followed conservative macroeconomic policies thus adhering to that aspect of the Washington Consensus; however the government of South Africa has not placed any of the limitations on capital inflows that the Washington consensus insists upon. (Mohamed, 2003, p.2).
5.7 Conclusion
It is clear that portfolio inflows are not a stable means to rely on when financing a current account deficit. A country is able to finance its current account deficit by using portfolio inflows; however it must not be heavily reliant on such inflows. It is clear from the Argentine experience that a country cannot be too reliant on portfolio inflows due to their variability and the ease with which they can turn from an inflow into an outflow. Large portfolio inflows can also lead to a greater likelihood of a sudden stop, which can devastate an economy. The reason for this is simple: Portfolio inflows are variable, therefore the larger the amount of portfolio inflows that are invested into a country by foreigners, the larger the amount of such inflows that can be converted into an outflow, and thus withdrawn from that country.
Developing countries, in particular, face such risks. At the slightest hint of instability, inflows can be withdrawn, thus having a deleterious effect on the economy. This has led to the idea of
47
attracting FDI flows as a stable means for economic growth and stability. Seria (2010) confirms this, with economists, where they state that there should be a shift to trying to receive foreign direct investment as opposed to portfolio inflows. It is clear that FDI is far more reliable and stable than portfolio inflows, thus governments should endeavour to attract such flows, rather than volatile and unstable portfolio inflows.
South Africa is treading a fine line. It is similar to Argentina in some ways, yet naturally has its differences. South Africa’s current account deficit was extremely high (with an average 4.9 percent of GDP from 2006-2010), with high portfolio inflows that account for 54 percent of all capital inflows. Argentina had an abnormal amount of portfolio inflows coupled with a current account deficit.
It is therefore, through this research, that a picture is painted with caution. South Africa has strong fundamental economic principles which became evident in the 2007 Credit Crisis; however its reliance on portfolio inflows to stimulate economic growth and to cover the current account deficit along with low FDI figures is alarming.
48
6.1 Appendices
Appendix A:
Figure A: Current Account Balance, December 2010
49
Figure B: Current Account Balance, December 2009
Source: (SARB 2009, pg.25)
Figure C: Current Account Balance, December 2008
50
Figure D: Current Account Balance, December 2007
Source: (SARB 2007, pg.23)
Figure E: Current Account Balance, December 2006
51
Figure F: Current Account Balance, December 2005
Source: (SARB 2005, pg.21)
Figure G: Current Account Balance, December 2004
52
Figure H: Current Account Balance, December 2003
Source: (SARB 2006, pg.21)
Figure I: Current Account Balance, December 2002
Source: (SARB 2006, pg.24)
53 Source: (SARB 2006, pg.22)
Figure K: Current Account Balance, December 2000
Source: (SARB 2006, p.20)
54
Figure L: Inflows into South Africa in 2010 and 2011
Source: SARB (2011, p.26)
Figure M: Inflows into South Africa in 2009 and 2010
55
Figure N: Inflows into South Africa in 2008 and 2009
Source: SARB (2009, p.28)
Figure O: Inflows into South Africa in 2007 and 2008
Source: SARB (2008, p.24)
56 Source: SARB (2007, p.27)
Figure Q: Inflows into South Africa in 2006 and 2007
57 Appendix C
Figure R: South African GDP Figures From 1998-2009 in South African Rands
Year GDP(R million) 1998 742 424 1999 813 684 2000 922 147 2001 1 020 008 2002 1 171 085 2003 1 272 537 2004 1 415 273 2005 1 571 082 2006 1 767 422 2007 2 017 102 2008 2 283 822 2009 2 407 689 http://www.indexmundi.com/g/g.aspx?v=65&c=sf&l=en
58
6.2 References
Ahlquist J.S (2006) “Economic Policy, Institutions, and Capital Flows: Portfolio and Direct Investment Flows in Developing Countries”, Published in International Studies Quarterly (2006) 50, 681–704, University of Washington
Ahmed, F, Arezki, R & Funke, N (2005) “The Composition of Capital Flows: Is South Africa Different?” (online paper) URL: http://ideas.repec.org/p/imf/imfwpa/05-40.html
Arvanitis, A (2006), “Foreign Direct Investment in South Africa: Why has it been so low?” (online paper) URL:
http://www.imf.org/external/pubs/nft/2006/soafrica/eng/pasoafr/sach5.pdf.
Balchin, N (2009), “Narrowing South Africa's Current Account Deficit: A bridge too far or is there hope?” (online paper) URL:
http://www.mthente.co.za/excellence-in-africa/narrowing-south-africas-current-account-deficit-a-bridge-too-far-or-is-there-hope
Bustelo, P (2004) “Capital flows and financial crises: A comparative Analysis of East Asia and Argentina” (online paper) URL: http://eprints.ucm.es/6841/1/0417.pdf. Working Paper No.2004-017
59
Calvo, G.A (1998) “Capital Flows and Capital Market Crises: The simple economics of Sudden Stops” (online paper) URL: http://www.ucema.edu.ar/pdf/calvo.pdf. Published in Journal of Applied Economics, Vol I, No.1 (Nov: 1998), 35-54
Calvo, G.A and Talvi E (2005) “Sudden stop, financial factors and economic collapse in Latin America: Learning from Argentina and Chile”, NBER Working Paper No. 11153
Calvo, G.A. and C. Reinhart (2000), When capital inflows come to a sudden stop: Consequences and policy options, in: P. Kenen and A. Swoboda, eds., Key issues in reform of the international monetary and financial system, IMF, Washington DC.
Chiodo A.J and. Owyang M.T (2002) “A Case Study of a Currency Crisis: The Russian Default of 1998” (online paper) URL:
http://research.stlouisfed.org/publications/review/02/11/ChiodoOwyang.pdf. The Federal Reserve Bank of St. Louis.
Dreper, P and Freytag, A (2009), “South Africa’s current account deficit: Are proposed cures worse than the disease?” Trade policy report No. 25, Published in South African Institute of International Affairs
60
Hausmann, R & Velasco A (2002) “The Argentine Collapse: Hard Money’s Soft Underbelly” (online paper) URL: www.claaf.org/documents/Haussmen-argentina4.doc
IMF (2004) “The IMF and Argentina, 1991-2001” Evaluation Report
Jenkins, C and Thomas, L (2002), “Foreign Direct investment in Southern Africa:
Determinants, characteristics and implications for economic growth and poverty alleviation” (online paper) URL: http://www.csae.ox.ac.uk/reports/pdfs/rep2002-02.pdf. CSAE CREFSA
Kim, S and Yang, D.Y (2008) “The impact of capital inflows on asset prices in emerging Asian economies: Is too much money chasing too little good?” (online paper) URL: http://www.adb.org/Documents/Papers/Regional-Economic-Integration/WP15-Impact-Capital-Inflows.pdf.
Lacoste, P (2005) “International capital flows in Argentina” (online paper) URL:
www.bis.org/publ/bppdf/bispap23e.pdf. BIS Papers No 23
Milesi-Ferretti, G and Razin, A (1996), “Current account sustainability” Princeton Studies in International Finance No.81. Princeton University Printing Services, New Jersey, (online paper) URL: http://www.princeton.edu/~ies/IES_Studies/S81.pdf.
Milesi-Ferretti, G and Razin, A (1996a), “Sustainability of persistent current account
61
Flows for Macroeconomic and Financial Policy conference, http://www.nber.org/papers/w5467.pdf?new_window=1.
Mohamed, S (2007), “The impact of international capital flows on the South African economy since the end of apartheid” (online paper) URL:
http://www.policyinnovations.org/ideas/policy_library/data/01386/_res/id=sa_File1/Mohame d_Capital_Flow.pdf
Mohamed, S (2003) “Capital Inflows Since the End of Apartheid and the 2001Currency Crisis” Prepared for the TIPS/DPRU Conference: The Challenge of Growth and Poverty: The South African Economy Since Democracy.
Mwilima, N (2003) “Foreign direct investment in Africa”, Social Observatory Pilot Project, Africa Labour Research Network, Labour Resource and Research Institute (LaRRI (online paper) URL:
http://www.sarpn.org.za/documents/d0000883/P994African_Social_Observatory_PilotProjec t_FDI.pdf.)
Pesce, M.A (2008) “Capital flows, economic performance and economic policy: Argentina’s experience during the last decade” (online paper) URL:
www.bis.org/publ/bppdf/bispap44e.pdf
Rappaport, J (2000), "How Does Openness to Capital Flows Affect Growth?", Research Division Federal Reserve Bank of Kansas City