Amendment history:
Corrigendum
(June 2017)
Ablation of PI3K blocks BCR-ABL
leukemogenesis in mice, and a dual PI3K/mTOR
inhibitor prevents expansion of human
BCR-ABL
+
leukemia cells
Michael G. Kharas, … , Kevan M. Shokat, David A. Fruman
J Clin Invest.
2008;
118(9)
:3038-3050.
https://doi.org/10.1172/JCI33337
.
Some cases of pre–B cell acute lymphoblastic leukemia (pre–B-ALL) are caused by the
Philadelphia (Ph) chromosome–encoded BCR-ABL oncogene, and these tend to have a
poor prognosis. Inhibitors of the PI3K/AKT pathway reduce BCR-ABL–mediated
transformation in vitro; however, the specific PI3K isoforms involved are poorly defined.
Using a murine model of Ph
+pre–B-ALL, we found that deletion of both
Pik3r1
and
Pik3r2
,
genes encoding class IA PI3K regulatory isoforms, severely impaired transformation.
BCR-ABL–dependent pre/pro-B cell lines could be established at low frequency from progenitors
that lacked these genes, but the cells were smaller, proliferated more slowly, and failed to
cause leukemia in vivo. These cell lines displayed nearly undetectable PI3K signaling
function and were resistant to the PI3K inhibitor wortmannin. However, they maintained
activation of mammalian target of rapamycin (mTOR) and were more sensitive to rapamycin.
Treatment with rapamycin caused feedback activation of AKT in WT cell lines but not
PI3K-deficient lines. A dual inhibitor of PI3K and mTOR, PI-103, was more effective than
rapamycin at suppressing proliferation of mouse pre–B-ALL and human CD19
+CD34
+Ph
+ALL leukemia cells treated with the ABL kinase inhibitor imatinib. Our findings provide
mechanistic insights into […]
Research Article
Hematology
Find the latest version:
Ablation of PI3K blocks BCR-ABL
leukemogenesis in mice, and a dual
PI3K/mTOR inhibitor prevents expansion
of human BCR-ABL
+
leukemia cells
Michael G. Kharas,1 Matthew R. Janes,1 Vanessa M. Scarfone,1 Michael B. Lilly,2
Zachary A. Knight,3 Kevan M. Shokat,3 and David A. Fruman1
1Department of Molecular Biology and Biochemistry, Center for Immunology, and 2Chao Family Comprehensive Cancer Center, University of California,
Irvine, Irvine, California, USA. 3Department of Cellular and Molecular Pharmacology, Howard Hughes Medical Institute,
University of California, San Francisco, San Francisco, California, USA.
Some cases of pre–B cell acute lymphoblastic leukemia (pre–B-ALL) are caused by the Philadelphia (Ph)
chro-mosome–encoded BCR-ABL oncogene, and these tend to have a poor prognosis. Inhibitors of the PI3K/AKT
pathway reduce BCR-ABL–mediated transformation in vitro; however, the specific PI3K isoforms involved are
poorly defined. Using a murine model of Ph
+pre–B-ALL, we found that deletion of both
Pik3r1
and
Pik3r2
,
genes encoding class IA PI3K regulatory isoforms, severely impaired transformation. BCR-ABL–dependent
pre/pro-B cell lines could be established at low frequency from progenitors that lacked these genes, but the
cells were smaller, proliferated more slowly, and failed to cause leukemia in vivo. These cell lines displayed
nearly undetectable PI3K signaling function and were resistant to the PI3K inhibitor wortmannin. However,
they maintained activation of mammalian target of rapamycin (mTOR) and were more sensitive to rapamycin.
Treatment with rapamycin caused feedback activation of AKT in WT cell lines but not PI3K-deficient lines.
A dual inhibitor of PI3K and mTOR, PI-103, was more effective than rapamycin at suppressing proliferation
of mouse pre–B-ALL and human CD19
+CD34
+Ph
+ALL leukemia cells treated with the ABL kinase inhibitor
imatinib. Our findings provide mechanistic insights into PI3K dependency in oncogenic networks and provide
a rationale for targeting class IA PI3K, alone or together with mTOR, in the treatment of Ph
+ALL.
Introduction
The BCR-ABL oncogene causes chronic myelogenous leukemia (CML) and a fraction of pre–B cell acute lymphoblastic leukemia (pre–B-ALL). The genetic lesion encoding the BCR-ABL fusion protein is a translocation, t(9;22), termed the Philadelphia chro-mosome (Ph) (1). The ABL kinase inhibitor imatinib mesylate produces stable remission for many patients with CML but is less effective in Ph+ ALL and myeloid or lymphoid blast crisis (BC)
phases of CML (2). Clinical resistance to imatinib has prompted investigators to seek novel compounds specific to downstream pathways that are essential for BCR-ABL–mediated cell prolifera-tion and survival (3).
One potential target is PI3K, a family of signaling enzymes of emerging interest for pharmaceutical development (4). PI3Ks are activated by BCR-ABL as well as extracellular signals to produce phosphatidylinositol-3,4,5-trisphosphate (PIP3). This lipid is a
second messenger that recruits and activates downstream effector proteins such as the serine/threonine kinase AKT (5, 6). Inhibit-ing the PI3K/AKT pathway reduces BCR-ABL transformation in human and murine myeloid colony-forming assays and murine
B lymphoid colony-forming assays (7–10). However, the specific PI3K isoforms or subgroups required for BCR-ABL transforma-tion and leukemogenesis are poorly defined.
Class IA PI3Ks, the predominant subgroup triggered by acti-vated tyrosine kinases such as BCR-ABL (5, 6), are composed of a catalytic subunit (p110α, p110β, or p110δ) and a tightly associ-ated regulatory subunit (p85α, p55α, p50α, p85β, or p55γ). The general functions of the regulatory subunits are to maintain the stability of catalytic subunits and direct the heterodimer to membrane-associated signaling complexes. Broad-spectrum inhibitors of PI3K catalytic subunits, such as LY294002 or wort-mannin, block BCR-ABL transformation, but the effects of tar-geting specific catalytic isoforms have not been reported (7, 9). Among regulatory isoforms, p85α appears to be essential for CML cell survival (8, 11). However, we found that targeted dele-tion of the mouse gene Pik3r1, encoding p85α as well as p55α
and p50α, caused only partial impairment of leukemic lymphoid colony formation (CFU–pre-B) and leukemogenesis (9). The transformed BM progenitor cells were sensitive to LY294002 and maintained comparable PI3K signaling output. These findings imply that other regulatory isoforms, namely p85β or p55γ, can compensate in this system (9).
To define more clearly the role of class IA PI3K and compen-satory pathways in BCR-ABL transformation of B cell progeni-tors, we used mice with combined deletion of Pik3r1 and Pik3r2
(encoding p85β) in the B lineage. Combined deletion of Pik3r1
and Pik3r2 caused reduced catalytic subunit expression and abro-Nonstandard abbreviations used: B-ALL, B cell acute lymphoblastic leukemia; BC,
blast crisis; CML, chronic myelogenous leukemia; L-CFC, leukemic colony-forming cell; LyBC, lymphoid BC; mTOR, mammalian target of rapamycin; mTORC1, mTOR complex–1; Ph, Philadelphia chromosome; PIP3, phosphatidylinositol-3,4,5-trisphos-phate; rS6, ribosomal protein S6; S6K, S6 kinase.
research article
gated AKT activation. BCR-ABL transformation of PI3K/AKT-deficient cells was severely impaired, and the few surviving clones showed reduced fitness in vitro and increased sensitivity to ima-tinib and failed to cause leukemia in vivo. We also identify mam-malian target of rapamycin (mTOR) signaling as a vital pathway that remains in cells that lack PI3K activity. A dual PI3K/mTOR inhibitor, PI-103, prevented “rebound” AKT activation caused by rapamycin and was more effective than rapamycin in synergiz-ing with imatinib to suppress survival. PI-103 also augmented the antileukemic effect of imatinib in vivo and reduced the clo-nogenicity of primary human Ph+ ALLCD19+CD34+ and
CML/ALL-BCCD19+CD34+ progenitors. These data suggest that combined
tar-geting of PI3K, mTOR, and BCR-ABL would provide an attractive therapeutic strategy in Ph+ leukemias.
Results
Decreased leukemic colony formation.We bred Pik3r1f/fPik3r2–/– (12, 13) with CD19-Cre mice to create mice that have Pik3r1 (p85α/ p55α/p50α) deleted specifically in the B cell lineage and Pik3r2
(p85β) deleted in all cells. We harvested BM from Pik3r1f/fPik3r2+/+,
Pik3r1f/fPik3r2–/–, Pik3r1Δ/ΔPik3r2+/+, and Pik3r1Δ/ΔPik3r2–/– mice and assessed transformation efficiency following infection with a retro-virus expressing the p190 isoform of BCR-ABL (p190), together with either GFP or human CD4 lacking the cytoplasmic tail (hCD4). For simplicity, we refer to the B lineage progenitors derived from these mice as WT, β-null, α-null, and α/β-null cells, respectively.
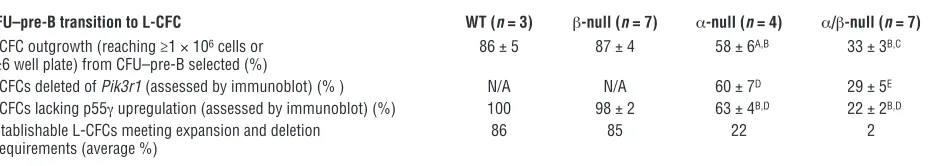
[image:3.585.48.529.82.383.2]β-null progenitors were equivalent to WT cells in the number of CFUs (CFU–pre-B; Figure 1A). In both α-null and α/β-null progenitors, we observed a significant decrease in transformation efficiency (~50%) relative to that in controls (Figure 1A). We con-sidered the possibility that deletion of Pik3r1 was incomplete and that cells that delete the floxed Pik3r1 allele have a competitive disadvantage. To test this, we selected single colonies (CFU–pre-B), monitored the expansion of these leukemic colony-forming cells (L-CFCs) in liquid culture, and assessed the deletion by immunob-lotting for p85 expression (Figure 1, B and C, and Table 1). Only 33% ± 3% (n = 7 experiments; 69 of 215 total colonies selected) of the α/β-null L-CFCs could be expanded versus 86% ± 5% of WT (n = 3; 44 of 52), 87% ± 4% (n = 7; 113 of 134) of β-null, and 58% ± 6% (n = 4; 51 of 90) of α-null L-CFCs (Table 1). Of the
Figure 1
Decreased BCR-ABL–mediated (p190) colony transformation of both α-null and α/β-null progenitor B cells. (A) Plating of p190-infected whole BM (5 × 10⁴ cells) from 3- to 6-week-old mice of the indicated genotypes, on M3630 (CFU–pre-B) medium. *P < 0.05 versus WT; #P < 0.01 versus
β-null; †P < 0.001 versus β-null; 1-way ANOVA, n = 3–7 independent experiments; mean values ± SEM are shown. (B) Schematic flowchart
depicting the clonogenic expansion and assessment of PI3K expression status in L-CFCs. CFU–pre-B colonies were scored at day 7 after infection, and single colonies were selected and transferred to liquid culture. Outgrowth of p190+ L-CFCs was then quantified (“expansion”
was defined as reaching ≥1 × 10⁶ cells), followed by immunoblot assessment of Pik3r1 deletion and p55γ upregulation. Table 1 displays
per-centages of colonies meeting requirements for expansion, deletion of Pik3r1, and absence of p55γ upregulation. (C) Monitoring class IA PI3K subunit expression in expanded L-CFCs. Representative immunoblot shows multiple clones of each genotype with variable loss of p85α and p55γ upregulation. p85α-specific antibody was used to distinguish p85α from p85β. White boxes represent clones that failed to delete p85α
expanded L-CFCs from at least 3 experiments, only 29% ± 5% of the α/β-null cells demonstrated deletion by immunoblot analysis compared with 60% ± 7% of the α-null cells (Table 1). The regula-tory isoform encoded by the Pik3r3 gene, p55γ, was not detected in WT or β-null cells but was upregulated in some α-null clones and most α/β-null clones (Figure 1C and Table 1). The predomi-nant outgrowth of clones lacking Pik3r1 deletion and/or p55γ
upregulation indicates a strong selective pressure to maintain class IA PI3K for colony survival, particularly when Pik3r2 is absent.
The outgrowth of nondeleting cells from α/β-null cultures was not due to selection of CD19– progenitors that lack Cre expression,
since all clones of each genotype expressed CD19 on the surface (Supplemental Figure 1A; supplemental material available online with this article; doi:10.1172/JCI33337DS1). Most clones of each genotype expressed a mixture of markers of pro-B and pre-B cell progenitors (Supplemental Figure 1B), suggesting that the target cell for transformation is not limiting. Moreover, there was a com-parable distribution of B cell progenitor subsets among BM cells 14 hours after infection, at which time the marker-expressing cells were similarly distributed, with mainly pro-B (B220+CD43+IgM–)
and fewer pre-B (B220+CD43–IgM–) phenotypes in both β-null and
α/β-null samples (Supplemental Figure 1C). The inability of some
α-null and most α/β-null L-CFCs to expand in culture is most likely due to ongoing deletion resulting in loss of proliferation or survival. Consistent with this model, ablating p85α expression in
Pik3r1f/fPik3r2–/–cells by retroviral expression of Cre caused rapid and significant cell cycle arrest and apoptosis (Figure 2). Acute deletion of Pik3r1 in Pik3r2+/+ cells also induced cell cycle arrest and apoptosis; however, the effect on cell cycle was significantly weaker than observed in Pik3r2–/–cells. Together, the results indicate that B lineage transformation by p190 is almost completely dependent on class IA regulatory isoforms of PI3K, with Pik3r1 and Pik3r2
gene products exhibiting partially redundant functions.
Reduced class IA PI3K catalytic subunit expression and function.In established L-CFCs that showed complete Pik3r1 deletion without p55γ upregulation, we observed a reduction of p110α, p110β, and p110δ expression in cells lacking class IA regulatory isoforms, with greater loss of catalytic isoform expression in α/β-null compared with α-null or β-null L-CFCs (Figure 1D). Loss of the catalytic sub-units is likely due to reduced stability in the absence of regulatory subunit partners (14).
To assess PI3K activity, we visualized PIP3 in fixed cells using a
specific antibody. Control L-CFCs exhibited PIP3 immunostaining
with a concentration in the plasma membrane and/or intracellular organelles (Figure 3A and Supplemental Figure 2). Pretreatment
with wortmannin blocked the staining in most cells, supporting the specificity of detection. Residual PIP3 production was
abol-ished by pretreatment with wortmannin for longer times (Supple-mental Figure 2C). The α/β-null L-CFCs displayed significantly reduced PIP3 staining, resembling wortmannin-treated control
cells. Thus, the few viable L-CFCs lacking Pik3r1 and Pik3r2 do not sustain PIP3 production by residual class IA catalytic isoforms or
the class IB enzyme.
Most α/β-null clones showed no detectable AKT phosphorylation (p-AKT), and clones with residual p-AKT also showed upregulation of p55γ (Figure 3B). Acute Pik3r1 deletion also abrogated AKT phosphorylation (Figure 2A). Cells that compensated for the loss of Pik3r1 and Pik3r2 by upregulating p55γ were eliminated from our further biochemical and leukemogenic investigations.
Lack of PI3K/AKT functional output. Transcription factors of the forkhead box subgroup O (FOXO) family are important AKT substrates in p190 B-ALL cells (9). In agreement with the lack of p-AKT, α/β-null cells maintained a very low level of phosphorylated FOXO1 and FOXO3a (Figure 2A and Figure 3, B and C), which could not be reduced by pharmacological inhibi-tion of PI3K (Figure 3C). This implies that a PI3K-independent kinase accounts for the residual FOXO phosphorylation. We investigated the sensitivity of α/β-null cells to FOXO-mediated death via overexpression of FOXO3a or a mutant (FOXO3a.A3) that lacks the 3 consensus AKT phosphorylation sites (Figure 3D). The control cells that maintained normal levels of PI3K activity were resistant to WT FOXO3a while remaining sensi-tive to the PI3K-independent form FOXO3a.A3, as described previously (9). In contrast, the α/β-null cells were equally sensi-tive to death caused by WT and AKT-resistant mutant FOXO3a. This indicates that in the presence of diminished PI3K output, the residual FOXO phosphorylation by an alternative kinase is unable to inactivate overexpressed FOXO proteins.
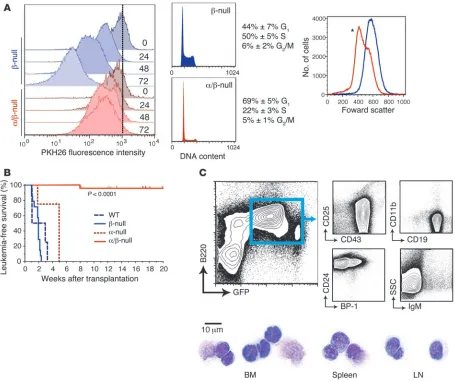
Proliferation and cell cycle deficits. We labeled cells with PKH26 to assess proliferation of established α/β-null cells. We found that
α/β-null cells partitioned the PKH26 dye at a lower rate in com-parison to control cells (Figure 4A). Cell cycle analysis supported these results, showing an increase in the percentage of cells in G1
and a dramatic reduction of cells in S phase. α/β-null clones were also smaller, as assessed by forward light scatter (Figure 4A).
[image:4.585.61.531.111.194.2]Reduced in vivo leukemogenic potential. To assess the in vivo con-sequences of diminished PI3K/AKT signaling, we examined the tumorigenic capacity of multiple L-CFC clones. In this assay, we used only α/β-null L-CFCs lacking detectable p85 proteins or p55γ. WT (1 clone, n = 4 mice), β-null (5 clones, n = 16), α-null
Table 1
Decreased expansion of α/β-null L-CFCs, with high frequency of incomplete Pik3r1 deletion or p55g upregulation
CFU–pre-B transition to L-CFC WT (n = 3) β-null (n = 7) α-null (n = 4) α/β-null (n = 7)
L-CFC outgrowth (reaching ≥1 × 10⁶ cells or 86 ± 5 87 ± 4 58 ± 6A,B 33 ± 3B,C
≥6 well plate) from CFU–pre-B selected (%)
L-CFCs deleted of Pik3r1 (assessed by immunoblot) (%) N/A N/A 60 ± 7D 29 ± 5E
L-CFCs lacking p55γ upregulation (assessed by immunoblot) (%) 100 98 ± 2 63 ± 4B,D 22 ± 2B,D
Establishable L-CFCs meeting expansion and deletion 86 85 22 2 requirements (average %)
research article
(1 clone, n = 4), and α/β-null L-CFCs (5 clones, n = 23) were injected into sublethally irradiated NOD/SCID hosts. Mice with emerging EGFP+ (or hCD4+) leukemic cells developed lymphadenopathy and
splenomegaly, with lymphoblasts exhibiting pro/pre–B-ALL mor-phology and surface phenotype but lacking myeloid lineage mark-ers (Figure 4C and Supplemental Table 1). Mice receiving WT or
β-null cells died from pro/pre–B-ALL after an average of 15 and 13 days, respectively (Figure 4B), whereas mice receiving α-null cells succumbed to disease after an average of 35 days (P = 0.052 vs. WT).
α/β-null cells had a significantly reduced capacity to initiate leu-kemia in vivo (Figure 4B). Among all α/β-null transplanted mice, only 1 (of 23) developed a leukemic disease in which cells retained an α/β-null status by immunoblot analysis. This mouse developed leukemic blasts in the BM, lymph nodes, and spleen with some mature B cell markers: CD19+, IgM+, B220+, CD43–, CD25–, CD24+,
BP-1+, IgD–, CD11b–. These blasts displayed detectable p-AKT and
prominent upregulation of p55γ (Supplemental Figure 3). The striking block in leukemogenesis and the upregulation of p55γ in the 1 instance of emerging leukemia from α/β-null cells strongly suggest that p190 drives B-ALL in a manner completely dependent
on class IA PI3K function. However, the residual proliferation in vitro prompted us to examine the drug sensitivity of control and PI3K-deficient L-CFCs.
The mTOR pathway is a vital signaling node for α/β-null cells.To assess the importance of different signaling mechanisms in the absence of PI3K signaling output, we measured cell cycle progression after treatment with pathway-selective inhibitors. Wortmannin, used at a concentration (50 nM) that inhibits all classes of PI3K but not mTOR (15, 16), caused a modest increase in the G1 fraction and a
significant decrease in cycling ability (percentage of cells in S/G2/M
phase) of control cells (β-null) (Figure 5A, right panel, P < 0.001). However, wortmannin had no significant effect on the cycling ability of α/β-null cells, indicating that other PI3K subclasses do not compensate appreciably for class IA PI3K in cell cycle control. LY294002, a global PI3K inhibitor that also inhibits mTOR directly (15, 17), induced G1 arrest in both control and α/β-null cells;
more-over, the α/β-null cells were hypersensitive, as shown by the greater decrease in the number of cycling α/β-null compared with control cells (P < 0.05). Consistent with the interpretation that the effects of LY294002 were mainly due to direct effects on the
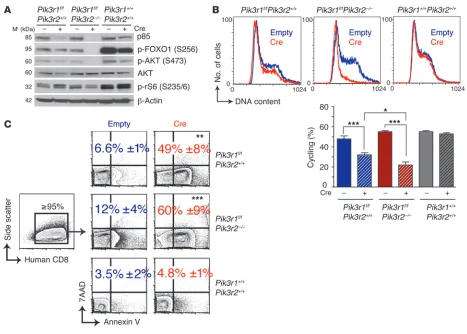
rapamycin-Figure 2
Dependence on continued PI3K signaling for maintenance of p190 L-CFCs. (A) L-CFCs were transduced with MSCV-IRES-human CD8 (Empty)
or MSCV-Cre-IRES-human CD8 (Cre) and monitored for deletion of Pik3r1 and PI3K/mTOR signaling by immunoblotting 48 hours after infection. The blot is representative of 2 independent experiments using 3 separate clones. (B) L-CFCs were stained for human CD8 48 hours after infec-tion and subsequently fixed and stained with propidium iodide for DNA content analysis of live gated human CD8+ cells by FACS. Graph shows
the percentage of cells cycling (S/G2/M); mean ± SEM; n = 3 clones. *P < 0.05, ***P < 0.001; 1-way ANOVA. (C) Human CD8+ L-CFCs were
assayed for apoptosis by annexin V/7AAD staining 48 hours after infection. Cell death is expressed as the percentage (±SEM) of annexin V+
[image:5.585.63.530.79.413.2]sensitive mTOR complex–1 (mTORC1), addition of rapamycin also caused a greater decrease in cycling α/β-null cells compared with control cells (P < 0.01). These findings indicate that residual mTORC1 signaling in α/β-null cells is required for proliferation in
[image:6.585.81.504.83.537.2]the absence of class IA PI3K activity. The finding that rapamycin induced greater apoptosis in the α/β-null cells, and that LY294002 caused apoptosis in cells of both genotypes, indicates that only the combined loss of the PI3K/AKT and mTORC1 pathways can lead to
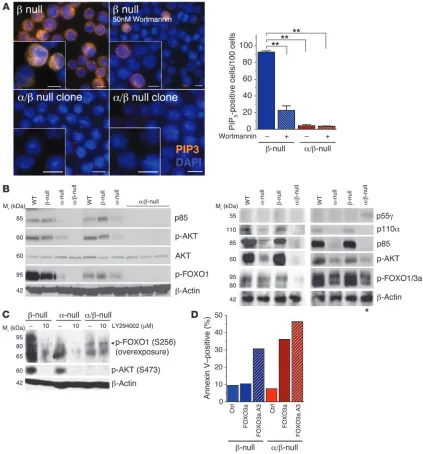
Figure 3
Lack of PI3K/AKT/FOXO functional signaling output in α/β-null L-CFCs. (A) β-null and α/β-null cells were fixed, permeabilized, and immunola-beled with anti-PIP3 antibodies (orange). Nuclei were stained by DAPI (blue). Indicated cells were pretreated with 50 nM wortmannin 30 minutes
prior to fixation. Immunoreactive cells were quantitated by counting 100 cells in images acquired with a 40× objective (represented in the graph) and visualized with a 100× objective (represented in the images). Typical examples of n = 4 clones per genotype, 2 independent experiments (see also Supplemental Figure 2). Scale bars: 10.0 μm. **P < 0.001 versus untreated β-null cells; 1-way ANOVA. (B) Multiple clones of L-CFCs of the indicated genotypes were immunoblotted for class IA PI3K isoforms and assessed for phosphorylation of AKT (p-AKT S473) and its sub-strates FOXO1 and FOXO3a (p-FOXO1 T24/p-FOXO3a T32, right panel; or p-FOXO1 S256, left panel. Note: Anti–p-FOXO1 (S256) can detect p-FOXO4 (S193), but antibodies are not available to confirm mouse FOXO4 expression. Asterisk indicates representative α/β-null L-CFC clone that upregulated p55γ, with a concomitant increase in AKT activity. (C) p190 L-CFCs of the indicated genotypes were treated for 15 minutes with
LY294002 (10 μM) and subsequently immunoblotted for p-AKT (S473) and p-FOXO1/4 (S256/S193; note the overexposure with p-FOXO for
detection of low signal). n = 3 experiments using 2 different clones. (D) p190 L-CFCs were infected with retroviruses MSCV-IRES-Thy1.1 (Ctrl),
MSCV-FOXO3a-IRES-Thy1.1, or MSCV-FOXO3a.A3-IRES-Thy1.1. Apoptosis was assessed in Thy1.1+ cells by annexin V/7AAD staining 48
research article
a substantial level of cell death in this system. Loss of PI3K/AKT sig-naling output also rendered p190 cells more sensitive to apoptosis caused by imatinib (Figure 5, A and B).
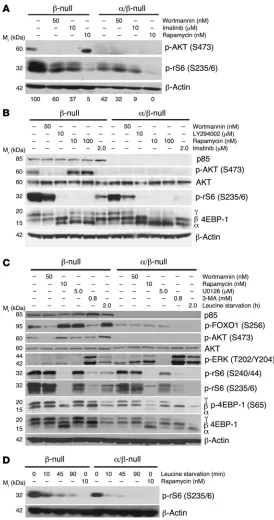
Considering that α/β-null cells were hypersensitive to rapamy-cin, we examined the status and drug sensitivity of signaling events downstream of mTORC1, including potential feedback regula-tion of AKT. The serine/threonine kinase mTOR is regulated by both PI3K/AKT and other inputs (18, 19). We found that genetic or pharmacological inhibition of PI3K only partially reduced mTORC1 function as assessed by phosphorylation of ribosomal protein S6 (p-rS6) (Figure 6, A–D; also see Figure 2A for acute
Pik3r1 deletion). The residual p-rS6 was comparable to β-null cells treated with the pan-PI3K inhibitor wortmannin. Rapamycin suppressed p-rS6 almost completely in control and α/β-null cells, confirming the presence of PI3K-independent inputs to mTORC1 activity in these cells. Rapamycin also greatly reduced the fraction
of phosphorylated 4EBP-1, a direct mTORC1 substrate (Figure 6, B and C), whereas 4EBP-1 phosphorylation was partly maintained in α/β-null cells or wortmannin-treated controls.
The α/β-null cells lacked p-AKT, while the control cells showed p-AKT that was sensitive to wortmannin, LY294002, and imatinib (Figure 6, A and B). Rapamycin caused an increase in AKT phos-phorylation in control cells, with an accompanying increase in AKT activity as judged by FOXO phosphorylation (Figure 6, A–C). This “AKT rebound” phenomenon has been described in many cell contexts and is partly attributed to feedback inhibition of PI3K/ AKT signaling by S6 kinases (S6Ks), which is prevented by rapamy-cin (18–20). A significant consequence of deleting both Pik3r1 and
[image:7.585.66.521.81.463.2]Pik3r2 was the complete loss of rapamycin-induced enhancement of AKT phosphorylation. This might explain the greater sensitivity of α/β-null cells to cell cycle arrest and death following rapamycin treatment (Figure 5A).
Figure 4
Severe loss of leukemogenic potential of α/β-nullL-CFCs. (A) Proliferation and cell cycle in α/β-null L-CFCs were assessed in vitro, where β-null (blue) and α/β-null (red) L-CFCs were labeled with 2 μM PKH26 and subsequently analyzed for dilution of PKH26 every 24 hours (left panel, representative of 2 independent experiments using 2 clones) and cellular size analyzed (right panel; *P < 0.05, 2-tailed, paired Student’s t test) by forward scatter; n = 3 clones. (B) Survival analysis of sublethally irradiated NOD/SCID mice transplanted with p190 L-CFCs (1 × 10⁶ cells).
EGFP+ (or human CD4+) cells (>98% purity) from BM and spleen were collected to assess class IA PI3K deletion status (immunoblot analysis
Class IA–independent mechanisms for mTOR pathway activation. To explore the mechanism of PI3K/AKT-independent mTOR activ-ity, we assessed the role of 2 potential mTOR regulatory pathways: ERK activity and amino acid sensing. Basal ERK phosphoryla-tion was consistently elevated in α/β-null L-CFCs and blocked by treatment of cells with the MEK inhibitor U0126 (Figure 6C). However, MEK inhibition did not alter mTOR activity as judged by phosphorylation of 4EBP-1 (Figure 6C). p-rS6 expression was modestly reduced in both control and α/β-null L-CFCs, likely due to stimulatory effects of ERK on S6K (21). We assessed the contri-bution of amino acid sensing by withdrawal of leucine from the culture media. Under these conditions, mTOR activity was rapidly extinguished in α/β-null L-CFCs and to a lesser degree in control cells (Figure 6, C and D), as in other cell systems (16, 22). Amino acid sensing by mTOR is promoted by class III PI3K (hVPS34), an enzyme whose activity is sensitive to wortmannin (22). This might explain the partial inhibition of mTOR signaling by wortmannin in α/β-null L-CFCs that lack class IA PI3K (Figure 6, A–C). More-over, the class III PI3K inhibitor 3-methyladenine (3-MA) reduced mTOR activity (Figure 6C). In summary, residual mTORC1 activity in α/β-null L-CFCs is ERK independent and sustained by amino acid sensing and other pathways that remain to be defined.
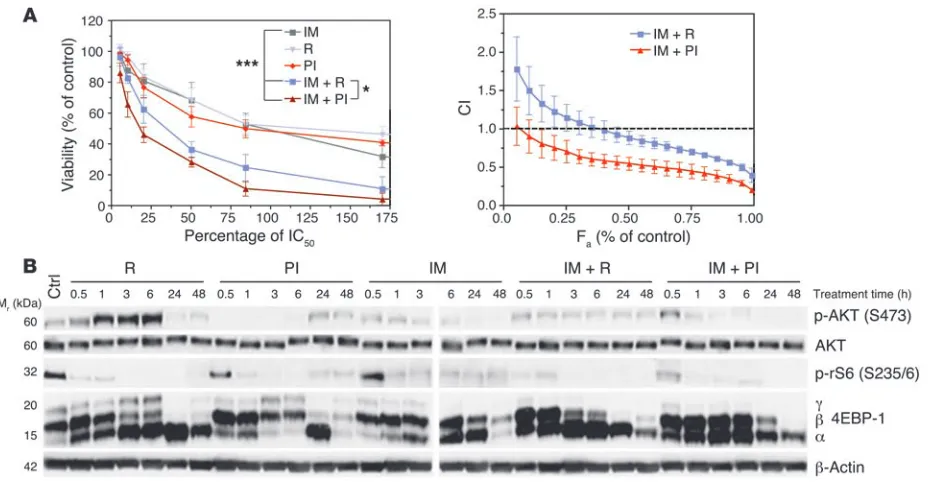
Multitargeted inhibition of pre–B-ALL proliferation with BCR-ABL kinase inhibitor and dual PI3K/mTOR kinase inhibitor. The residual proliferation and mTORC1 signaling in α/β-null cells, together with the feedback activation of AKT in rapamycin-treated con-trol cells, suggested that dual targeting of PI3K and mTOR might
be more effective than single targeting of either signaling node. A small molecule inhibitor, PI-103, selectively blocks the kinase activity of class I PI3K catalytic isoforms and both mTOR com-plexes at nanomolar concentrations (15, 23, 24). We treated p190 L-CFCs (from BALB/c BM) for 48 hours with multiple concentra-tions of imatinib, rapamycin, or PI-103, alone and in combina-tion (Figure 7A). The percentage of viable cells was determined by MTS assay, and drug synergy was calculated using CalcuSyn software by the method of Chou (25). Both rapamycin and PI-103 suppressed survival with a maximal effect of approximately 50%, though rapamycin was approximately 70-fold more potent on a molar basis (Figure 7A). As previously reported (26), rapamycin showed slight to strong synergy with imatinib, except at lower concentrations of rapamycin (<40% IC50) where the
combina-tion produced antagonism (<20% IC50) to near additivity (<40%
IC50). PI-103 combined with imatinib exhibited near additivity
(<10% IC50) to strong synergy that was consistently greater than
observed with rapamycin and imatinib.
[image:8.585.44.352.80.430.2]To define the mechanism of action of drug combinations, we immunoblotted for p-AKT and mTOR activity over a time course of inhibitor treatment (Figure 7B). Rapamycin enhanced p-AKT during the first 6 hours of treatment, though this effect was lost at 24 and 48 hours. Simultaneous inhibition of PI3K and mTOR with PI-103 prevented this feedback rebound, such that p-AKT was effectively suppressed during the first 6 hours. Cells treated with imatinib plus rapamycin showed residual p-AKT that was elimi-nated in cells treated with imatinib plus PI-103. Also, imatinib
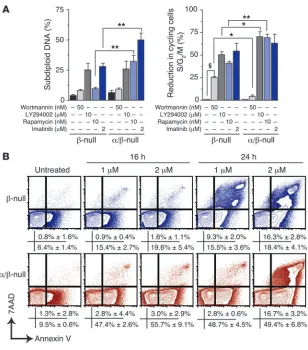
Figure 5
α/β-null L-CFCs show altered drug sensitivity. (A) L-CFCs were treated with the indicated inhibitors for 24 hours and assessed for apoptosis (subdiploid DNA, left panel) and cycling cells (% S/G2/M phase,
right panel) by flow cytometry. Differences in treat-ment effects between β-null and α/β-null were ana-lyzed by 2-way ANOVA (*P < 0.05, **P < 0.01) and 1-way ANOVA for wortmannin effects compared with untreated controls (§P < 0.001). Mean values ±
SEM are shown; n = 4, using 4 different clones. (B) L-CFCs (blue, β-null; red, α/β-null) were treated with or without 1 μM or 2 μM imatinib for 16 hours or 24 hours and analyzed for apoptosis. Cells that stained positive for annexin V and negative or positive for 7-AAD are reported as mean percentage ± SEM;
research article
plus PI-103 suppressed mTORC1 signaling to a similar extent as imatinib plus rapamycin. Collectively, these results suggest that suppression of rebound AKT activity might explain the greater functional effects of imatinib plus PI-103.
We compared the efficacy of different drug combinations on BCR-ABL–driven leukemic cell expansion in vivo over a 2-day treat-ment course. BALB/c mice were lethally irradiated and reconsti-tuted with a syngeneic radioprotective graft of BM cells and synge-neic p190 cells (marked by hCD4). After 11 days, when hCD4+ cells
could be detected in peripheral blood (Supplemental Figure 4), mice were treated for 2 consecutive days with vehicle alone or
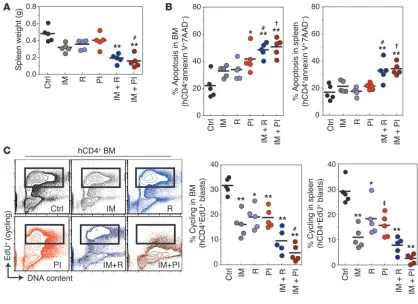
sub-optimal imatinib (70 mg/kg, twice per day), rapamycin (7 mg/kg, once per day), and PI-103 (40 mg/kg, twice per day), alone or in combination. Mice were then sacrificed, and several aspects of leukemic disease were assessed. Treatment with imatinib alone, compared with vehicle, significantly reduced leukemic disease as measured by spleen weight and percentage of hCD4+ cells in the
peripheral blood (Figure 8 and Supplemental Figure 4). Imatinib alone also reduced the number of cycling hCD4+ cells in BM and spleen but caused no
signifi-cant increase in apoptosis of hCD4+ cells. Rapamycin or
PI-103 alone did not significantly reduce spleen weight but did reduce leukemic cell cycling, with variable effects on apoptosis. Imatinib plus PI-103 produced a signifi-cantly stronger antileukemic effect than imatinib alone, as measured by spleen weight. In accordance with this, imatinib plus PI-103 caused significantly greater cell cycle arrest and death in leukemia cells compared with imatinib alone. As previously reported (26), imatinib plus rapamycin was also effective and caused a signifi-cant increase in apoptosis compared with imatinib alone. However, the reduction in spleen weight and leukemic cell cycling was not statistically greater for imatinib plus rapamycin compared with imatinib alone. Thus, PI-103 but not rapamycin enhanced the effects of imatinib on spleen weight and BM leukemic cell cycling. Note that the PI-103 dose (80 mg/kg/d) was only 11-fold greater than the rapamycin dose (7 mg/kg/d), whereas the IC50
of PI-103 in vitro is nearly 70-fold higher. Overall, these results support the in vitro data in showing that PI-103 is more effective than rapamycin in combining with ima-tinib to suppress leukemic cell expansion.
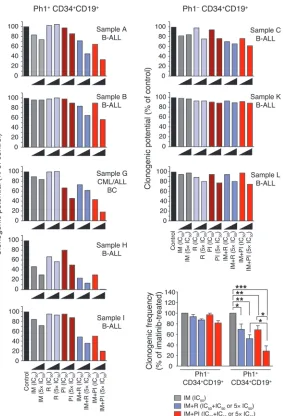
To extend these findings from the murine system, we compared the effects of PI-103 and rapamycin on primary human Ph+ leukemias. CD19+CD34+ cells were purified from peripheral
blood of patients with Ph+ ALL, PH+ CML with lymphoid BC, or
Ph– B-ALL, and clonogenic potential was assessed in the presence
of various drug combinations. Ph– B-ALL samples were resistant
to imatinib, as expected. In each case of Ph+ disease, the presence
[image:9.585.43.317.82.602.2]of PI-103 combined with imatinib suppressed colony formation to a greater extent than imatinib alone or imatinib in combination with rapamycin; overall, these differences were statistically signifi-cant (Figure 9 and Supplemental Figure 5). Notably, the results from samples B and G also indicate that PI-103 can potentiate the
Figure 6
α/β-null L-CFCs maintain mTOR signaling via class IA PI3K–
independent mechanisms. (A) p190 L-CFCs were treated
antileukemic effect of imatinib in Ph+ samples that are clinically
resistant to this ABL inhibitor.
Discussion
Pediatric and adult Ph+ pre–B-ALL represents a subtype of
leuke-mia with poor prognosis and rapidly acquires resistance to ima-tinib treatment during therapy. Induction regimens that target signaling pathways downstream of BCR-ABL have been hypoth-esized to be effective therapeutic strategies in patients that devel-op resistance to imatinib (3, 27). Here we have presented evidence that: (a) targeting the class IA PI3K subgroup strongly suppresses transformation and leukemogenesis in a mouse model of Ph+ pre–
B-ALL; and (b) dual inhibition of PI3K and mTOR is a particularly effective approach to suppressing survival of mouse pre–B-ALL cells and clonogenic expansion of human Ph+ CD19+CD34+ cells.
Increased PI3K/AKT signaling through activation of tyrosine kinases, loss of PTEN, or activating mutations in the p110α cata-lytic subunit of PI3K occurs in a wide variety of malignancies (28). PI3K pathway activation drives proliferation, apoptotic resistance, and changes in metabolism. Cells expressing BCR-ABL show con-stitutive production of PIP3 and phosphorylation of AKT and its
substrates (5) (Figure 10). A requirement for class IA PI3K activa-tion, or “PI3K addicactiva-tion,” seems very likely in CML (7, 8) but has not been established in Ph+ ALL. Previous work has suggested a
requirement for class IA PI3K in the murine pre–B-ALL model but has not distinguished the roles of different isoforms (5, 10, 29). Genetic ablation of Pik3r1 encoding p85α/p55α/p50α causes only partial inhibition of B lineage transformation by p190, and deletion of Pik3r2 (p85β) has no effect (9). Here we show that loss of p85β in addition to p85α/p55α/p50α reduces PI3K signaling output to an undetectable level. BM-derived progenitor B cells lacking both Pik3r1 and Pik3r2 showed greatly reduced trans-formation by p190, and outgrowth of nondeleting cells in this conditional Cre-loxP system indicates a strong selective pressure for PI3K signaling. The appearance of clones that upregulate the p55γ regulatory isoform supports the model of selective pres-sure for class IA PI3K expression and function. Acute deletion of
Pik3r1 also caused rapid cell cycle arrest and death, with greater effects in cells also lacking Pik3r2. Importantly, Pik3r1/Pik3r2
ablation essentially abolished leukemogenesis in an in vivomodel, with a single mouse displaying a late-onset malignancy with p55γ
upregulation. Thus, the additional signals received by leukemia cells in the living animal are not sufficient to bypass the require-ment for class IA PI3K signaling.
[image:10.585.64.528.81.323.2]Using the few α/β-null L-CFCs that delete the floxed allele, we examined the status of signaling nodes downstream of PI3K/AKT. Most growth factors and many oncoproteins activate the mTOR signaling pathway in a PI3K/AKT-dependent manner (18, 19, 30).
Figure 7
Attenuating PI3K and mTOR signaling together with BCR-ABL inactivation provides a greater synergistic response. (A) p190 L-CFCs were
treated for 48 hours with the indicated inhibitors alone or in combination with imatinib (IM; left panel). Cell viability and IC50 were determined
using the MTS assay. *P < 0.05, imatinib plus PI-103 (PI) versus imatinib plus rapamycin (R); ***P < 0.001, imatinib versus drug combination; repeated-measures 1-way ANOVA. The viability of cells treated with drug combinations at fixed ratios was plotted in the same graph (left panel), and drugs were assessed for synergy by calculating the combination index (CI) using CalcuSyn software (right panel). The CI is plotted as a function of the fractional growth inhibition (CI-Fa plot using median-effect equation; ref. 25) by Monte Carlo simulation of 3 compiled independent
experiments. CIs of less than 1, of 1, and of greater than 1 indicate synergism, additive effect, and antagonism, respectively. Mean ± SD is shown; n = 3 independent experiments, using 2 separate clones. (B) p190 L-CFCs were treated for the indicated times with drug combinations, then cell lysates were subjected to immunoblot analysis using 2 gels run and developed concurrently with the same sample set. n = 2. Here we used concentrations of rapamycin (10 nM; ~120% IC50) and PI-103 (250 nM; ~45% IC50) that are achievable in vivo without excessive toxicity
research article
The mTOR serine/threonine kinase exists in 2 complexes. Com-plex 1 (mTORC1) is the form that is inhibited by rapamycin (Fig-ure 10) and integrates signals from growth factors and nutrients to promote ribosome biogenesis, translation, and cell growth and proliferation. It is well established that BCR-ABL–expressing cells exhibit active mTORC1 signaling (26, 31), which is likely impor-tant to support the increased cell cycling and metabolic demands imposed by leukemic transformation. Surprisingly, we found that PI3K-deficient cells retain residual mTORC1 signaling, though at lower levels that correlated with smaller cell size. PI3K-deficient cells remained sensitive to rapamycin, establishing that mTORC1 has a required function even in the absence of AKT activity. The nutrient-sensing pathway independent of BCR-ABL appears to be essential to maintain mTORC1 activity in cells with low PI3K/AKT signaling. Further work is necessary to determine whether nutri-ent sensing drives residual mTORC1 activity or is merely permis-sive for another activating signal.
Although compounds that inhibit PI3K catalysis are consid-ered promising therapeutics, our work suggests likely benefits of developing agents that can interfere with the function of class IA regulatory subunits. In this regard, it is important to consider that
class IA regulatory isoforms might have scaffolding functions in oncogenic signaling that are independent of their role in local-izing and activating the catalytic subunits (32). We consider this unlikely in the murine pre–B-ALL system, as clones upregulating p55γ displayed normal growth characteristics, which correlated with maintenance of AKT phosphorylation. p55γ lacks the N-ter-minal modules (SH3, RhoGAP-homology) that are required for known scaffolding functions of p85α while retaining conserved SH2 domains required for recruitment to tyrosine-phosphorylated BCR-ABL substrates. These observations imply that potential Ph+
leukemia therapies targeting class IA regulatory subunits might be most effective if designed to interfere with conserved features of the different isoforms.
Rapamycin and related mTORC1 inhibitors are clinically impor-tant immunosuppressive agents that are currently in trials for anticancer activity (30, 33). In Ph+ leukemia, rapamycin analogs are
[image:11.585.85.503.82.386.2]being tested in combination with imatinib. A key concern with this approach is that many tumors treated with mTORC1 inhibitors show elevated AKT activity, suggesting a mechanism for resistance to therapy. Blocking mTORC1 can augment mTORC2 activity, recently shown to mediate phosphorylation of AKT on serine 473
Figure 8
Short-term in vivo administration of PI-103 combined with imatinib suppresses leukemic cell expansion more effectively than imatinib alone. (A) Lethally irradiated syngeneic recipients were transplanted with p190 L-CFCs (hCD4+) together with normal BM, then treated on days 11–13
after injection (i.p.; 2 days of treatment) with single and combination doses of imatinib (70 mg/kg, b.i.d.) and rapamycin (7 mg/kg, once per day) or imatinib and PI-103 (40 mg/kg, b.i.d.) or double placebo control (diH2O and 75%/25% DMSO/saline mixture, b.i.d.) prior to sacrifice. Spleen
weights after treatment regimen are reported. (B) Percent apoptosis in the BM and spleen was determined by annexin V/7AAD staining of hCD4+
blasts after 2-day treatment regimen. (C) Two hours prior to sacrifice, mice were injected with 5-ethynyl-2′-deoxyridine (EdU; i.p., 1.125 mg) and assayed for cycling cells that incorporated EdU in the BM and spleen with Click-iT EdU AF647 azide and propidium iodide staining (left and right panels). Representative depiction of cycling cells in the BM (left panel). *P < 0.05, ‡P < 0.01, **P < 0.001 versus control; #P < 0.05, †P < 0.01
(34). mTORC1 inhibition also reduces S6K1 activity, disrupting the negative feedback phosphorylation of signaling adaptor pro-teins. Either of these mechanisms can lead to rebound enhance-ment of AKT function and induce a recovery of prosurvival signals (Figure 10). High AKT activity is associated with a poor prognosis as well as resistance to chemotherapy (35, 36).
To achieve blockade of PI3K, AKT, and mTOR simultaneously, we used the multitargeted inhibitor PI-103 (Figure 10). This com-pound has similar potency against class IA PI3K catalytic subunits and both mTOR complexes and blocks proliferation of many human cancer cell lines (15, 24). We found that PI-103 is less potent than rapamycin on a molar basis but synergizes significantly better with imatinib to suppress the proliferation and survival of p190-transformed L-CFCs. Supporting the potential of this com-pound for cancer therapy, PI-103 suppresses solid tumor growth in xenograft models more potently than agents targeting PI3K or mTOR alone (23, 24). Although the doses of PI-103 used in these mouse studies are well tolerated, the compound has unfavorable pharmacokinetics (24). Hence, development of similar compounds with greater potency and better drug properties should be a
prior-ity. It will also be important to distinguish whether the potency of PI-103 relative to rapamycin arises from more sustained suppression of AKT activation or from other mechanisms.
Various pharmaceutical companies have drug dis-covery efforts to develop compounds targeting specif-ic PI3K isoforms or subgroups, especially within the class IA and IB enzyme subfamilies. Our data estab-lish that class IA PI3K signaling contributes quanti-tatively to BCR-ABLtransformation and is essential for in vivo leukemogenesis. Moreover, even in the rare event when cells escape PI3K addiction, they prolifer-ate slowly and remain dependent on mTORC1. Our genetic and pharmacological data in murine and human pre–B-ALL cells suggest that targeting the PI3K pathway at multiple nodes will provide greater therapeutic efficacy.
Methods
Antibodies and other reagents. A list of antibodies is pro-vided in Supplemental Methods. PI-103 was synthesized as described previously (15, 23). Other pharmacological inhibitors were obtained from commercial sources: LY294002, U0126, 3-MA (Sigma-Aldrich), rapamycin (LC Laboratories), imatinib (Novartis), and wortmannin (Calbiochem).
Retroviral vectors and generation of virus stocks. Bicistronic retroviral vectors were used to express exogenous genes and a marker gene from the murine stem cell virus (MSCV) long terminal repeat. Details of these vectors and preparation of virus stocks are provided in Supplemental Methods.
Mice. The generation of Pik3r1-flox and mice lacking Pik3r2 is described in detail elsewhere (12, 13, 37). These strains were kindly provided by Lewis Cantley (Harvard University, Boston, Massachusetts, USA) and crossed to CD19-Cre knock-in mice (gift of Robert Rickert, Burnham Institute, La Jolla, California, USA). Mice were maintained in a mixed background (C57BL/6 × 129SvEv) for the experiments, and BM was harvested when animals were 3–6 weeks of age. NOD.CB17-Prkdcscid/J (NOD/SCID) and
BALB/c mice were purchased from The Jackson Laboratory. All animal pro-tocols were approved by the Institutional Animal Care and Use Committee of University of California, Irvine.
BM progenitor cell transduction and establishment of p190 BCR-ABL L-CFCs.
[image:12.585.49.332.80.496.2]BM cells were flushed from the long bones (tibias and femurs) of 3- to 4-week-old mice. Cells were spinoculated with retroviral supernatant in
Figure 9
Anticlonogenic effects of PI-103 combined with ima-tinib in Ph+ leukemia progenitors. Primary Ph+ leukemia
samples (Ph+ B-ALLCD34+/CD19+, n = 5; Ph+
CML/ALL-BCCD34+/CD19+, n = 1; and Ph– ALLCD34+/CD19+, n = 3) were
assessed for colony formation potential with or without single and combination treatments of imatinib, rapamy-cin, or PI-103. 100% clonogenic potential was normal-ized to vehicle-treated samples. Clonogenic frequencies of combination treatments were compared with that of imatinib alone (expressed as percent of imatinib-treat-ed). *P < 0.05, **P < 0.01, ***P < 0.001; 2-way ANOVA; mean values ± SEM are shown; Ph+, n = 5 and Ph–,
n = 3, comparing the source of variation from Ph+/– and
treatment. Note that in the combination treatments, the imatinib concentration was fixed at its IC50. Cytogeneics,
research article
the presence of 5 μg/ml polybrene for 45 minutes at 450 g and 37°C with RPMI-20 culture medium (see Supplemental Methods) supplemented with recombinant mouse IL-7 (10 ng/ml; R&D Systems) to promote cell cycle entry. Following spinoculation, cells were incubated overnight at 37°C, 5% CO2 and plated (5 × 10⁴ cells) in M3630 methylcellulose cultures
(Stem-Cell Technologies) as described previously (9). (Stem-Cells were then selected, expanded, and infected as described further in Supplemental Methods.
Immunoblotting.Immunoblotting was performed using standard
proce-dures (see Supplemental Methods). Where indicated, cells were subjected to amino acid starvation as described in Supplemental Methods. In Figure 6A, ImageJ (http://rsbweb.nih.gov/ij/) was used to quantitate band intensity.
Flow cytometry and immunofluorescence microscopy. FACS acquisition was
performed on a BD FACSCalibur or LSRII, and surface markers were detected with fluorescent mouse- or human-specific antibodies as detailed in Supplemental Methods.
In vitro drug combination studies.p190 L-CFCs (generated from M3630
clonal cultures of 3-week-old BALB/c BM; 2 × 10⁴ cells) were incubated
in triplicate wells of 96-well culture plates for 48 hours in the presence of increasing concentrations of imatinib, rapamycin, and PI-103. Cell viability and IC50 were determined using the MTS assay (CellTiter 96 AQueous One
Solution Cell Proliferation Assay kit; Promega). Absorbance values were normalized to vehicle control-treated (0.2% DMSO) cells and expressed as percent cell viability. A range of fixed ratios of drug combinations was employed to assess synergy using the combination index (CI) with Calcu-Syn software (Biosoft) using the median-effect method of Chou (25). Potency (IC50), shape (m, coefficient of the slope equation), and the linear
correlation coefficient (r) parameters of dose-effect curves for imatinib (IC50= 563 ± 17 nM, m = 1.178, r = 0.98, n = 3), rapamycin (IC50 = 8.5 ± 2.5
nM, m = 1.083, r = 0.97, n = 3), and PI-103 (IC50 = 592 ± 38 nM, m = 1.030,
r = 0.98, n = 3) were calculated from 6 dose ranges (5%–350% of IC50).
Transplantation and in vivo drug delivery studies. For studies involving trans-plantation of p190 L-CFCs generated from Pik3r1-floxed mice, single colo-nies from 7-day M3630 methylcellulose cultures were expanded in RPMI-20
and assessed for immunophenotype, and for expression of p85α, p85β, and p55γ and p-AKT/FOXO status by immunoblotting before in vivo transplan-tation. Following a 2-week in vitro expansion, 1 × 10⁶ cells were injected into
the retroorbital venous sinus of 6- to 10-week-old NOD/SCID mice that had been sublethally irradiated with 240 cGy of total body γ-irradiation. For studies involving in vivo drug treatment of animals, the BM was flushed from 3-week-old BALB/c mice and spinoculated with retroviral superna-tants (MSCV-BCR-ABL-IRES-hCD4) as plated in colony assays, expanded, and injected into to 8-week-old syngeneic BALB/c mice. Further details are provided in Supplemental Methods.
Primary human leukemia samples.All human leukemia specimens were
obtained by one of the authors (M.B. Lilly) while treating the subjects at Loma Linda Medical Center, Loma Linda, California, USA. Heparinized peripheral blood was collected during the course of routine clinical care or as part of a Loma Linda Medical Center Institutional Review Board– approved specimen bank protocol. Mononuclear cells were then isolated by density gradient centrifugation, suspended in 90% FCS/10% DMSO, and stored in liquid nitrogen. Their use for these studies was approved by the University of California Irvine Institutional Review Board, with the stipula-tion that the samples lacked personal identifiers and that the donors were either deceased or had initially signed a specimen banking consent. Cryo-preserved samples (90% FCS/10% DMSO) of mononuclear cells from the peripheral blood of patients with Ph+ ALL, Ph+ CML with lymphoid BC, or
Ph– B-ALL were thawed, cultured overnight, and plated in methylcellulose
as detailed in Supplemental Methods.
Statistics.GraphPad Prism (version 4.0c) software was used for all statistical analyses. Homogeneity of variances was calculated by Bartlett’s test. Ran-dom continuous variables were analyzed using 2-tailed Student’s t test, 1-way ANOVA, and 2-way ANOVA, where indicated. Bonferroni post-hoc analy-sis was used throughout, and the Tukey post-hoc test was used in Figure 9. Survival curves were compared using the log-rank test. Data are reported as the mean ± SEM, unless otherwise indicated. A P value less than 0.05 was considered significant.
Acknowledgments
We thank Craig Walsh, Tiong Ong, Aimee Edinger, Glen Raffel, and Stefan Frohling for helpful discussions; Stan Sowy, Ryan Nguyen, and Hector Truong for technical assistance; and Andrea Tenner, Naomi Morrisette, Tom Lane, David Camerini, Tiong Ong, and Hung Fan for access to essential equipment and reagents. We thank Kyle Miller, Kathy Free, and Invitrogen for providing the Click-iT EdU (5-ethynyl-2′-deoxyridine) flow cytometry assay kits and supplemental EdU. We acknowledge support from NIH grants AI50831 (D.A. Fruman), T32 CA9054 (M.G. Kharas), and AI44009 (K.M. Shokat).
Received for publication July 20, 2007, and accepted in revised form July 9, 2008.
Address correspondence to: David Fruman, UC Irvine, Depart-ment of Molecular Biology and Biochemistry, 3242 McGaugh Hall, Irvine, California 92697-3900, USA. Phone: (949) 824-1947; Fax: (949) 824-8551; E-mail: dfruman@uci.edu.
Michael G. Kharas’s present address is: Department of Hema-tology and Oncology, Brigham and Woman’s Hospital, Boston, Massachusetts, USA.
[image:13.585.51.281.81.253.2]Michael G. Kharas and Matthew R. Janes contributed equally to this work.
Figure 10
1. Wong, S., and Witte, O.N. 2004. The BCR-ABL story: bench to bedside and back. Annu. Rev. Immu-nol.22:247–306.
2. Druker, B.J., et al. 2006. Five-year follow-up of patients receiving imatinib for chronic myeloid leukemia. N. Engl. J. Med.355:2408–2417. 3. Druker, B.J. 2003. Overcoming resistance to
ima-tinib by combining targeted agents. Mol. Cancer
Ther.2:225–226.
4. Marone, R., Cmiljanovic, V., Giese, B., and Wymann, M.P. 2008. Targeting phosphoinositide 3-kinase:
moving towards therapy. Biochim. Biophys. Acta.
1784:159–185.
5. Kharas, M.G., and Fruman, D.A. 2005. ABL onco-genes and phosphoinositide 3-kinase: mechanism of activation and downstream effectors. Cancer Res.
65:2047–2053.
6. Vanhaesebroeck, B., et al. 2001. Synthesis and func-tion of 3-phosphorylated inositol lipids. Annu. Rev. Biochem.70:535–602.
7. Skorski, T., et al. 1997. Transformation of hema-topoietic cells by BCR/ABL requires activation
of a PI-3k/Akt-dependent pathway. EMBO J.
16:6151–6161.
8. Skorski, T., et al. 1995. Phosphatidylinositol-3 kinase activity is regulated by BCR/ABL and is required for the growth of Philadelphia chromo-some-positive cells. Blood.86:726–736.
9. Kharas, M.G., et al. 2004. Phosphoinositide 3-kinase signaling is essential for ABL oncogene-mediated transformation of B-lineage cells. Blood.
103:4268–4275.
10. Sattler, M., et al. 2002. Critical role for Gab2 in trans-formation by BCR/ABL. Cancer Cell.1:479–492. 11. Ren, S.Y., et al. 2005. Phosphatidylinositol 3-kinase
p85{alpha} subunit-dependent interaction with BCR/ABL-related fusion tyrosine kinases:
molecu-lar mechanisms and biological consequences. Mol.
Cell. Biol.25:8001–8008.
12. Luo, J., et al. 2005. Class IA phosphoinositide 3-kinase regulates heart size and physiological car-diac hypertrophy. Mol. Cell. Biol.25:9491–9502. 13. Ueki, K., et al. 2002. Increased insulin sensitivity in
mice lacking p85beta subunit of phosphoinositide 3-kinase. Proc. Natl. Acad. Sci. U. S. A.99:419–424. 14. Yu, J., et al. 1998. Regulation of the p85/p110
phos-phatidylinositol 3′-kinase: stabilization and inhibi-tion of the p110alpha catalytic subunit by the p85 regulatory subunit. Mol. Cell. Biol.18:1379–1387. 15. Knight, Z.A., et al. 2006. A pharmacological map of
the PI3-K family defines a role for p110[alpha] in insulin signaling. Cell.125:733–747.
16. Wlodarski, P., et al. 2005. Activation of mammalian target of rapamycin in transformed B lymphocytes is nutrient dependent but independent of Akt, mitogen-activated protein kinase/extracellular sig-nal-regulated kinase kinase, insulin growth factor-I, and serum. Cancer Res.65:7800–7808.
17. Brunn, G.J., et al. 1996. Direct inhibition of the signaling functions of the mammalian target of rapamycin by the phosphoinositide 3-kinase
inhibitors, wortmannin and LY294002. EMBO J.
15:5256–5267.
18. Bhaskar, P.T., and Hay, N. 2007. The two TORCs and Akt. Dev. Cell.12:487–502.
19. Wullschleger, S., Loewith, R., and Hall, M.N. 2006.
TOR signaling in growth and metabolism. Cell.
124:471–484.
20. Manning, B.D. 2004. Balancing Akt with S6K: implications for both metabolic diseases and tumorigenesis. J. Cell Biol.167:399–403.
21. Martin, K.A., Schalm, S.S., Romanelli, A., Keon, K.L., and Blenis, J. 2001. Ribosomal S6 kinase 2 inhibi-tion by a potent C-terminal repressor domain is relieved by mitogen-activated protein-extracellular signal-regulated kinase kinase-regulated phos-phorylation. J. Biol. Chem.276:7892–7898. 22. Gulati, P., and Thomas, G. 2007. Nutrient sensing
in the mTOR/S6K1 signalling pathway. Biochem.
Soc. Trans.35:236–238.
23. Fan, Q.W. 2006. A dual PI3 kinase/mTOR inhibi-tor reveals emergent efficacy in glioma. Cancer Cell.
9:341–349.
24. Raynaud, F.I., et al. 2007. Pharmacologic character-ization of a potent inhibitor of class I phosphati-dylinositide 3-kinases. Cancer Res.67:5840–5850. 25. Chou, T.C. 2006. Theoretical basis, experimental
design, and computerized simulation of synergism and antagonism in drug combination studies.
Pharmacol. Rev.58:621–681.
26. Mohi, M.G., et al. 2004. Combination of rapamycin and protein tyrosine kinase (PTK) inhibitors for the
treatment of leukemias caused by oncogenic PTKs.
Proc. Natl. Acad. Sci. U. S. A.101:3130–3135. 27. Hu, Y., et al. 2006. Targeting multiple kinase
path-ways in leukemic progenitors and stem cells is essential for improved treatment of Ph+ leukemia in mice. Proc. Natl. Acad. Sci. U. S. A.103:16870–16875. 28. Engelman, J.A., Luo, J., and Cantley, L.C. 2006. The
evolution of phosphatidylinositol 3-kinases as reg-ulators of growth and metabolism. Nat. Rev. Genet.
7:606–619.
29. Ren, S.Y., Xue, F., Feng, J., and Skorski, T. 2005. Intrinsic regulation of the interactions between the SH3 domain of p85 subunit of phosphati-dylinositol-3 kinase and the protein network of
BCR/ABL oncogenic tyrosine kinase. Exp. Hematol.
33:1222–1228.
30. Guertin, D.A., and Sabatini, D.M. 2007. Defining the role of mTOR in cancer. Cancer Cell.12:9–22. 31. Ly, C., Arechiga, A.F., Melo, J.V., Walsh, C.M., and
Ong, S.T. 2003. Bcr-Abl kinase modulates the translation regulators ribosomal protein S6 and 4E-BP1 in chronic myelogenous leukemia cells via
the mammalian target of rapamycin. Cancer Res.
63:5716–5722.
32. Vanhaesebroeck, B., Ali, K., Bilancio, A., Geering, B., and Foukas, L.C. 2005. Signalling by PI3K isoforms: insights from gene-targeted mice. Trends Biochem. Sci.30:194–204.
33. Abraham, R.T., and Eng, C.H. 2008. Mamma-lian target of rapamycin as a therapeutic target in oncology. Expert Opin. Ther. Targets.12:209–222. 34. Sarbassov, D.D., Guertin, D.A., Ali, S.M., and
Saba-tini, D.M. 2005. Phosphorylation and regulation
of Akt/PKB by the rictor-mTOR complex. Science.
307:1098–1101.
35. Ju, X., et al. 2007. Akt1 governs breast cancer progression in vivo. Proc. Natl. Acad. Sci. U. S. A.
104:7438–7443.
36. Yu, Z., et al. 2007. Phosphorylation of Akt (Ser473) predicts poor clinical outcome in oropharyngeal squamous cell cancer. Cancer Epidemiol. Biomarkers Prev.16:553–558.
37. Brachmann, S.M., et al. 2005. Role of phospho-inositide 3-kinase regulatory isoforms in
devel-opment and actin rearrangement. Mol. Cell. Biol.