http://dx.doi.org/10.4236/fns.2015.64042
How to cite this paper: Folasire, O.F., Folasire, A.M. and Sanusi, R.A. (2015) Measures of Nutritional Status and Quality of Life in Adult People Living with HIV/AIDS at a Tertiary Hospital in Nigeria. Food and Nutrition Sciences, 6, 412-420. http://dx.doi.org/10.4236/fns.2015.64042
Measures of Nutritional Status and Quality
of Life in Adult People Living with HIV/AIDS
at a Tertiary Hospital in Nigeria
O. F. Folasire
1*, A. M. Folasire
2, R. A. Sanusi
11Department of Human Nutrition, College of Medicine, University of Ibadan, Ibadan, Nigeria 2Department of Radiotherapy, College of Medicine, University of Ibadan, Ibadan, Nigeria
Email: *yemisifolasire2011@gmail.com, ayofolayemisi@yahoo.com, sanusiadegoke2003@gmail.com
Received 28 February 2015; accepted 17 March 2015; published 23 March 2015
Copyright © 2015 by authors and Scientific Research Publishing Inc.
This work is licensed under the Creative Commons Attribution International License (CC BY).
http://creativecommons.org/licenses/by/4.0/
Abstract
Background & Aims: The study investigated the relationship between objective and subjective nu-tritional status parameters and quality of life in HIV seropositive patients. Methods: Retrospective review of clinic records of 150 HIV seropositive patients at a teaching hospital in Nigeria. Nutri-tional status was evaluated objectively with anthropometry including body mass index (BMI), subjectively with malnutrition universal screening tool (MUST) and subjective global assessment (SGA) tool. Data on quality of life (QOL) assessed with WHOQOL (Bref), and CD4 count were ex-tracted. Correlation analysis and linear regression were done to investigate the relationship be-tween variables, level of significance set at p < 0.05. Results: Only BMI has weak positive correla-tion with the psychological domain (r = 0.231, p < 0.05). MUST and SGA have significant negative correlations with most of the quality of life domains. MUST correlated with the following domains: physical; (r = −0.207), psychological; (r = −0.193) and environmental; (r = −0.132). While SGA correlated with the physical domain; (r = −0.2470) and psychological domain; (r = −0.337), p < 0.05 respectively. The CD4 count correlated with percentage body fat (r = 0.224), MUST (r =
−0.186) and SGA (r = −0.192), p < 0.05 respectively, but not with any of the QOL domains. Weight, MUST, SGA, percentage body fat were significant predictors of the percentage weight change in 6 months. Conclusions: BMI has significant positive association with psychological domain of QOL. MUST and SGA have significant negative association with certain domains. QOL did not predict short-term weight changes, as did the current weight, MUST, and SGA.
Keywords
Nutritional Status, Quality of Life, MUST, SGA, HIV/AIDS
1. Introduction
In chronic diseases like HIVAIDS, routine monitoring of nutritional status is paramount, as it delays the pro-gression of the disease and gives better treatment outcome. Prevalence of HIV-related malnutrition in adults in sub-Saharan Africa is estimated to range from 10 to 20% and weight loss is an important prognostic factor in HIV infection [1] [2]. The cost of monitoring response to antiretroviral is expensive, and patients often have to bear the cost in some health care facilities in Africa. Thus, necessitating awareness on the use of less expensive tools for nutritional status assessment in such settings. Measurement of weight, body fat, body mass index (BMI) and other anthropometric or body composition variables to assess nutritional status are objective because exact measurement is against a specified standard. Some other nutrition evaluation of patients’ is subjectively based on observer’s perception of dietary intakes and functionality. Such measures have both objective and subjective components, such as the Malnutrition Universal Screening Tool (MUST) and the Subjective Global Assessment (SGA) [3] [4].
Quality of life (QOL) also plays an important aspect in the overall care of PLWHA. World Health Organiza-tion (WHO) has defined QOL as an individuals’ percepOrganiza-tion of their posiOrganiza-tion in life in the context of their culture and value system in which they “live and in relation to their goals, standards, expectations and concerns” [5]-[7]. The 26-item WHOQOL-Bref, is a validated tool that measures quality of life in PLWHA in four different do-mains: 1) physical domain (assesses the individual’s perception of impact of disease on the activities of daily living, dependence on medication, lack of energy and initiative, restricted mobility and capacity to work); 2) psychological domain (assesses the individual’s satisfaction with thoughts about body image and appearance, negative feelings, positive feelings, self-esteem and personal beliefs); 3) social relations (assesses personal rela-tionships, social support and sexual activity); 4) environmental domain (assesses satisfaction with financial re-sources, work environment, accessibility to health and social care, freedom, security, participation and oppor-tunities for leisure activities) [8].
An important goal of therapy in HIV infection is to improve nutritional status, as well as quality of life. However, the relationship between nutritional status and quality of life is not well defined [7]. Person living with HIVAIDS (PLWHA) often develops gastrointestinal symptoms like change in taste, smell, nausea and vomiting resulting in reduced dietary intake. The pill burden and side effects of the highly active antiretroviral therapy (HAART) were associated with poor QOL [9]. PLWHA have been shown to have inadequate nutrient intakes, compromised nutritional status and reduced quality of life [10]-[12]. Only a few studies have described the rela-tionship between nutritional status and quality of life in PLWHA. Bhowmik et al., (2012) [7] reported im-provement in QOL upon maintenance of hemoglobin levels and conservation of muscle mass [7]. Some studies reported positive correlation between the quality of life scores and CD4 count [13]-[17], and nutritional status parameters like the weight, BMI, handgrip strength, haemoglobin, and mid-upper arm circumference [7]. As at the time of this review, no previous study reported relationship between subjective nutritional measures like MUST, SGA and QOL in PLWHA. These tools are quick, inexpensive validated measures of nutritional evalua-tion in PLWHA [3].
In other chronic diseases like cancer, it is well established that improvement in nutritional status translates to the improvement in QOL [18]-[20]. Improvement in nutritional status was in terms of improvement in SGA or MUST score and weight gained or lost. However, no consensus has been reached at the moment on the actual in-fluence that nutrition plays in quality of life in PLWHA [7]. The current study, thus aimed at further investigating the relationship between nutritional assessment parameters and quality of life in a cohort of HIV-seropositive pa-tients and identifying nutritional variables that best predicts weight loss.
2. Methods
2.1. Study Design and Population
A retrospective review of clinic record of 150 PLWHA who attended the antiretroviral clinic, University Col-lege Hospital (U.C.H.) Ibadan, Nigeria, West Africa. Period of review was June 2008-September 2008.
2.2. Study Technique
quality of life assessment. Retrieved data were used for nutritional status evaluation by the BMI, MUST, and SGA.
Nutrition status evaluation using BMI, MUST and SGA (Appendix)
Body mass index (BMI) for each respondent was calculated from clinic records of current weight (kg)/height (m)2. Current weight (kg) was the most recent weight in the record. Height in meters was from baseline record of each patient.
Nutritional status evaluation by the MUST was done in five steps according to BAPEN,(2003) [4]:
Step 1: BMI score was generated, BMI (kg/m2) > 20 (>30) = 0; BMI (kg/m2) 18.5 − 20 = 1; BMI (kg/m2) <18.5 = 2.
Step 2: weight loss score generation, unplanned weight loss (%) = current weight-weight in last 6 month × 100%. The % unplanned weight loss was then scored as <5% = 0; 5% to 10% = 1 and >10% = 2.
Step 3: determine acute disease effect, if acutely ill but no change in nutritional intake = 0; acutely ill with reduced nutritional intake = 1; acutely ill with no nutritional intake for >5 days = 2.
Step 4: Add up score in steps 1 + 2 + 3 and determine overall risk assessment as follows: MUST score 0 = low risk of malnutrition, MUST score of 1 = medium risk of malnutrition and MUST score > 2 = severe risk of malnutrition.
Step 5: plan and institute line of management (not done).
Nutritional status evaluation with the subjective global assessment tool (SGA) [21] [22]:
Thirteen variables were focus of the SGA evaluation using clinic record, namely; weight change in preceding 6 months and 4 weeks, overall change in dietary intake, dietary change duration from last clinic review (physi-cian’s subjective rating), type of dietary change (physi(physi-cian’s subjective rating), presence of GI symptoms, change in functional capacity, metabolic demand of HIV infection, subcutaneous loss of fat, muscle wasting and edema. Loss of subcutaneous fat was evaluated from record of physical examination degree of flabbiness of skin turgor over the triceps, biceps and the fat pad below the eyes. Muscle wasting was evaluated from record of examination of temples, clavicle and shoulder. A three-point scoring system was applied to the above 13 va-riables, such that A = 1 point, B = 2 points, C = 3 points and the mean SGA score was computed. The patients were also classified into three groups depending on the most frequent SGA options: A, B, and C for each varia-ble. Mainly As' = category A (not malnourished), mainly Cs' = category C (severe malnutrition) and the mixture of A and C = category B (mild to moderate malnutrition). Percentage body fat was determined by Durenberg’s formulae [23]. Data on quality of life previously assessed on the same cohort of PLWHA using WHO QOL (Bref) instrument was also extracted [24]. The 26-item WHOQOL-(Bref) questionnaire assessed four main do-mains; physical (PD), psychological (PsyD), social (SD) and environmental (ED) domains of quality of life. An overall assessment (OQOL) of satisfaction with life and opinion about health was assessed with the first two questions. Individual items were rated on 5 points Likert scale, with 1 indicating low or negative perception and 5 indicated high, positive perception of QOL. The QOL score were transformed according to the WHOQOL- (Bref) manual [7] [25]. The results were presented as a function of total transformed score of domain 0-100. Higher scores indicate better QOL perception [25].
2.3. Data Analysis
Statistical package for social sciences (SPSS) version 16.0 was used for data analysis. Descriptive statistics was used to report mean scores of quality of life domains. Correlation analysis was done to determine the relation-ship between the nutritional parameters and mean scores of domains of quality of life. For regression analysis, the dependent variable was percentage weight loss in 6 months; independent variables were the nutritional pa-rameters and quality of life domain scores of the participants. Using the enter mode in SPSS, linear regression was done to determine the best predictor of percentage weight change in 6 months, level of significance was set at p < 0.05. The weight, height and body mass index showed evidence of multi-collinearity and tolerance was <0.10 and variance inflation factor (VIF) was >10. As a result, BMI was removed from the model to handle the multicollinearity [26]. The study findings were part of a larger study involving the assessment of quality of life of people living with HIVAIDS attending the antiretroviral clinic, University College Hospital, Ibadan, Nigeria [24].
2.4. Ethical Consideration
3. Results
Of the 150 clinic record reviewed, only 120 HIV seropositive had complete clinic records for the evaluation of nutrition status with the SGA and MUST tools.
Mean age of the respondents was 38.0 ± 9.0 years (Table 1). The average weight of the respondents, 64.0 ± 1.6 kg, average height was 1.6 ± 0.7 m, Body mass index 24.5 ± 4.0 kg/m2. Average body fat percent 27.0 ± 7.0%, packed cell volume 34.0 ± 5.0% and CD4 count was 375.0 ± 192.0 cells/mm3. The average MUST score was 2.6 ± 1.4 while SGA was 10.7 ± 2.5. Male respondents were significantly older than the females (p = 0.000), had significantly higher weight, (p = 0.001), and were taller (p = 0.000) with higher packed cell volume (p = 0.000). However, the females had significantly higher CD4 count (p = 0.006) and SGA scores (p = 0.029) com-pared to the male respondents.
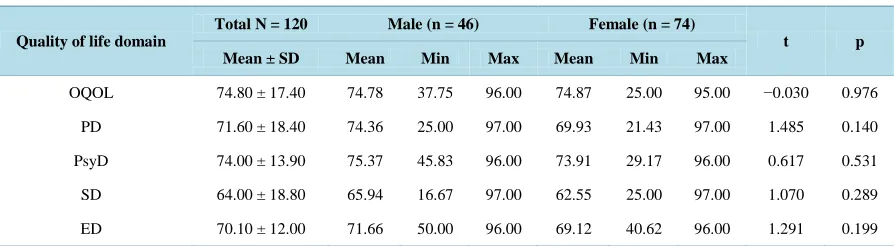
Mean domain scores of quality of life ranged from 64.0 to 74.0 respondents, with the poorest score from the social relations domain and the highest score from the psychological domain(Table 2). Overall assessment of Quality of life (OQOL) was about 75%. Male respondents had higher QOL scores in most domains compared to females but not statistically significant.
[image:4.595.93.539.349.543.2]Majority, 64 (53.3%) had normal BMI, only seven (5.8%) were underweight as classified by BMI, while 41 (34.2%) and 8 (6.7%) were classified overweight and obese (Table 3). All the HIV seropositive patients were at risk of malnutrition using the MUST, 91 (75.8%) had high risk of malnutrition, and 29 (24.2%) were classified at medium risk. Majority, 68 (56.7%) had no malnutrition and 52 (43.3%), had malnutrition stages B & C using the SGA.
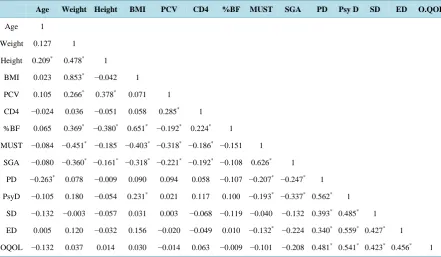
Table 4shows the correlation analysis of relationship between nutritional variables of respondents and QOL
Table 1. Anthropometric, hematological profiles, MUST and SGA scores of respondents based on sex.
Variable
Total N = 120 Male (n = 46) Female (n = 74)
t p
Mean ± SD Mean Min Max Mean Min Max
Age (years) 38.0 ± 9.0 41.0 27.0 67.0 36.0 20.0 56.0 3.424 0.001*
Weight (kg) 64.0 ± 1.6 68.5 50.0 106.0 62.1 36.0 97.0 3.417 0.001*
Height (m) 1.6 ± 0.0.7 1.7 1.6 1.9 1.6 1.5 1.8 6.449 0.000*
BMI (kg/m2) 24.5 ± 4.0 24.5 18.4 34.2 24.5 14.2 35.6 0.054 0.960
%BF 27.0 ± 7.0 21.0 13.0 34.0 31.0 17.0 46.0 −12.205 0.000*
PCV (%) 34.0 ± 5.0 36.0 27.0 48.0 33.0 20.0 42.0 3.646 0.000*
CD4 count (cells/mm3) 375.0 ± 192.0 322.0 34.0 959 410.0 15.0 1153 −2.784 0.006*
MUST score 2.6 ± 1.4 2.3 1.0 7.0 2.8 1.0 7.0 −0.938 0.368
SGA score 10.7 ± 2.5 10.0 7.0 13.0 11.0 7.0 15.0 −2.211 0.029*
BMI: body mass index; %BF: percentage body fat; PCV: packed cell volume; CD4: helper T cells; MUST: malnutrition universal screening tool; SGA: subjective global assessment.
Table 2. Mean quality of life domain scores of HIV seropositive patients based on sex, N = 120.
Quality of life domain
Total N = 120 Male (n = 46) Female (n = 74)
t p
Mean ± SD Mean Min Max Mean Min Max
OQOL 74.80 ± 17.40 74.78 37.75 96.00 74.87 25.00 95.00 −0.030 0.976
PD 71.60 ± 18.40 74.36 25.00 97.00 69.93 21.43 97.00 1.485 0.140
PsyD 74.00 ± 13.90 75.37 45.83 96.00 73.91 29.17 96.00 0.617 0.531
SD 64.00 ± 18.80 65.94 16.67 97.00 62.55 25.00 97.00 1.070 0.289
ED 70.10 ± 12.00 71.66 50.00 96.00 69.12 40.62 96.00 1.291 0.199
[image:4.595.92.539.586.709.2]Table 3. Nutritional status classification of the HIV seropositive patients based on BMI, MUST, and SGA.
Variable Frequency (n) %
WHO BMI classification (kg/m2)
< 18.5 (underweight) 7 5.8
18.5 to 24.9 (Normal) 64 53.3
25.0 to 29.9 (overweight) 41 34.2
30 and above (obese) 8 6.7
MUST Score risk
Low risk of malnutrition (score = 0) 0 0.0
Medium risk of malnutrition (score 1) 29 24.2
High risk of malnutrition (score ≥ 2) 91 75.8
SGA category
SGA A (no malnutrition) 68 56.7
SGA B (mild/moderate malnutrition) 37 30.8
SGA C (severe malnutrition) 15 12.5
Total (N) 120 100.0
Table 4. Correlation analysis between nutritional variables and quality of life domains.
Age Weight Height BMI PCV CD4 %BF MUST SGA PD Psy D SD ED O.QOL
Age 1
Weight 0.127 1
Height 0.209* 0.478* 1
BMI 0.023 0.853* −0.042 1
PCV 0.105 0.266* 0.378* 0.071 1
CD4 −0.024 0.036 −0.051 0.058 0.285* 1
%BF 0.065 0.369* −0.380* 0.651* −0.192* 0.224* 1
MUST −0.084 −0.451* −0.185 −0.403* −0.318* −0.186* −0.151 1
SGA −0.080 −0.360* −0.161* −0.318* −0.221* −0.192* −0.108 0.626* 1
PD −0.263* 0.078 −0.009 0.090 0.094 0.058 −0.107 −0.207* −0.247* 1
PsyD −0.105 0.180 −0.054 0.231* 0.021 0.117 0.100 −0.193* −0.337* 0.562* 1
SD −0.132 −0.003 −0.057 0.031 0.003 −0.068 −0.119 −0.040 −0.132 0.393* 0.485* 1
ED 0.005 0.120 −0.032 0.156 −0.020 −0.049 0.010 −0.132* −0.224 0.340* 0.559* 0.427* 1
OQOL −0.132 0.037 0.014 0.030 −0.014 0.063 −0.009 −0.101 −0.208 0.481* 0.541* 0.423* 0.456* 1
*
Pearson correlation is significant at <0.05. BMI: body mass index; PCV: packed cell volume; CD4: helper T cells; %BF: percentage body fat; MUST: malnutrition universal screening tool; SGA: subjective global assessment; PD: Physical domain; PsyD: Psychological domain; SD: Social domain; ED: Environmental domain; OQOL: overall quality of life
[image:5.595.90.532.387.644.2]CD4 count (r = −0.186, p = 0.042). SGA scores has significant negative correlation with weight (r = −0.360, p = 0.000), BMI (r = −0.318, p = 0.000), PCV (r = −0.221, p = 0.015) CD4 count (r = −0.192, p = 0.030). Both the MUST and SGA scores have significant negative correlations with most of the quality of life domains. MUST scores and PD (r = −0.207, p = 0.024), PsyD (r = −0.193, p = 0.036), ED (r = −0.224, p = 0.014) respectively. SGA and PD (r = −0.247, p = 0.007), PsyD (r = −0.337, p = 0.000), MUST and SGA have significant strong positive correlations (r = 0.626, p = 0.000). Only, the BMI showed some correlation with the psychological do-main QOL.
Table 5shows the current weight as the best significant predictor of percentage weight loss in the past six months, (β = 0.964, C.I = 1.080 to 1.541, p = 0.000). It makes the strongest unique contribution to explaining the percentage weight lost/gained in 6 months, when the variance explained by other variables in the model is con-sidered. Followed by SGA scores (β = −0.403, C.I = −0.2.146 to −1.101, p = 0.000), MUST scores, (β = 0.289, C.I = 1.749 to 4.775, p = 0.000), % body fat (β = −0.220, C.I = −0.817 to −0.133, p = 0.007) respectively.
4. Discussion
This study retrospectively evaluated nutritional status of a cohort of HIV-seropositive patients attending the an-tiretroviral clinic at a tertiary hospital in Nigeria. Period of review June 2008 to September 2008. It aimed at as-sessing the relationship between established objective and subjective measures of nutritional status with domains of quality of life of the respondents.
Nutritional status evaluation revealed prevalence of malnutrition (underweight) to be about 6% by BMI, de-spite more than 75% being at high risk of malnutrition with MUST > 2 and 43.3% SGA B & C. This finding is almost similar to the previous report [10].
In the study, BMI was the only objective nutritional parameter that had a significant correlation with the psy-chological QOL domain similar to previous reports [7] [27]. Psychological domain assesses satisfaction with body image and appearance. In the African setting, bigger body frame and weight is culturally acceptable and associated with good health and wealth status. The other objective nutritional measures like the weight, height, packed cell volume, CD4 count, body fat did not correlate with any of the QOL domains in contrast to the pre-vious report [7].
Table 5. Linear regression analysis.
Variable β t 95% C.I p
Age 0.003 0.051 −0.166 0.175 0.959
Current weight 0.964 11.260 1.080 1.541 0.000*
Height −0.193 −2.382 −7.081 −6.685 0.019*
PCV −0.062 −1.051 −0.595 0.183 0.296
CD4 count −0.036 −0.644 −0.012 0.006 0.521
% BF −0.220 −2.755 −0.817 −0.133 0.007*
MUST 0.289 4.274 1.749 4.775 0.000*
SGA −0.403 −6.157 −2.146 −1.101 0.000*
PD −0.107 −1.693 −0.187 0.015 0.093
Psy D 0.067 0.923 −0.081 0.221 0.358
SD −0.093 −1.573 −0.171 0.020 0.119
ED −0.046 −0.752 −0.210 0.094 0.454
Adjusted R2 = 0.725 F = 26.755 p = 0.000
*
The overall quality of life assessed satisfaction with life and health generally. The relatively good scores by respondents compared to the normative population may suggest that individuals with serious illness such as AIDS adjust their expectations of life and thus view their QOL somewhat positively [25] [28]. The overall qual-ity of life of the HIV seropositive patients, correlated positively with all the other four domains, in agreement with Anande and colleagues [27]. However, it did not correlate with either objective or subjective measures of nutritional status as was previously reported [7]. Different domains of QOL showed a negative correlation with subjective nutritional evaluation tools, the MUST, and SGA, the association was only significant in the physical, psychological and environmental domain. There is a paucity of literature to compare the finding.
CD4 count showed no correlation with any of the QOL domains in contrast to previous reports [27] [13]. However, CD4 count has weak but significant association with MUST and SGA similar to a previous study [29].
The regression analysis revealed that the degree of weight change was predicted by, the current weight, MUST, SGA and percentage body fat and not by CD4 count or any of the quality of life domains.
Strength of the study: the study confirmed use of MUST and SGA retrospectively evaluate nutritional status from existing clinic records of PLWHA. Another strength of the study is that the model explained 72.5% of the variations in the weight over a six months period (adjusted R2 = 0.725, F = 26.755, p = 0.000).
Limitation of Study: the retrospective design was time-consuming to manually extracting details of patient’s previous records necessary for use with MUST and SGA. However, a statistical command was used to extract this information from the clinic database.
5. Conclusion
BMI has significant positive association with psychological domain of QOL. MUST and SGA have significant negative association with certain domains. QOL did not predict short-term weight changes, as did the current weight, MUST and SGA. However, longitudinal assessment of both the nutritional parameters and QOL is needed in future studies in PLWHA for better understanding of the relationship between the MUST, SGA and quality of life in PLWHA.
Acknowledgements
Authors acknowledge all the HIV seropositive patient used in the study. Prof. I.F.A. Adewole and Dr. A.E. Ira-bor for approval of study. Prof. David Olaleye for access to clinic data. All APIN clinic staff for rendering one support or the other during retrieval of data.
References
[1] Uthman, O.A. (2008) Prevalence and Pattern of HIV-Related Malnutrition among Women in Sub-Saharan Africa: A Meta-Analysis of Demographic Health Surveys. BMC Public Health, 8, 226.
http://www.biomedcentral.com/1471-2458/8/226
[2] Koethe, J.R., Chi, B.H., Megazzini, K.M., Heimburger, D.C. and Stringer, J.S.A. (2011) Macronutrient Supplementa-tion for Malnourished HIV-Infected Adults: A Review of the Evidence in Resource-Adequate and Resource-Cons- trained Settings. Clinical Infectious Disease, 49, 787-798. http://dx.doi.org/10.1086/605285
[3] Nerad, J., Romeyn, M., Silverman, E., Allen-reid, J., Dieterich, D., Merchant, J., et al. (2003) General Nutrition Man-agement in Patients Infected with Human Immunodeficiency Virus. Clinical Infectious Disease, 36, S52-S62. http://dx.doi.org/10.1086/367559
[4] British Association of Parenteral and Enteral Nutrition (BAPEN) (2003) The “MUST” Explanatory Booklet: A Guide to the “Malnutrition Universal Screening Tool” (“MUST”) for Adults. British Association for Parental and Enteral Nu-trition, Redditch.
[5] Skevington, S.M., Lotfy, M. and Connell, K.A.O. (2004) The World Health Organization’s WHOQOL-BREF Quality of Life Assessment: Psychometric Properties and Results of the International Field Trial a Report from the WHOQOL Group, 299-310.
[6] Saxena, S., Carlson, D. and Billington, R. (2001) WHOQOL Group: The WHO Quality of Life Assessment Instrument ( WHOQOL-Bref ): The Importance of Its Items for Cross-Cultural Research. Quality of Life Research, 10, 1171592. http://dx.doi.org/10.1023/A:1013867826835
[8] Hsiung, P., Fang, C., Chang, Y., Chen, M. and Wang, J. (2005) Comparison of WHOQOL-BREF and SF-36 in Pa-tients with HIV Infection. Quality of Life Research, 14, 141-150. http://dx.doi.org/10.1007/s11136-004-6252-z
[9] Bello, S.I. and Bello, I.K. (2013) Quality of Life of HIV/AIDS Patients in a Secondary Health Care Facility, Ilorin, Nigeria. Baylor Universit Medical Center Proceedings, 116-119.
[10] Hu, W., Jiang, H., Chen, W., He, S., Deng, B., Wang, W., et al. (2011) Malnutrition in Hospitalized People Living with HIV/AIDS : Evidence from a Cross-Sectional Study from Chengdu, China. Asia Pacific Journal of Clinical Nutri-tion, 20, 544-550.
[11] Suttajit, M. (2007) Advances in Nutrition Support for Quality of Life in HIV/AIDS. Asia Pacific Journal of Clinical
Nutrition, 16, S318-S322.
[12] Burgin, J., Nicholas, S. and Dalrymple, N. (2008) The Nutritional Status of Clinic Attendees Living with HIV/AIDS in St Vincent and the Grenadines. West Indian Medical Journal, 57, 438-443.
[13] Venter, E., Gericke, G.J. and Bekker, P.J. ( 2009) Nutritional Status, Quality of Life and CD4 Cell Count of Adults Living with HIV/AIDS in the Ga-Rankuwa Area (South Africa). South African Journal of Clinical Nutrition, 22, 124- 129.
[14] Giri, S., Neupane, M., Pant, S., Timalsina, U., Koirala, A.S. and Sharma, S. (2013) Quality of Life among People Living with Acquired Immune Deficiency Syndrome Receiving Anti-Retroviral Therapy: A Study from Nepal. HIV/AIDS-
Research Palliative CARE, 3, 277-282.
[15] dos Santos, C.E., Fraca Jr., J.I. and Lopes, F. (2007) Quality of Life of People Living with HIV/AIDS in São Paulo, Brazil. Review Saude Publication, 41, S1-S7.
[16] Nirmal, B., Divya, K.R., Dorairaj, V.S. and Venkateswaran, K. (2008) Quality of Life in HIV/AIDS Patients: A Cross-Sectional Study in South India. Indian Journal of Sexual Transmitted Disease, 29, 15-17.
http://dx.doi.org/10.4103/0253-7184.42708
[17] Kumar, A., Girish, H., Nawaz, A., Balu, P. and Kumar, B. (2014) Determinants of Quality of Life among People Liv-ing with HIV/AIDS: A Cross Sectional Study in Central Karnataka, India. International Journal of Medical Science
Publication, 3, 1413-1417. http://www.scopemed.org/?mno=165368
[18] Isenring, E.A., Capra, S. and Bauer, J.D. (2004) Nutrition Intervention Is Beneficial in Oncology Outpatients Receiv-ing Radiotherapy to the Gastrointestinal or Head and Neck Area. British Journal of Cancer, 91, 447-452.
http://www.pubmedcentral.nih.gov/http://dx.doi.org/10.1038/sj.bjc.6601962
[19] Isenring, E.A., Bauer, J. and Capra, S. (2003) The Scored Patient-Generated Subjective Global Assessment (PG-SGA) and Its Association with Quality of Life in Ambulatory Patients Receiving Radiotherapy. European Journal of Clinical
Nutrition, 57, 305-309. http://dx.doi.org/10.1038/sj.ejcn.1601552
[20] Lis, C.G., Gupta, D., Lammersfeld, C.A., Markman, M. and Vashi, P.G. (2012) Role of Nutritional Status in Predicting Quality of Life Outcomes in Cancer—A Systematic Review of the Epidemiological Literature. Nutrition Journal, 11, 2-18. http://dx.doi.org/10.1186/1475-2891-11-27
[21] Makhija, S. and Baker, J. (2008) The Subjective Global Assessment: A Review of Its Use in Clinical Practice.
Nutri-tion in Clinical Practice, 23, 405-409. http://dx.doi.org/10.1177/0884533608321214
[22] Tapiawala, S., Vora, H., Patel, Z., Badve, S. and Shah, B. (2006) Subjective Global Assessment of Nutritional Status of Patients with Chronic Renal Insufficiency and End Stage Renal Disease on Dialysis. Journal of the Association of
Phy-sicians of India, 54, 923-926.
[23] Deurenberg, P., Weststrate, J.A. and Seidell, J.C. (1991) Body Mass Index as a Measure of Body Fatness: Age- and Sex-Specific Prediction Formulas. British Journal of Nutrition, 65, 105-114. http://dx.doi.org/10.1079/BJN19910073
[24] Folasire, O.F., Irabor, A.E. and Folasire, A.M. (2012) Quality of Life of People Living with HIV and AIDS Attending the Antiretroviral Clinic, University College Hospital, Nigeria. African Journal of Primary Health Care & Family
Medicine, 4, 1-8. http://www.phcfm.org/index.php/phcfm/article/view/294
[25] World Health Organisation (1997) WHOQOL-BREF Scoring Guide.
[26] Pallant, J. (2005) SPSS Survival Manual. 2nd Edition, Open University Press, Berkshire.
[27] Anand, D., Puri, S. and Mathew, M. (2012) Assessment of Quality of Life of HIV-Positive People Receiving ART: An Indian Perspective. Indian Journal of Community Medicine, 37, 165-169. http://dx.doi.org/10.4103/0970-0218.99918
[28] Friedland, J., Renwick, R. and McColl, M. (1996) Coping and Social Support as Determinants of Quality of Life in HIV/AIDS. AIDS Care, 8, 15-31. http://dx.doi.org/10.1080/09540129650125966
[29] Linares Guerra, E.M., Santana, P.S., Carrilo, F.O., Leon Sanchez, M.A., Sanabria Negrin, J.G., Acosta Nunez, N., et al.
(2013) Nutritional Status of the Persons Living with HIV/AIDS, Its Relationship with T CD4 + Cells Count. Nutrition
Appendix
Questionnaire for nutritional status evaluation and quality of life in PLWHA at the University College Hospital, Ibadan, Nigeria
Nutrition status evaluation: 1) Body Mass Index (BMI):
BMI (kg/m2) = Most recent weight (kg)/height (m2) 2) Malnutrition Universal Screening Tool (MUST):
It involves five “MUST” steps:
MUST STEP Possible outcome Interpretation/Score
1) Calculate body mass index (BMI) from weight and height
Kg/m2
BMI > 20(>30 Obese) 18.5 - 20.0
<18.5
Score =0 =1 =2
2) Determine unplanned weight loss (%) in past 3 - 6 months
% <5 5 - 10
>10
Score =0 =1 =2
3) Consider the effect of acute disease:
-acutely ill but no change in nutritional intake -acutely ill with reduced nutritional intake -acutely ill with no nutritional intake for >5 days
=0 =1 =2
4) Add scores from a + b + c = overall risk of malnutrition
Total Score =0 =1 =2 or >
Interpretation Low risk Medium risk
High risk
5) Initiate appropriate nutritional management
3) Subjective Global Assessment (SGA) Tool
SGA Options A = 1 point B = 2 points C = 3 points
1. Weight change in last 6 months A: <5% B: 5% - 10% C: >10%
2. Weight change in last 4 weeks A: Increased B: Unchanged C: Decreased
3. Dietary intake overall change A: Increased B: Unchanged C: Decreased
4. Dietary change duration from last review (in weeks or
months) Clinician’s subjective rating A: Increased B: Unchanged C: Decreased
5. Type of Dietary change. Clinician’s subjective rating A: Solid in re-duced quantity
B: Semi-solid diet/
Liquid diet C: Intravenous fluid
6. Gastrointestinal symptoms persisting > 2 weeks (Clini-cian’s subjective rating): Symptoms: Anorexia, Nausea,
Vomiting, Diarrhoea
A (none/normal) B (mild/moderate): hav-ing some symptoms
C (severe): having most of the symptoms
7. Functional capacity overall impairment A: none (Ambulating)
B: mild/moderate Bedridden > 1/2 of day
C: severe Bedridden > whole
day
8. Metabolic demand of HIV on nutritional
require-ment( considering current symptoms and signs) A = No stress B = Low/moderate stress C = Severe stress
Physical: Physicians subjective assessment, for each trait specify: 0 = normal, 1 = mild, 2 = moderate, 3 = severe a)loss of subcutaneous fat (chest, zygomatic bone prominence)... b) ankle edema... c) muscle wasting (prominent clavicle, and shin bones)... d) sacral edema... e) ascites...
SGA rating: Well nourished Moderately malnou-rished