http://dx.doi.org/10.4236/pp.2014.512119
Effects of Vitamin K-1 and Menaquinone-7
on Vascular Function and Blood Pressure
in Warfarin-Induced Calcification-Model
in Rats
Aino Siltari
1, Niko Wickholm
1, Anne S. Kivimäki
1, Kaisa Olli
2, Krista Salli
2,
Kirsti Tiihonen
2, Riitta Korpela
1, Heikki Vapaatalo
11Institute of Biomedicine, Pharmacology, University of Helsinki, Helsinki, Finland 2DuPont Nutrition and Health, Kantvik Active Nutrition, Kantvik, Finland
Email: aino.siltari@helsinki.fi
Received 24 September 2014; revised 15 October 2014; accepted 30 October 2014
Academic Editor: Shengyong Yang, Sichuan University, China
Copyright © 2014 by authors and Scientific Research Publishing Inc.
This work is licensed under the Creative Commons Attribution International License (CC BY).
http://creativecommons.org/licenses/by/4.0/
Abstract
Keywords
Vascular Calcification, Vitamin K-1, Menaquinone-7, Blood Pressure, Vascular Function
1. Introduction
Vascular calcification, the extracellular deposition of calcium in the vascular wall, occurs in relation to a number of vascular disorders, including vascular smooth muscle apoptosis and endothelial dysfunction. It may also lead to more severe cardiovascular diseases like hypertension and atherosclerosis [1].
Vascular calcification is inversely correlated with vitamin K-2 (menaquinone, MK) intake in humans [2]-[4]. Therefore, warfarin-induced calcification in rats may offer a potential model for testing the possible actions of vitamin K-1 (K-1) and MK on vascular function.
Several weeks of warfarin treatment has been shown to induce artery wall (elastic lamellae) and heart valves calcification [5]-[12] in experimental models. This phenomenon is not related to anticoagulation or decreased activity of factors II, VII, IX, X, or protein C and S. In addition to these vitamin K-dependent proteins produced in the liver, there are a number of extra-hepatic vitamin K-dependent proteins including matrix Gla protein (MGP), a 10-kDA protein that contains five residues of the vitamin K-dependent calcium binding amino acids, gamma-carboxylglutamic acid (Gla). Other vitamin K-dependent proteins include osteocalcin, nephrocalcin, plaque Gla protein, growth arrest specific gene 6 (Gas 6) and proline rich Gla proteins [13]. Reduced carboxyla-tion of these proteins is likely to be an unavoidable side-effect of warfarin therapy. MGP knockout mice develop severe calcification of the arterial system suggesting that MGP normally prevents this process [14]. Warfarin seems to inhibit the activation of MGP and therefore causes vascular calcification in animal models [15] [16].
The aim of the present study was to investigate the effects of K-1 and menaquinone-7 (MK-7) on vascular calcification in an animal model and to test the suitability of the warfarin model for this purpose. Blood pressure, vascular function and basic clinical chemistry monitoring widened our knowledge on the long-term effects of the warfarin alone or together with vitamin K-1 or MK-7 treatments.
2. Materials and Methods
2.1. Diets and Animals
Male Wistar-Kyoto rats (WKY) (10 weeks old, weight 242 - 245 g, purchased from Scanbur Ab, Sollentuna, Sweden), with free access to tap water and irradiated (0.9 Mrad) vitamin K-deficient diet (Harlan, Venray, The Netherlands), were randomized based on systolic blood pressure value and weight into four groups of 10 ani-mals (housed five in a gage) in a standard experimental laboratory (illuminated from 7 am to 7 pm, humidity 55% ± 15%, temperature 22˚C ± 2˚C). The protocol was approved by National Animal Experimentation Com-mittee of Finland according to EC Directive 86/609/ECC and Finnish Experimental Animal Act 62/2006.
The warfarin-induced calcification model and diets were used as reported earlier [7] [8]:
Groups were as follows: Healthy control group (H-C) received vitamin K-deficient diet containing K-1 (Merck, Darmstadt, Germany) 5 µg/g feed (which is normal K-1 level in a standard rodent diet in Harlans diets). Warfarin control group (W-C) received 3 mg of warfarin/g feed and 1.5 mg K-1/g feed. Vitamin K-1 group (K-1) received 3 mg of warfarin/g feed 1.5 mg K-1/g feed with simultaneous administration of K-1 (in total 2 - 3 mg/g feed). Menaquinone-7 group (MK-7) received 3 mg of warfarin/g feed and 1.5 mg K-1/g feed with simultaneous administration of MK-7 (100 µg/g feed) (generous gift from Kappa Bioscience, Oslo, Norway) (Table 1). The rat strain, sex and age as well as the warfarin doses and treatment period were based on previous studies [5]-[8].
Table 1. Vitamin K-1, warfarin and menaquinone-7 (MK-7) content in the feed (mg/g feed) and daily intake of vitamin K-1, warfarin, and MK-7 (calculated per rat) during the five-week study-period. Mean ± SEM, n = 10.
Content per gram feed (mg/g):
Vitamin K-1 Warfarin MK-7
Healthy control 0.01 - -
Vitamin K-1 group 2.0 - 3.0 3.00 -
Menaquinone-7 group 1.50 3.00 0.10
Warfarin control 1.50 3.00 -
Daily intake (mg/rat):
Vitamin K-1 Warfarin MK-7
Healthy control 0.16 ± 0.01 - -
Vitamin K-1 group 70.9 ± 9.4 92.2 ± 6.0 -
Menaquinone-7 group 43.5 ± 1.4 87.0 ± 2.8 2.91 ± 0.1
Warfarin control 49.2 ± 1.7 98.4 ± 3.5 -
2.2. Blood Pressure Measurements
Blood pressure and heart rate measurements (CODA-program, Kent Scientific Corporation, Torrington, CT, USA) were carried out weekly by an automatic tail-cuff method by the same person (AS) at the same time of day. Rats were pre-warmed at 32˚C for 10 - 15 min before measurements. Blood pressure and heart rate mea-surement were repeated 20 times (each rat) and systolic blood pressure (SBP), diastolic blood pressure (DBP) and heart rate were calculated as the mean of the measurements accepted by the CODA program (at least 5 ac-cepted measurements).
2.3. Sample Collection
After 5 weeks, rats were killed with isoflurane gas (5%) and blood was collected by heart puncture and placed in clot Act z containing and silicon coated tubes (Venosafe, Terumo, Lueven, Belgium), centrifuged at 4˚C and 3000 g for 10 min after serum was collected, and kept at −80˚C until further analysis. Urine samples were col-lected from bladder puncture and kept at −80˚C. Weights of the heart, left ventricle, and left kidney were meas-ured. Parts of the descending aorta were fixed in neutral buffered 10% formaldehyde (Sigma-Aldrich) and after 48 h placed in 70% ethanol and embedded in paraffin for further histological studies. Mesenteric arteries and the lower part of the descending aorta was placed in pre-oxygenated (O2/CO2 95%/5%, AGA, Riihimäki, Finland)
ice-cold Krebs buffer (pH 7.4 - 7.6, composition in mM: NaCl 119.0, NaHCO3 25.0, glucose 11.1, KCl 4.7,
CaCl2 1.6, KH2PO4 1.2, MgSO4 1.2).
2.4. Vascular Reactivity Studies
Changes in vascular tone and endothelial function were studied in standard organ bath chambers with a compu-terized system (EMKA Technologies, Paris, France). Endothelium-intact mesenteric artery rings and descending aorta rings without adherent connecting tissue were hooked with stainless steel hooks (diameter 0.1 mm for me-senteric arteries and 0.2 mm for aortas), placed in oxygenated Krebs buffer in organ bath chambers (10 ml, 37˚C), and vascular reactivity was studied using vasoconstricting and vasodilating drugs.
pur-chased from Sigma-Aldrich.
2.5. Clinical Chemistry Measurements
Routine clinical chemistry (ADVIA 1650 Chemistry System, Siemens Healthcare Diagnostics Inc., Deerfield, IL, USA) was used to detect electrolytes (K+, Na+, Cl−, and Ca2+), albumin, glucose, urea, total protein, inorganic phosphate, and creatinine from urine and serum. Also, alanine aminotransferase, alkaline phosphatase, aspartate transaminase, creatine kinase, total bilirubin, high-density lipoprotein (HDL), low-density lipoprotein (LDL), triglycerides, and total cholesterol were measured from serum using the same multichannel analyser.
2.6. Blood Coagulation Measurements
Prothrombin time (INR, international normalized ratio) was determined using the standardized technique (Goa-guChek XS System-instrument and Guagu Chek XS PT Test, Roche Diagnostic, Mannheim, Germany).
2.7. Histological Staining
Possible aortic calcification was evaluated from histology samples using Alizarin Red S and von Kossa stainings. In von Kossa staining, nuclear fast red (Merck, Darmstadt, Germany) was used as a counterstain. Paraffin-em- bedded samples samples (n = 6 - 8 each group) were cut longitudinally into serial sections of 6 - 7 µm with mi-crotome (several sections per sample). After deparaffinization and hydration the tissue sections were stained us-ing 1.1% Alizarin Red S solution (AppliChem, Kongens Lyngby, Denmark) (pH 4.2 adjusted with 0.5% ammo-nium hydroxide) or with 5% silver nitrate solution (Sigma-Aldrich) (1 hour incubation in bright light). After dehydration, the samples were mounted with DePex mounting medium (VWR international, Leicestershire, England) and analyzed by light microscope (Leica Microsystems, Wetzlar, Germany).
2.8. Statistical Analyses
All the measurements and statistical evaluations were performed blinded. The results are presented as mean ± SEM. Statistical analyses were performed using GraphPad Prism software (version 4.02). One way analysis of variances (ANOVA) followed Tukey multiple comparison tests were used to compare different groups. Differ-ence was considered significant if p-value < 0.05.
3. Results
3.1. Body and Organ Weights, Feed and Water Consumption
Table 1 illustrates the daily dosing of feed, water, vitamin K-1, warfarin and MK-7 in different groups during 5 weeks’ study period. Warfarin-treatment influenced the development of body weight.
The healthy control group (H-C) was heavier than the other groups (p < 0.01) and thus, kidney, heart and left ventricle (all related to body weight) were smaller compared to the warfarin-treated groups (Table 2) (p < 0.01 for kidney). There were no differences in feed consumption between the groups, thus, the higher body weight of the healthy group cannot be explained by that (Table 2). Warfarin-treated rats consumed more water than the healthy controls (p < 0.01). There were no significant differences in fluid consumption between three warfarin consumed groups (Table 2).
3.2. Blood Pressure and Heart Rate
There were no differences in systolic or diastolic blood pressure or heart rate of the rats during the intervention. Different baseline values were taken into account in statistical tests. Warfarin-treatment did not influence blood pressure or heart rate (Figure 1).
3.3. Prothrombin Time
Table 2. Daily water (ml) and feed (g) consumption per rat and body mass (g) and the weight of kidney, heart, and left ventricle related to body mass (mg/g) of the rats. Mean ± SEM, n = 9 - 10.
Water Feed Body mass
Healthy control 17 ± 1* 32 ± 1 398 ± 6*
Vitamin K-1 group 25 ± 1 31 ± 2 320 ± 7
Menaquinone-7 group 24 ± 2 29 ± 1 324 ± 4
Warfarin control 24 ± 1 33 ± 1 341 ± 6
Kidney Heart Left ventricle
Healthy control 3.37 ± 0.05* 2.58 ± 0.04 2.03 ± 0.03
Vitamin K-1 group 3.66 ± 0.05 2.71 ± 0.03 2.12 ± 0.04
Menaquinone-7 group 3.70 ± 0.08 2.70 ± 0.04 2.07 ± 0.04
Warfarin control 3.70 ± 0.05 2.74 ± 0.06 2.12 ± 0.03
*
[image:5.595.94.510.114.581.2]Healthy vs. others p < 0.01.
Figure 1. Systolic blood pressure (SBP), diastolic blood pressure (DBP), and
heart rate during the five-week intervention with warfarin and vitamin-K deri- vatives and area under curve (AUC) calculated from the data of the left panel. H-C = Healthy control, K-1 = Vitamin K-1, MK-7 = Menaquinone-7 and W-C = Warfarin control. Mean ± SEM, n = 10 in each group.
3.4. Vascular Function
Vascular function was measured using endothelium-intact rings of mesenteric artery (small vessel) and aorta (large vessel).
[image:5.595.166.456.270.578.2]INR
B A B A B A B A
0.0 0.1
H-C K-1 MK-7 W-C
0.8 0.9 1.0 1.1 1.2 IN R val u e
Figure 2. INR values before (B) and after (A) the intervention. H-C =
Healthy control, K-1 = Vitamin K-1, MK-7 = Menaquinone-7, W-C = War- farin control. Mean ± SEM, n = 5 in each group.
KCl 60 mM contraction Mesenteric artery 0.00 0.25 0.50 0.75 1.00 * cont ract ion g
KCl 60 mM contraction Aorta 0.00 0.25 0.50 0.75 1.00 1.25 1.50 1.75 c ont ra c ti o n g PE contraction Mesenteric artery
H-C K-1 MK -7 W-C 0.00 0.25 0.50 0.75 1.00 c o nt ra ct ion g PE contraction Aorta
H-C K-1 MK -7 W-C 0.00 0.25 0.50 0.75 1.00 1.25 1.50 1.75 c ont ra c ti on g
Figure 3. KCl- and phenylephrine (PE)-induced contractions in mesenteric
arteries and in aortas after five-week intervention. H-C = Healthy control, K-1 = Vitamin K-1, MK-7 = Menaquinone-7 and W-C = Warfarin control. Mean ± SEM, n = 7 - 10. *p < 0.05.
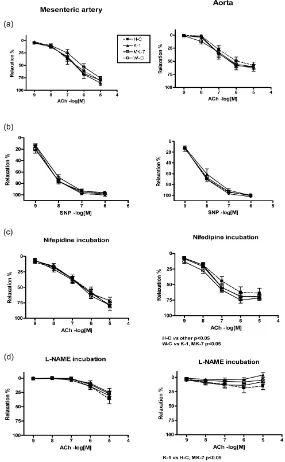
In Figure 4, the endothelium-dependent and -independent relaxations in mesenteric arteries and aorta are shown. Endothelium-dependent vasorelaxation was recorded using acetylcholine (ACh) cumulatively. In the warfarin control group (W-C) relaxation was slightly reduced. In aortas of the healthy group (H-C) relaxation was the smallest (Figure 4(a)), however, the difference was not statistically significant. There were no differ-ences in sodium nitroprusside (SNP)-induced endothelium-independent vasorelaxation (Figure 4(b)), indicating normal smooth muscle function. L-type calcium-channels were blocked using nifepidine (Figure 4(c)). In me-senteric arteries there were no differences between the groups. The best relaxation was seen in the aortas of warfarin control group (W-C) and the worst in the healthy controls (H-C).The relaxation of MK-7 and K-1 groups was between the W-C and H-C groups (H-C vs. other groups p < 0.05) (Figure 4(c)).
Inhibition of nitric oxide synthatase (NOS) with L-NAME in mesenteric artery relaxation reduced similarly ACh relaxation in all treatment groups (Figure 4(d)). The blockade was not total leaving about 25% relaxation obviously related to endothelial prostacyclin and endothelium-derived hyperpolarizing factor (EDHF) produc-tion. In aortas, the healthy controls and the MK-7 group showed some relaxation even after NOS inhibition, while in the two other groups no relaxation to ACh was seen, indicating nitric oxide’s main role in endothelium dependent relaxation (H-C vs. vitamin K-1 p < 0.01) (Figure 4(d)).
3.5. Vascular Calcification
[image:6.595.227.397.96.178.2] [image:6.595.174.457.223.447.2]Figure 4. Acetylcholine-induced (ACh) (endothelium-dependent) (a) and sodium nitropruside-induced (SNP) (endothelium-independent) (b) relaxation after phenylephrine (PE) contraction of mesenteric artery (left column) and aorta (right column) rings. The role of L-type calcium channels (c) and nitric oxide (d) was studied using inhibitors (nifedipine and L-NAME, respec- tively). H-C = Healthy control, K-1 = Vitamin K-1, MK-7 = Menaquinone-7 and W-C = Warfarin control. Mean ± SEM, n = 7 - 10.
Kossa stainings. For some reason, systemic vascular calcification formed only in two warfarin-treated samples. It seems that the warfarin model did not work as expected based on the results from two histological staining methods for calcium detection: Alizarin Red S and von Kossa (Data not shown, n = 6 - 8 in each group).
3.6. Clinical Chemistry
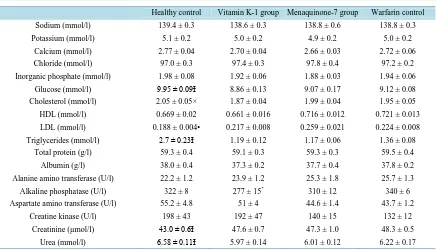
[image:7.595.170.455.87.549.2]urea were reduced and the creatinine concentration was increased in the all warfarin-treated groups compared to the healthy controls. Alkaline phosphatase levels were decreased in the K-1 group vs. the healthy and warfarin control groups. Low density lipopolysaccharide (LDL) was decreased and total cholesterol increased in the healthy group. There were no differences in high density lipopolysaccharide (HDL) levels between the groups.
Clinical chemistry analysis from urine samples related to creatinine values is shown in Table 4. There were no significant differences between the groups, except urea levels were slightly higher in the warfarin-treated groups (p < 0.05). In addition, glucose and albumin excretions were somewhat elevated but not statistically sig-nificantly in the warfarin groups. Urine samples were collected with bladder puncture after sacrifice and there-fore are not as reliable as from 24 h collection.
4. Discussion
[image:8.595.103.539.269.519.2]In the present study we have investigated the blood pressure and vascular effects of vitamin K-1 and menaqui-none-7 in an animal model of vascular calcification induced by warfarin in young Wistar-Kyoto rats. We used
Table 3. Clinical chemistry parameters from serum samples. Mean ± SEM, n = 9 - 10.
Healthy control Vitamin K-1 group Menaquinone-7 group Warfarin control
Sodium (mmol/l) 139.4 ± 0.3 138.6 ± 0.3 138.8 ± 0.6 138.8 ± 0.3
Potassium (mmol/l) 5.1 ± 0.2 5.0 ± 0.2 4.9 ± 0.2 5.0 ± 0.2
Calcium (mmol/l) 2.77 ± 0.04 2.70 ± 0.04 2.66 ± 0.03 2.72 ± 0.06
Chloride (mmol/l) 97.0 ± 0.3 97.4 ± 0.3 97.8 ± 0.4 97.2 ± 0.2
Inorganic phosphate (mmol/l) 1.98 ± 0.08 1.92 ± 0.06 1.88 ± 0.03 1.94 ± 0.06
Glucose (mmol/l) 9.95 ± 0.09Ɨ 8.86 ± 0.13 9.07 ± 0.17 9.12 ± 0.08
Cholesterol (mmol/l) 2.05 ± 0.05× 1.87 ± 0.04 1.99 ± 0.04 1.95 ± 0.05
HDL (mmol/l) 0.669 ± 0.02 0.661 ± 0.016 0.716 ± 0.012 0.721 ± 0.013
LDL (mmol/l) 0.188 ± 0.004• 0.217 ± 0.008 0.259 ± 0.021 0.224 ± 0.008
Triglycerides (mmol/l) 2.7 ± 0.23Ɨ 1.19 ± 0.12 1.17 ± 0.06 1.36 ± 0.08
Total protein (g/l) 59.3 ± 0.4 59.1 ± 0.3 59.3 ± 0.3 59.5 ± 0.4
Albumin (g/l) 38.0 ± 0.4 37.3 ± 0.2 37.7 ± 0.4 37.8 ± 0.2
Alanine amino transferase (U/l) 22.2 ± 1.2 23.9 ± 1.2 25.3 ± 1.8 25.7 ± 1.3
Alkaline phosphatase (U/l) 322 ± 8 277 ± 15* 310 ± 12 340 ± 6
Aspartate amino transferase (U/l) 55.2 ± 4.8 51 ± 4 44.6 ± 1.4 43.7 ± 1.2
Creatine kinase (U/l) 198 ± 43 192 ± 47 140 ± 15 132 ± 12
Creatinine (µmol/l) 43.0 ± 0.6Ɨ 47.6 ± 0.7 47.3 ± 1.0 48.3 ± 0.5
Urea (mmol/l) 6.58 ± 0.11Ɨ 5.97 ± 0.14 6.01 ± 0.12 6.22 ± 0.17
*K-1 vs. H-C and W-C p < 0.05; Ɨ H-C vs. all other groups p < 0.05; •H-C vs. MK-7 p < 0.01; × H-C vs. K-1 p < 0.01.
Table 4. Clinical chemistry parameters from urine samples. Mean ± SEM, n = 9 - 10. × All parameters were related to crea-
tinine values.
Healthy control Vitamin K-1 group Menaquinone-7 group Warfarin control
Sodium 15.1 ± 2.8 17.5 ± 4.2 17.1 ± 2.9 14.4 ± 2.3 Potassium 11.3 ± 1.1 11.7 ± 1.2 8.1 ± 1.5 10.0 ± 1.7
Calcium 0.216 ± 0.03 0.207 ± 0.019 0.279 ± 0.067 0.319 ± 0.084 Chloride 10.9 ± 1.3 15.4 ± 4.2 11.3 ± 1.7 10.7 ± 1.8
Inorganic phosphate 0.671 ± 0.157 0.426 ± 0.165 0.332 ± 0.113 0.518 ± 0.114
Glucose 0.125 ± 0.005 0.147 ± 0.008 0.141 ± 0.007 0.152 ± 0.008 Total protein 674 ± 111 907 ± 270 765 ± 175 777 ± 251
Albumin 1.66 ± 0.25 2.32 ± 0.51 2.08 ± 0.42 2.12 ± 0.37
Urea 112,7 ± 3.5* 122.0 ± 3.6 120.7 ± 3.6 132.6 ± 4.8 Creatinine × (µmol/l) 8771 ± 979 7399 ± 1071 7444 ± 862 6672 ± 818
*
[image:8.595.91.539.568.707.2]four different treatment groups (healthy control, warfarin control, vitamin K-1, and menaquinone-7). All the tested compounds were administered mixed in the feed. During the five-week study-period, blood pressure was recorded weekly and at the end of the experiment, vascular function studies were performed using aortic and mesenteric artery segments in vitro.
The formation of vascular calcification was not detected systematically in all the warfarin-treated groups al-though we adapted our experimental design, doses, diets, and duration of the experiment, from earlier studies
[5]-[8] with a similar study hypothesis. Howe et al. [6] used younger rats of different strain (Sprague-Dawley),
and K-1 and warfarin dosage were administered subcutaneously which makes it difficult to compare the results and doses to this investigation. However, in the study by Spronk et al., [7] the design was highly similar. Pre-vious studies have shown that vitamin K-2 [5] and menaquinone-4 [7], a shorter menaquinone derivative than MK-7, is able to prevent warfarin-induced vascular calcification and K-1 (doses between 1 - 6 mg/g food) had no effect on the formation of calcium deposits [7]. However, in study by Spronk et al. [7] menaquinone dose was 15-fold higher (1.5 mg/g feed) than in our experiment and Schungers et al. [8] provided no detailed data regarding which form of menaquinone their vitamin K-2 preparation contained, though the used dose (100 µg/g food) was the same as in our study.
Over the five-week study-period systolic and diastolic blood pressure remained unchanged between the treatment groups. Heart rates also showed no difference between the groups. Recent studies [9]-[12] have shown that warfarin treatment increases systolic blood pressure of rats. However, warfarin treatment in our study failed to increase systolic blood pressure probably due to poor vascular calcification, and it is possible that mild calci-fication does not affect vascular stiffness and function enough to influence blood pressure. This assumption is also supported by the results from the present vascular reactivity studies, which showed that warfarin treatment influenced neither vascular endothelium dependent nor independent relaxation of the aorta (large vessel) nor that of the mesenteric arteries (small vessel). This is in agreement with the findings of Essalihi et al. [17] in which only aortic responses were tested. After calcium channel blockade using nifedipine, all warfarin-treated groups showed slightly better endothelium-dependent relaxation (p < 0.05) in the aorta and after nitric oxide synthase (NOS) inhibition using L-NAME, endothelium-dependent relaxation were slightly better in healthy controls, and menaquinone-7 groups (p < 0.05). This phenomenon was not seen in the mesenteric arteries. We also tried to measure calcium concentrations of the aorta segments. The method (Inductively coupled plasma mass spectro-metry, ICP-MS) was not sensitive enough for the small concentrations of calcium (data not shown).
Interestingly, in the mesenteric artery rings, warfarin treatment reduced contractibility of the vessels reducing it especially after KCl contraction, and slightly after PE stimulation. This was not seen in aortas suggesting that warfarin treatment can modify contractibility in smaller vessels independently of possible calcification. Howev-er, endothelium-dependent relaxation was slightly impaired in this group. This could be associated to smaller contraction.
Warfarin treatment augmented the weight gain of the rats, which could not be explained by increased feed consumption. It also affected fat metabolism by decreasing total cholesterol and increasing LDL and triglyce-rides in serum, however, there were no differences between the warfarin-treated groups. This phenomenon may have something to do with weight development. Warfarin treatment also slightly influenced kidney function seen in urine clinical chemistry values of which urea and albumin levels were elevated, though, the kidney size was smaller (related to body mass) in H-C groups compared to the warfarin-treated groups, although this may be due to the higher body mass of H-C group.
Alkaline phosphatase levels were decreased in the K-1 group vs. H-C and W-C groups. In the MK-7 group, alkaline phosphatase was also slightly reduced. Alkaline phosphatase promotes calcification by reducing pyro-phosphate levels. Pyropyro-phosphate is a potent inhibitor of medial vascular calcification in vitro and in vivo[18] [19]. Decreased alkaline phosphatase levels may thus have a vascular calcification protecting property. In addi-tion, serum glucose and urea were increased and creatinine was decreased in H-C group compared to the warfa-rin-treated groups. Although, all clinical chemistry values were in normal range [20], thus severe pathological conditions can be left out of the discussion.
pub-lished in connection of a case report of arterial calcification associated with warfarin induced or dietary K-vita- min deficiency [22]. We have made a pilot evaluation from existing clinical laboratory data trying to find out correlation between blood INR values and serum calcium levels, but were not able to find it (Helin et al. unpub-lished). Further clinical or epidemiological studies are needed to solve relations between vitamin K-deficiency, warfarin therapy and arterial calcification.
5. Conclusion
Warfarin alone or together with vitamin K derivatives did not affect either blood pressure or endothelium-de- pendent or -independent relaxation of rat mesenteric arteries and aortas. Moreover, it did not induce systematic calcification of elastic lamellaes of rat aorta. However, warfarin treatment had significant effects on body weight and clinical chemistry parameters. It also slightly increased the endothelium-dependent relaxation of aorta after the L-type calcium channels were blocked. The vascular relaxation improved after NOS inhibition in healthy controls and MK-7 treated animals, indicating that in those groups the relaxation was not totally dependent on nitric oxide. Our results do not support previous observations on warfarin-induced vascular calcification and the role of vitamin K.
Acknowledgements
We are grateful to Jouko Levijoki, Orion Oy for clinical chemistry measurements, Matti Airaksinen, professor of anatomy and Dr. Mikko Mäyränpää for their skilled help with histological samples evaluations, Inkeri Jänis, MetropoliLab for ICP-MS measurements and Dr. Mona Møller for her scientific contribution to the study pro-tocol. The study was partly supported by DuPont Nutrition and Health, Finska Läkaresällskapet, and Finnish Clinical Chemistry Foundation. All the authors read and approved the final manuscript.
Conflict of Interest
Kirsti Tiihonen, Kaisa Olli and Krista Salli are employees of DuPont Nutrition and Health research center. The authors declare that there is no conflict of interest regarding the publication of this article.
References
[1] Kalra, S.S. and Shanahan, C.M. (2012) Vascular Calcification and Hypertension: Cause and Effect. Annals of Medicine, 44, S85-S92. http://dx.doi.org/10.3109/07853890.2012.660498
[2] Geleijnse, J.M., Vermeer, C., Grobbee, D.E., Schurgers, L.J., Knapen, M.H.J., van der Meer, I.M., et al. (2004) Dietary Intake of Menaquinone Is Associated with a Reduced Risk of Coronary Heart Disease: The Rotterdam Study. Journal of Nutrition, 134, 3100-3105.
[3] Beulens, J.W.J., Bots, M.L., Atsma, F., Bartelink, M.-A.E.L., Prokop, M., Geleijnse, J.M., et al. (2008) High Dietary Menaquinone Intake Is Associated with Reduced Coronary Calcification. Atherosclerosis, 203, 489-493.
http://dx.doi.org/10.1016/j.atherosclerosis.2008.07.010
[4] Gast, G.C.M., de Roos, N.M., Bots, M.L., Beulens, J.W.J., Geleijnse, J.M., Witteman, J.C., et al. (2009) High Mena-quinone Intake Reduces the Incidence of Coronary Heart Disease. Nutrition, Metabolism and Cardiovascular Diseases, 19, 504-507. http://dx.doi.org/10.1016/j.numecd.2008.10.004
[5] Price, P.A., Faus, S.A. and Williamson, M.K. (1998) Warfarin Causes Rapid Calcification of the Elastic Lamellae in Rat Arteries Heart Valves. Arteriosclerosis, Thrombosis, and Vascular Biology, 18, 1400-1407.
http://dx.doi.org/10.1161/01.ATV.18.9.1400
[6] Howe, A.M. and Webster, W.S. (2000) Warfarin Exposure and Calcification of the Arterial System of the Rat. Interna-tional Journal of Experimental Pathology, 81, 51-56. http://dx.doi.org/10.1046/j.1365-2613.2000.00140.x
[7] Spronk, H.M.H., Soute, B.A.M., Schungers, L.J., Thijssen, H.H.W., DeMey, J.G.R. and Vermeer, C. (2003) Tissue- Specific Utilization of Menaquinone-4 Results in the Prevention of Arterial Calcification in Warfarin-Treated Rats.
Journal of Vascular Research, 40, 531-537. http://dx.doi.org/10.1159/000075344
[8] Schungers, L.J., Spronk, H.M.H., Soute, B.A.M., Schiffers, P.M., DeMey, J.G.R. and Vermeer, C. (2007) Regression of Warfarin-Induced Medial Elastocalcinosis by High Inkake of Vitamin K in Rats. Blood, 109, 2823-2831.
[10] Essalihi, R., Zandvliet, M.L., Moreau, S., Gilbert, L.-A., Bouvet, C., Lenoel, C., et al. (2007) Distinct Effects of Amlo-pidine Treatment on Vascular Elastocalcinosis and Stiffness in a Rat Model of Isolated Systolic Hypertension. Journal of Hypertension, 25, 1879-1886. http://dx.doi.org/10.1097/HJH.0b013e328255e906
[11] Liu, C.Y., Wan, J.J., Yang, Q.F., Qi, B.L., Peng, W. and Chen, X.L. (2008) Effects of Atorvastatin on Warfarin- Induced Aortic Medial Calcification and Systolic Blood Pressure in Rats. Journal of Huazhong University of Science and Technology, 28, 535-538. http://dx.doi.org/10.1007/s11596-008-0510-1
[12] Beazley, K.E., Banyard, D., Lima, F., Deasey, S.C., Nurminsky, D.I., Komoplyannikov, M. and Nurminskaya, M.V. (2013) Transglutaminase Inhibitors Attenuate Vascular Calcification in a Preclinical Model. Arteriosclerosis, Throm-bosis, and Vascular Biology, 33, 43-51. http://dx.doi.org/10.1161/ATVBAHA.112.300260
[13] Ferland, G. (1998) The Vitamin K-Dependent Proteins: An Update. Nutrition Reviews, 56, 223-230. http://dx.doi.org/10.1111/j.1753-4887.1998.tb01753.x
[14] Luo, G., Ducy, P., McKee, M.G., Pinero, G.J., Loyer, E., Behringer, R.R. and Karsenty, G. (1998) Spontaneous Calci-fication of Arteries and Cartilage in Mice Lacking Matrix GLA Protein. Nature, 386, 78-81.
http://dx.doi.org/10.1038/386078a0
[15] Danziger, J. (2008) Vitamin K-Dependent Proteins, Warfarin, and Vascular Calcification. Clinical Journal of the American Society of Nephrology, 3, 1504-1510. http://dx.doi.org/10.2215/CJN.00770208
[16] Erkkilä, A.T. and Booth, S.L. (2008) Vitamin K Intake and Atherosclerosis. Current Opinion in Lipidology, 19, 39-42. http://dx.doi.org/10.1097/MOL.0b013e3282f1c57f
[17] Essalihi, R., Dao, H.H., Yamaguchi, N. and Moreau, P. (2003) A New Model of Isolated Systolic Hypertension In-duced by Chronic Warfarin and Vitamin K1 Treatment. American Journal of Hypertension, 16, 103-110.
http://dx.doi.org/10.1016/S0895-7061(02)03204-1
[18] Lomashvili, K.A., Cobbs, S., Hennigar, R.A., Hardcastle, K.I. and O’Neill, W.C. (2004) Phosphate-Induced Vascular Calcification: Role of Pyrophosphate and Osteopontin. Journal of the American Society of Nephrology, 15, 1392-1401. http://dx.doi.org/10.1097/01.ASN.0000128955.83129.9C
[19] Schibler, D., Russell, G.G. and Fleisch, H. (1968) Inhibition by Pyrophosphate and Polyphosphate of Aortic Calcifica-tion Induced by Vitamin D3 in Rats. Clinical Science, 35, 363-372.
[20] Boehm, O., Zu, B., Koch, A., Tran, N., Freyenhagen, R., Hartmann, M. and Zacharowski, K. (2007) Clinical Chemi-stry Reference Database for Wistar Rats and C57/BL6 Mice. Biological Chemistry, 388, 547-554.
http://dx.doi.org/10.1515/BC.2007.061
[21] Zhu, D., Mackenzie, N.C., Farquhaarson, C. and Macrae, V.E. (2012) Mechanisms and Clinical Consequences of Vascular Calcification. Frontiers in Endocrinology (Lausanne), 3, 95. http://dx.doi.org/10.3389/fendo.2012.00095 [22] Wahlqvist, M.L., Tanaka, K. and Tzeng, B.H. (2013) Clinical Decision-Making for Vitamin K-1 and K-2 Deficiency