Rapid T cell–based identification of human
tumor tissue antigens by automated
two-dimensional protein fractionation
Philipp Beckhove, … , Andreas Unterberg, Christel
Herold-Mende
J Clin Invest. 2010;120(6):2230-2242. https://doi.org/10.1172/JCI37646.
Identifying the antigens that have the potential to trigger endogenous antitumor responses in
an individual cancer patient is likely to enhance the efficacy of cancer immunotherapy, but
current methodologies do not efficiently identify such antigens. This study describes what
we believe to be a new method of comprehensively identifying candidate tissue antigens
that spontaneously cause T cell responses in disease situations. We used the newly
developed automated, two-dimensional chromatography system PF2D to fractionate the
proteome of human tumor tissues and tested protein fractions for recognition by preexisting
tumor-specific CD4
+Th cells and CTLs. Applying this method using mice transgenic for a
TCR that recognizes an OVA peptide presented by MHC class I, we demonstrated efficient
separation, processing, and cross-presentation to CD8
+T cells by DCs of OVA expressed
by the OVA-transfected mouse lymphoma RMA-OVA. Applying this method to human tumor
tissues, we identified MUC1 and EGFR as tumor-associated antigens selectively
recognized by T cells in patients with head and neck cancer. Finally, in an exemplary
patient with a malignant brain tumor, we detected CD4
+and CD8
+T cell responses against
two novel antigens, transthyretin and calgranulin B/S100A9, which were expressed in tumor
and endothelial cells. The immunogenicity of these antigens was confirmed in 4 of 10 other
brain tumor patients. This fast and inexpensive method therefore appears suitable for
identifying […]
Technical Advance
Oncology
Find the latest version:
Rapid T cell–based identification
of human tumor tissue antigens
by automated two-dimensional
protein fractionation
Philipp Beckhove,1 Rolf Warta,2,3 Britt Lemke,2 Diana Stoycheva,2 Frank Momburg,1
Martina Schnölzer,4 Uwe Warnken,4 Hubertus Schmitz-Winnenthal,5 Rezvan Ahmadi,2
Gerhard Dyckhoff,3 Mariana Bucur,1 Simone Jünger,1 Thomas Schueler,6,7 Volker Lennerz,8
Thomas Woelfel,8 Andreas Unterberg,2 and Christel Herold-Mende2
1Translational Immunology Unit, German Cancer Research Center, Heidelberg, Germany. 2Department of Neurosurgery, Division of Neurosurgical Research,
and 3Department of Head and Neck Surgery, University of Heidelberg, Germany. 4Functional Proteome Analysis, German Cancer Research Center,
Heidelberg, Germany. 5Department of Visceral Surgery, University of Heidelberg, Heidelberg, Germany. 6Department of Molecular Immunology,
German Cancer Research Center, Heidelberg, Germany. 7Institute of Immunology, University of Berlin, Charité, Berlin, Germany. 8III. Medical Department (Haematology/Oncology), University Hospital Mainz, Mainz, Germany.
Identifying the antigens that have the potential to trigger endogenous antitumor responses in an individual
cancer patient is likely to enhance the efficacy of cancer immunotherapy, but current methodologies do not
efficiently identify such antigens. This study describes what we believe to be a new method of comprehensively
identifying candidate tissue antigens that spontaneously cause T cell responses in disease situations. We used
the newly developed automated, two-dimensional chromatography system PF2D to fractionate the proteome
of human tumor tissues and tested protein fractions for recognition by preexisting tumor-specific CD4
+Th
cells and CTLs. Applying this method using mice transgenic for a TCR that recognizes an OVA peptide
pre-sented by MHC class I, we demonstrated efficient separation, processing, and cross-presentation to CD8
+T cells by DCs of OVA expressed by the OVA-transfected mouse lymphoma RMA-OVA. Applying this method
to human tumor tissues, we identified MUC1 and EGFR as tumor-associated antigens selectively recognized by
T cells in patients with head and neck cancer. Finally, in an exemplary patient with a malignant brain tumor, we
detected CD4
+and CD8
+T cell responses against two novel antigens, transthyretin and calgranulin B/S100A9,
which were expressed in tumor and endothelial cells. The immunogenicity of these antigens was confirmed in
4 of 10 other brain tumor patients. This fast and inexpensive method therefore appears suitable for identifying
candidate T cell antigens in various disease situations, such as autoimmune and malignant diseases, without
being restricted to expression by a certain cell type or HLA allele.
Introduction
In basic and translational immunology, identifying antigens that trigger pathogenic T cell responses in autoimmune disease or potential target antigens for immunotherapy of tumors still poses a major challenge. In autoimmune disease a special diffi-culty arises from the fact that while the affected organ or tissue is well known, the respective target cell types within this tissue have often not been defined. In malignant diseases, an increas-ing body of evidence suggests that in order to be successful, immunotherapies need to target antigens possessing an endog-enous immunogenic potential and that are expressed in tumor tissues at sufficient concentrations to trigger complex T cell responses composed of both T helper cells and cytotoxic T cells. Even within the same tumor type, the intraindividual repertoire of immunogenic tumor-associated antigens (TAAs) varies mark-edly (1, 2). Accordingly, the aim of cancer immunotherapy in the future is to individualize therapy by identifying patient-specific TAAs and epitopes (3).
Various complex approaches have been developed to identify TAAs relevant for cancer vaccines. By eluting MHC I–bound pep-tides from tumor cells and subsequently identifying corresponding TAAs by mass spectrometry (MS), antigen epitopes being processed and presented by tumor cells to the immune system can be identi-fied (3–8). However, such approaches do not answer the question of whether such epitopes are recognized by the patient’s immune system and do not address the issue of MHC II–restricted epitopes playing a major role in efficient tumor-immune rejection and in autoimmune disease. In contrast, the SEREX (serological analysis of recombinant cDNA expression libraries) method is based on sero- logical screening for tumor-specific antibodies using cDNA librar-ies derived from human cancers (9, 10). Again, it remains unclear whether the identified targets of humoral immune responses also represent target antigens of CD4+ or CD8+ T cell responses. Analo-gously, cDNA libraries of tumor cells were used to identify MHC I– restricted epitopes of tumor antigens recognized by CD8+ T cells from individual cancer patients (1). These methods are either indi- rect or restricted to selected HLA-I subtypes and represent compli-cated and extremely time-consuming procedures.
In this regard, the ProteomeLab PF2D technology might represent a time-saving method by which patient-specific TAA analysis can Authorship note: Philipp Beckhove and Rolf Warta contributed equally to this work.
Conflict of interest: The authors have declared that no conflict of interest exists.
technical advance
be individualized. This novel method — 2-dimensional (2D) chro-matography — is a potent tool for separating proteins from tumor proteomes and represents an alternative to 2D gel electrophoresis (10). Fractioning by using a PF2D system is based on the isoelectric point (pI) and hydrophobicity of processed proteins, and the proce- dure is highly reproducible (10, 11). The resulting separated, matrix-free proteins are extracted as fluids and therefore are immediately accessible for further functional analysis, for example, for natural processing by antigen-presenting cells such as DCs. T cell activation by antigen-pulsed DCs is based on a complex and tightly regulated process involving multiple steps, including protein uptake, cleavage into small peptide fragments, their loading into the peptide-binding cleft of MHC I and II molecules, and their presentation at the cell surface to antigen-specific T cells. However, since PF2D technology has predominantly been used for identifying differentially expressed proteins (12–15) and for validating protein arrays (16), so far, it is not known whether proteins subjected to PF2D fractionation under partially denaturing conditions maintain the features required for appropriate antigen processing by DCs. In addition, it is unclear whether concentrations of respective proteins in the eluates are suf-ficient for successful presentation to CD4+ and CD8+ T cells.
To investigate whether immunogenicity is preserved during the PF2D separation procedure, we first tested OVA processed in the PF2D system by T cell activation assays and in the next step identi-fied immunogenic proteins from the lysate of patient tumors. We demonstrate that PF2D-separated proteins are efficiently cross-pre-sented to OVA-specific naive CD8+ T cells and that this method can
also be successfully used to identify known and novel human TAAs spontaneously recognized by CD4+ and CD8+ memory T cells.
Results
T cell response to a defined antigen after PF2D fractionation. To evaluate the influence of the PF2D separation method on the immunoge-nicity of proteins, we chose OVA as a model protein recognized by OT-1 CD8+ T cells expressing an OVA-specific T cell receptor. First, we explored whether OVA can be separated by using PF2D technology. A pure sample of recombinant OVA protein was injected to the first-dimensional (1D) column; eluted fractions were monitored at 280 nm and automatically collected into a 96 deep-well plate. The first and chromatofocusing dimension of the PF2D system runs a pH gradient between pH 8.5 and 4. The 1D elution profile shows protein peaks eluted between 70 and 90 minutes retention time (RT), corresponding to fractions 15–18 and to a pH range of 5.58–4.38 (Figure 1A). The 1D fractions were then subjected to the 2D separation, which is based on hydro-phobicity. In the 2D profile, a major protein peak was eluted at a an RT of 23.5 minutes from 1D fraction 16 and collected in well 32 (W32, Figure 1B). Subsequent dot blot analysis confirmed the eluted protein solution of W32 as OVA (Figure 1C).
[image:3.585.51.535.83.301.2]To test whether OVA protein can also be separated from a com-plex proteome, we lysed OVA-transfected RMA cells, loaded 2.5 mg of protein lysate to the PF2D system, and then ran both the chro-matofocusing and the reversed-phase dimensions. Nontransfected RMA cells were processed in like manner as negative controls. For Figure 1
Fractionation, detection, and cross-presentation of recombinant OVA and OVA from OVA-overexpressing cells. (A) 1D profile of 1 mg OVA.
Red area corresponds to fraction 16. (B) 2D profile of fraction 16 of recombinant OVA. Main peak (P) was eluted in W32. AU, absorbance units.
(C) Confirmation of OVA protein in W32. (D) Differential expression map of 2D separation of fraction 16 of RMA-OVA and RMA cells. Among
oth-ers, a peak at RT = 24.4 minutes was detected in RMA-OVA but not RMA fraction and eluted to W33. (E) Confirmation of OVA protein in W33 of
RMA-OVA cells only. (C and E) PBS served as negative and recombinant OVA as positive control (C1, 0.5 ng; C2, 5 ng). (F) DCs from C57BL/6
mice pulsed with fractionated recombinant OVA (W32, B) were used to stimulate OVA-specific T cells. T cells stained with CD8- and CD69-PE
to evaluate the proportion of early-activated T cells by flow cytometry showed dose-dependent OVA-specific T cell activation. (G and H) DCs
pulsed with proteins derived from OVA-positive 2D fraction of RMA-OVA or respective fraction from RMA cells (W33; E). (G) T cell activation
as determined by flow cytometry with anti-CD69 antibodies. In F and G, one representative experiment of 3 independent experiments is shown.
(H) Proliferative activity of purified CD8+ OVA-specific T cells after activation with DCs loaded with fractions W33 from RMA-OVA or RMA cells
comparative analysis of eluted 2D protein peaks from both cell types, we employed DeltaVue software. Although this step was not essential for detecting OVA via preexisting T cells, we did identify a small, differentially expressed protein peak in fraction 16 (Figure 1D) that turned out to contain OVA in the case of the RMA-OVA lysate. We spotted 15 μl of each 2D fraction (corresponding to about 3% of the harvested fluid per fraction) to PVDF membranes and probed membranes with anti-OVA antibodies (Figure 1E). Again, we identified OVA in fraction 16 at an RT between 24.4 and 24.8 minutes by using the dot blot method (W33) and confirmed that one of the differentially expressed peaks was OVA. However, OVA was not detected in adjacent fractions (W31, W32, W34, W35) or in corresponding fractions of nontransfected RMA cells (W31–35)
that were separated by using the PF2D method. In summary, OVA was found in both the single protein and in the complex cell lysate in fraction 16 of the 1D separation and at similar RTs after PF2D processing. Slight differences in the RTs might be explained by the complexity of simultaneously present proteins in cell lysates that may possibly minimally influence each other’s RT.
[image:4.585.92.507.79.459.2]T cell activation assays were used to test the immunogenicity of eluted fractions. To avoid cytotoxic effects in the functional assays, we neutralized these proteins. DCs from C57BL/6 mice were pulsed with proteins from fraction 16 separated by PF2D either from pure OVA samples or from RMA-OVA cells. After coculture with T cells from OT-1 mice expressing the OVA-specific T cell receptor, OVA-specific activation of T cells was monitored, with analysis of Figure 2
Identification of MUC1+ protein fractions by MUC1-reactive T cells from patients with head and neck cancer. (A) T cell reactivity of patient HN-1
against DCs pulsed with synthetic, MUC1-derived long peptides from the signaling sequence (MUC1ss) or the tandem repeat region (MUC1tr) as revealed by IFN-γ ELISPOT assay. (B) T cell reactivity of HN-1 against DCs pulsed with 1D fraction A but not B–F of the patient’s autologous
tumor. (C) Detection of MUC1 protein in PF2D fraction A by IP. Lanes were run on the same gel but were noncontiguous, as indicated by the
black line. (D) T cell reactivity of patient HN-2 against TU-L–pulsed DCs as revealed by IFN-γ ELISPOT assay. (E) T cell reactivity of HN-2 against
DCs pulsed with 1D fractions (A–M) of the patient’s autologous tumor. Corresponding results of MUC1 protein detection by MUC1-specific IP are indicated for each PF2D fraction below (+, MUC1-positive; –, no detection of MUC1; ND, not determined). MUC1 could only be detected in fraction A. (F) T cell reactivity of patient HN-2 against DCs pulsed with synthetic, MUC1-derived long peptide (tandem repeat region, MUC1tr) as
technical advance
Figure 3
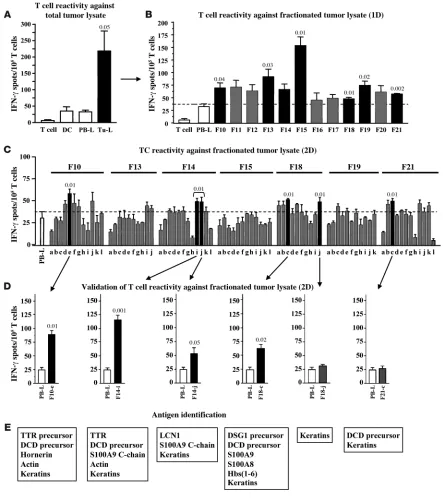
Recognition of autologous tumor protein fractions by T cells from NCH550 and identification of candidate target antigens. (A) DCs from brain
tumor patient NCH550 pulsed with tumor cell lysate (TU-L) or autologous PB-L as negative control were used to stimulate blood-derived T cells
from the same patient in IFN-γ ELISPOT assay. Additionally, purified TU-L–pulsed DCs or unstimulated PB-derived T cells served as controls.
PBTCs of NCH550 reacted significantly against autologous tumor-derived antigens as compared with negative control antigens derived from
autologous PB-L. (B) T cell reactivity of NCH550 against 1D separated protein fractions (F10–F21) as revealed by IFN-γ ELISPOT assay. (C)
1D fractions recognized by patient’s T cells (F10, F13–15, F18, F19, F21) subjected to 2D separation. Obtained subfractions were tested for rec-ognition by autologous T cells in IFN-γ ELISPOT assay. (D) For validation, whole tumor lysate was subjected a second time to 2D PF2D protein
separation, and subfractions recognized previously (Figure 1C; F10-e, F14-i, F14-j, F18-c, F18-j, F21-c) were tested again for recognition by autologous T cells. The experiment confirmed T cell reactivity against subfractions F10-e, F14-i, F14-j, and F18-c. (E) Proteins present in
the rate of CD69 expression by CD8+ T cells through flow cytom-etry and analysis of T cell proliferation. Even DCs pulsed by 1 μg OVA induced a significant activation of more than 60% of T cells (P = 0.002) as compared with the unstimulated control T cells, while 5 μg OVA induced activation of nearly all T cells (Figure 1F). Accordingly, DCs from C57BL/6 mice pulsed with W33 — the 2D OVA-containing fraction of fractionated RMA-OVA lysate — induced activation of the majority of cocultured, naive OT-I CD8+ T cells, as shown by increased CD69 expression (Figure 1G). [3H]thymidine uptake of CD8+ T cells after coculture with pulsed DCs revealed that proliferation of T cells originating from the experiment with OVA-containing RMA-OVA lysates was consider-ably higher than proliferation of the cells in OVA-free experiments (Figure 1H). It is noteworthy that the proliferation rate of T cells in the OVA-free experiment was similar to that of T cells cocultured with unpulsed DCs. These experiments show for the first time to our knowledge that the proteins processed by PF2D can be cross- presented by antigen-presenting cells via MHC I molecules, allow-ing them to be recognized by CD8+ T cells.
Identification of potential immunogenic proteins. To investigate whether the PF2D system is suitable for identifying T cell target antigens in diseased human tissues, we first wanted to determine whether a known tumor antigen could be recognized by autologous T cells within separated tumor protein fractions. For this experiment, we selected MUC1 as a model tumor antigen because it is abundantly expressed in many epithelial cancers, it is immunogenic (17), and it can be detected reliably in tumor lysates by IP using a MUC1-specific mAb. We applied an ex vivo short-term IFN-γ ELISPOT assay that can exclusively detect preexisting memory T cells (18) by using autologous DCs from the patients as antigen-presenting cells. Here, 2 × 10⁴ DCs/triplicate well were pulsed with synthetic long peptides derived from MUC1, with autologous tumor lysate as a source of undefined TAAs, or with respective negative control antigens (huIgG or autologous PBMC lysates). We first tested for the presence of T cells reacting against synthetic long peptides derived from the MUC1 signaling sequence (p1–100, MUC1ss) or from the tandem repeat region (p137–157, MUC1tr) in 5 head and neck cancer patients by using this method. We identified one patient (HN-1) showing a robust T cell response against MUC1tr but not MUC1ss (Figure 2A). We then separated cryopreserved tumor lysate from HN-1 by PF2D, pulsed the resulting protein preparations onto autologous DCs, and evaluated the reactivity of the patient’s T cells against the proteins present in these frac-tions by IFN-γ ELISPOT. We found a dominant T cell reactivity against proteins in fraction A, and only in this fraction was MUC1 protein detected by IP (Figure 2, B and C). In an ex vivo ELISPOT assay, we then identified another head and neck cancer patient (HN-2) showing a strong T cell reactivity against autologous tumor tissue-derived antigens (Figure 2D). In this patient we sim-ilarly tested T cell reactivity against separated protein fractions of the autologous tumor tissue. T cells from this patient reacted against a variety of fractions, including fraction A (Figure 2E). By IP, we detected the presence of MUC1 protein, again exclusively in fraction A. In order to assess whether MUC1 was a target antigen of the T cells from this patient in fraction A, we then evaluated T cell reactivity to synthetic MUC1tr. Indeed, we observed a strong T cell response against MUC1 in this patient (Figure 2F). These observations suggest that preexisting, tumor antigen–specific T cells in cancer patients can identify PF2D-separated protein frac-tions containing the respective tumor antigen. Thus, this method might also be suited for identifying so-far-unknown immunogen-ic tumor antigens. To test whether by MS we could identify other defined tumor antigens as target antigens of tumor-reactive T cells in patient HN-2, we homogenized another cryopreserved tumor specimen from this patient and subjected it to 1D fractionation. All 1D fractions that were proven to be immunogenic by ELISPOT assay were further separated in the second dimension. From these 2D fractions, we selected those fractions that contained the high-est protein peaks according to the PF2D elution profile in order to analyze immunogenicity by ELISPOT assay. MS was performed in the 5 most immunogenic of a total of 74 2D fractions to identify protein (Supplemental Figure 1; supplemental material available online with this article; doi:10.1172/JCI37646DS1). This MS anal-ysis revealed that immunogenic fractions contained the following well-known TAAs: EGFR (19, 20) and Her-2/neu (21, 22). To deter- mine whether either of these TAAs was recognized by a popula-tion of preexisting memory T cells, we next used well-described synthetic long peptides (EGFR479-528, Her-2/neu351-384) (23) as test antigens in ELISPOT assays using blood from the same patient. As shown in Supplemental Figure 1, we could clearly demonstrate that EGFR was recognized as an immunogenic TAA, while Her-2/ neu was not recognized by the patient’s immune system. We con-clude from these analyses that this method is suitable to identify “classic” T cell target antigens in tumor tissues. Thus, it might also be suitable for identifying other so-far-unknown immuno-genic tumor antigens. Therefore, we searched for exemplary tumor patients whose peripheral blood contained tumor tissue–reactive memory T cells, again by using ex vivo IFN-γ ELISPOT. With this method we ana-lyzed spontaneous T cell reactivity against tumor tissue antigens in a total of 11 different patients (4 patients with brain tumors, 2 with colorectal carcinomas, and 5 with head and neck cancer). Tumor-reactive T cells were found in the blood of 10 of these patients, but none were found in the remaining 1 patient (data not shown). From among the 10 patients, we selected patient NCH550 with a WHO grade III astrocytoma, whose blood con-tained tumor-reactive T cells at a high frequency of approximately 200/105 total T cells (Figure 3A).
technical advance
Figure 4
Expression of potentially immunogenic proteins in tumor tissue of patient NCH550. (A) In the first step, expression of identified antigens was
vali-dated by RT-PCR. Total RNA was isolated from tumor tissue and respective positive controls: HepG2 cell line for TTR, HNO41 tonsil carcinoma
for DSG-1, S100A8 and S100A9, and normal skin tissue for DCD and hornerin (HRNR). Expression of TTR, DSG1, calgranulin subunits S100A8
and S100A9, as well as DCD could be confirmed in the patient’s tumor tissue, while HRNR mRNA was only detected in the positive control. (B)
Figure 5
TTR as target antigen of autologous T cells from NCH550. (A) Molecular structure and amino acid sequence (AAS) of TTR and TTR precursor
(protein ID NP_000362). Black lines indicate synthetic polypeptides used for T cell stimulation. (B) Recognition of synthetic polypeptides by
NCH550 T cells in IFN-γ ELISPOT assay. Autologous PB-L, human IgG, T cells, and DCs served as negative controls. DCs pulsed by TTR3
resulted in significantly increased IFN-γ spot numbers. (C) Significant reactivity of total CD3, CD8+, and CD4+ T cells against DCs pulsed with
either total autologous tumor lysate or with synthetic TTR3 as compared with PB-L control. (D) AAS of the immunogenic region of TTR as
revealed by IFN-γ ELISPOT assays using synthetic polypeptides. (E) AAS of predicted epitopes potentially presented by different HLA-I
mol-ecules of NCH550 (HLA-A*0101–restricted epitopes, black; HLA-A*0201–restricted epitopes, blue; HLA-B*4101, red; HLA-B*5101, green). Colored asterisks indicate epitopes that may be also presented by other HLA-I molecules. (F) Recognition of HLA-I–restricted peptides (E). DCs
pulsed with autologous PB-L, human IgG, and HLA-A0201–restricted peptide from HIVgag served as negative control antigens. White bars indicate unstimulated or PB-L–stimulated subpopulations of CD3+, CD8+, or CD4+ T cells; black bars show significantly increased IFN-γ spot
numbers as compared with PB-L control; gray bars show nonsignificant T cell responses. (G) AAS of identified immunogenic target epitopes of
TTR restricted to HLA-A*0101, HLA-A*0201, and HLA-B*4101 as recognized by T cells from patient NCH550 are indicated by black lines. Small
technical advance
of tumor-reactive T cells, we performed PF2D fractionation and immunogenicity testing with fractionated tumor tissue antigens from the other 10 tested patients. Among them, in all 9 patients showing tumor-reactive T cells against unseparated whole tumor tissue lysate in the pretest, we also detected significant T cell reac-tivity against one or more tumor protein fractions. In contrast, the patient without detectable T cell reactivity against tumor tissue lysate did not show any considerable response against any sepa-rated tumor protein fraction (data not shown). In the next step, we identified those proteins that were recog-nized by T cells, using NCH550 as an exemplary patient. By mass spectrometry several proteins could be identified in each of the remaining 6 fractions (Figure 3E). Some of them, such as keratins, were present in all wells, irrespective of their immunogenicity, sug-gesting that the test wells were exogenously contaminated, which is a well-known phenomenon in proteomics research (24). This was also likely the case with dermcidin (DCD), which was also detected in most fractions, including the nonimmunogenic fraction F18-j. Others can be considered as housekeeping antigens (actin) or unspecific, blood-derived contaminations of the lysate (hemo-globins) and therefore were not tested further for antigenicity. The remaining identified proteins represented different isoforms of transthyretin (TTR), the calgranulin subunits A/S100A8 and B/S100A9, desmoglein-1 (DSG-1), hornerin, and lipocalin-1. We then evaluated the expression of these antigens by RT-PCR and immunofluorescence in the tumor tissue of patient NCH550. We confirmed mRNA expression of TTR, calgranulin A/S100A8, calgranulin B/S100A9, DCD, and DSG1 , but not of hornerin (Fig-ure 4A). Thus, the presence of hornerin was considered to result from handling of the samples. Subsequent protein analysis revealed heterogeneous expression of TTR on glial fibrillary acidicprotein–positive (GFAP-positive) tumor cells but not on endothelial cells, while cal-granulin B/S100A9 and DSG-1 were found in a small subpopulation of both cell types. In contrast, DCD could only be detected in endothelial cells (Figure 4B). Taken together, our results identify TTR, calgranulin A/S100A8, calgranulin B/S100A9, DSG-1, and DCD as potential immunogenic tumor tissue–derived proteins.
Immunogenicity and epitope characteriza-tion of potential TAAs identified by PF2D. To determine whether the identified proteins could be the target antigens of the observed T cell responses in patient NCH550, we syn-thesized large, overlapping polypeptides of the respective antigens and used them as test antigens in IFN-γ ELISPOT assays with patient-derived T cells. Since we were deal-ing with proteins instead of cell lysates here, we took human IgG as an additional nega-tive control antigen for DC pulsing. Amino acid sequences of the different TTR subunits and the resulting T cell responses against the respective synthetic peptides are shown in Figure 5, A and B. To exclude the possi-bility that T cells reacted against potentially mutated epitopes of tumor cell–derived TTR, we sequenced the whole TTR gene from the tumor-derived RNA of patient NCH550 but did not detect any mutations (Supplemental Figure 2). Furthermore, we identified TTR101-147 (TTR3) as the most immunogenic region of TTR (Figure 5B). A more detailed analysis of TTR3 recognition by ex vivo puri-fied CD4+ or CD8+ T cells revealed the presence of TTR
3-specific T cells in both T cell populations (Figure 5C), with a particularly strong CD8+ T cell response. Interestingly, TTR
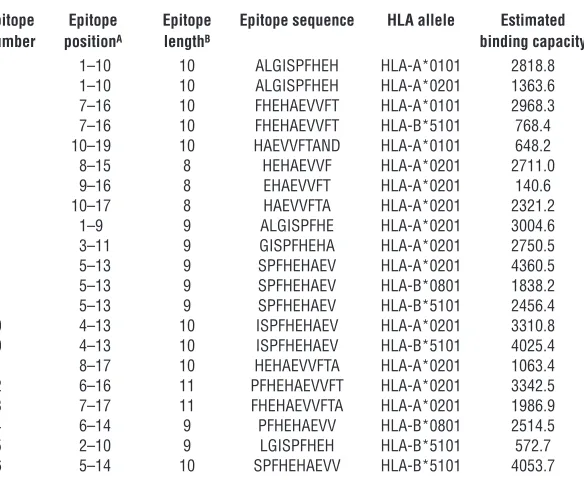
[image:9.585.61.353.124.367.2]3 recognition was also even stronger than recognition of whole tumor lysate, which is most likely due to the much higher concentrations of the synthetic peptide. Based on the observed T cell responses to TTR peptides, we were able to confine the immunogenic region to a peptide of 19 amino acids (Figure 5D). On the basis of the well-established algorithm SYFPEITHI for predicting HLA allele–restricted epit- opes (25), we identified 16 different peptides as potential candi-dates for presentation by the patient’s HLA-I alleles HLA-A*0101, HLA-A*0201, HLA-B*4101, and HLA-B*5101 to CD8+ T cells (Fig-ure 5E and Table 1). We synthesized these peptides and used them as test antigens in an ELISPOT assay. As an additional appropriate negative control antigen, we employed an HLA-A*0201–restrict-ed peptide derived from HIVgag. Five of the 16 tested peptides restricted to at least 2 HLA-I alleles caused a significant T cell response, demonstrating that the repertoire of TTR-specific CD8+ T cells was polyvalent (Figure 5, F–G). Analogously, we investigated whether calgranulin could repre-sent the immunogenic antigen in fractions F14-i, F14-j, and F18-c. Calgranulin consists of 2 homologous subunits, S100A8 and S100A9, and some shorter variants. We generated large, overlap-ping peptides of these subunits (Figure 6A) and performed an IFN-γ ELISPOT assay to test whether they were recognized by the patient’s T cells. T cell recognition was only found for calgranulin B/ S100A9 (Figure 6B), predominantly for S100A91-60. To define the
Table 1
Potential HLA-I–restricted epitopes of TTR101-119 (ALGISPFHeHAeVVFTAND) according to the epitope prediction algorithm SYFPeITHI
Epitope Epitope Epitope Epitope sequence HLA allele Estimated number positionA lengthB binding capacity
1 1–10 10 ALGISPFHeH HLA-A*0101 2818.8 1 1–10 10 ALGISPFHeH HLA-A*0201 1363.6 2 7–16 10 FHeHAeVVFT HLA-A*0101 2968.3 2 7–16 10 FHeHAeVVFT HLA-B*5101 768.4 3 10–19 10 HAeVVFTAND HLA-A*0101 648.2
4 8–15 8 HeHAeVVF HLA-A*0201 2711.0
5 9–16 8 eHAeVVFT HLA-A*0201 140.6
6 10–17 8 HAeVVFTA HLA-A*0201 2321.2
7 1–9 9 ALGISPFHe HLA-A*0201 3004.6
8 3–11 9 GISPFHeHA HLA-A*0201 2750.5 9 5–13 9 SPFHeHAeV HLA-A*0201 4360.5 9 5–13 9 SPFHeHAeV HLA-B*0801 1838.2 9 5–13 9 SPFHeHAeV HLA-B*5101 2456.4 10 4–13 10 ISPFHeHAeV HLA-A*0201 3310.8 10 4–13 10 ISPFHeHAeV HLA-B*5101 4025.4 11 8–17 10 HeHAeVVFTA HLA-A*0201 1063.4 12 6–16 11 PFHeHAeVVFT HLA-A*0201 3342.5 13 7–17 11 FHeHAeVVFTA HLA-A*0201 1986.9 14 6–14 9 PFHeHAeVV HLA-B*0801 2514.5 15 2–10 9 LGISPFHeH HLA-B*5101 572.7 16 5–14 10 SPFHeHAeVV HLA-B*5101 4053.7
Figure 6
Calgranulin B/S100A9 but not DSG-1 or DCD is a target antigen of autologous T cells. (A) Molecular structure and AAS of calgranulin B subunits
S100A8 (protein ID NP_002955), S100A9 (protein ID NP_002956), and shorter variants (C-chain protein ID 1XK4_C). Black lines indicate AAS of synthetic polypeptides used for T cell stimulation. (B) Significant recognition of S100A9 C-chain (C-ch), peptide-1 (A91), and peptide-2 (A92) by
NCH550 T cells as compared with IgG control. (C) Scheme and AAS of immunogenic region of S100A9 as revealed by IFN-γ ELISPOT assays
using synthetic polypeptides (A and B). Red lines indicate significant recognition. Blue lines indicate AAS of overlapping 20-meric peptides used
for further characterization of immunogenic epitopes. (D) Significant recognition of peptide-1 by NCH550 T cells as compared with PB-L control.
AAS of immunogenic region is shown in red. (E) Significant reactivity of total CD3, CD8+, and CD4+ T cells against DCs pulsed with total
autolo-gous Tu-L or peptide-1 (Pep-1) as compared with PB-L control. White bars indicate unstimulated subpopulations of CD3+, CD8+, or CD4+ T cells.
(F–H) Reactivity of NCH550 T cells against DCs pulsed with synthetic polypeptides DSG61-100 and DSG211-245 (DSG-11 and DSG-12 respectively;
protein-ID NP_001933) spanning 2 described immunogenic regions of DSG-1 (F–H) or with DCD1-40, DCD31-70, and DCD61-110 (DCD1, DCD2, and
DCD3, respectively) of DCD (protein ID NP_444513) (G and H) by NCH550 T cells. (H) Validation of negative results; polypeptide TTR3 served
technical advance
immunogenic epitope in more detail, we synthesized overlapping 20-meric peptides of the respective region (Figure 6C) and iden-tified S100A911-30 as the immunogenic epitope (Figure 6D). This epitope was recognized both by CD8+ and CD4+ T cells of patient NCH550 (Figure 6E).
Finally, we tested whether the patient’s T cell repertoire recog-nized DSG-1 and DCD. Neither of these antigens was recognized in repeated testings (Figure 6, F–H).
T cell responses against TTR and S100A9 are common in brain tumor patients. We next assessed whether the two antigens identified as potential major target antigens of tumor-specific T cells in one
malignant brain tumor might also rep-resent major target antigens in brain tumors in other patients. To this end we performed ex vivo IFN-γ ELISPOT assays to test the specific reactivity of blood-derived T cells from a total of 10 additional brain tumor patients (9 glio-mas and 1 medulloblastoma) against synthetic peptides derived from the most immunogenic epitopes of TTR101-147 and S100A91-60, using human IgG as a negative control antigen. As shown in Figure 7A, we detected TTR-specific T cell reactivity in 4 patients and S100A9-specific T cells in 3. Interestingly, the latter patients also showed significant T cell reactivity against TTR. Therefore, TTR and S100A9 appear to be common target antigens in brain tumors.
The proteasome of DCs can differ from that of tumor cells, leading to a poten- tially different repertoire of peptides pre-sented by the two cell types. Moreover, spontaneous T cell responses recogniz-ing tumor antigens presented by DCs but not by tumor cells or tumor stroma cells might be functionally irrelevant. Since we observed a particularly strong T cell response against DC-presented TTR and S100A9 in patient NCH656b (Figure 7A), we assessed in this patient whether these S100A9- and TTR-specific T cells were also able to recognize both antigens when they were expressed by tumor cells. Therefore, we transfected COS7 tumor cells with the respective antigens with (test group) or without (negative control group) cotransfecting the respective HLA-I molecules expressed by NCH656b and cocultured them with the patient’s T cells in an IFN-γ ELISPOT assay. As shown in Figure 7, B and C, we obtained significant T cell responses against both antigens: S100A9-specific T cell reactivity was restricted to HLA-A02 and HLA-B08 (Figure 7B), while TTR-specific T cells were restricted to HLA-B08, HLA-B51, and HLA-Cw07 (Figure 7C). Thus, the observed T cell responses were also able to recognize candidate TAAs when these were endogenously processed and presented by tumor cells.
Discussion
[image:11.585.39.374.70.429.2]Here we describe an unbiased, inexpensive, and quick approach for identifying candidate T cell immunogenic antigens expressed by various cell types, including stromal cells in tissues, on the basis of the patients’ own repertoire of antigen-specific memory CD4+ T helper and CD8+ cytotoxic T cells. Protein separation and identi-fication and the series of 4–5 subsequent ELISPOT assays that are required to identify and verify candidate T cell target antigens in a Figure 7
TTR and calgranulin B/S100A9 are frequently recognized in patients with brain tumors and can be recognized by T cells on antigen-expressing tumor cells. DCs from another 10 different brain tumor patients were pulsed with synthetic peptides derived from TTR101-147 (TTR) or calgranulin
B/S100A91-60 (S100A9) as test antigens or with human IgG as control antigen at a concentration of 200 μg/ml and used for stimulation of blood-derived T cells from the same patients in triplicate wells in IFN-γ ELISPOT assays. (B and C) Response of T cells from NCH656b against calgranulin
B and TTR expressed by COS7 tumor cells. COS7 cells were transfected with calgranulin B (A) or
TTR (B) either alone (C/– or TTR/–, respectively), which served as negative controls (white bars),
or together with respective HLA-I molecules expressed by NCH550 cells (test groups). Transfected COS7 cells were cocultured with T cells from NCH550, and T cell reactivity was evaluated by IFN-γ
ELISPOT assay. IFN-γ spot numbers secreted by T cells were calculated by subtracting
patient’s tissue can be performed within 2 months. This approach has become technically feasible by the recent introduction of the automated PF2D system for 2D protein separation. The method provides liquid protein fractions that are directly accessible for identification and for transfer to functional assays. Although the fractionation process is carried out under partially denaturing conditions, antigen uptake, processing, and cross-presentation by DCs are not impaired. This is in accordance with previous observa-tions that protein denaturation increases uptake, processing, and presentation by DCs and thus increases overall immunogenicity (26–28). Importantly, the amounts of purified proteins obtained from the separation process were sufficient for recognition by memory T cells. Purified and fractionated OVA induced activa-tion of naive OT-I T cells at concentrations of 1 μ g/ml. Fraction-ated OVA from RMA-OVA cells was still recognized at about 10- to 50-fold lower concentrations. Compared with the naive T cells that we used for OVA experiments, far lower amounts of antigen are needed to activate memory T cells responding to antigens in the human situation (29). As demonstrated by the identification of two well-known immunogenic TAAs from a patient with head and neck cancer as well as two new immunogenic antigens in a patient with a WHO grade III astrocytoma (NCH550), our data suggest that the proposed procedure is sufficiently sensitive for identifying major immunogenic determinants in tissues. However, this meth-od may not be able to detect minor amounts of target antigens. Since our method is based on the processing of proteins by the immunoproteasome of DCs, we could not exclude the possibility that the respective T cell responses are restricted to antigen presenta- tion by professional antigen-presenting cells such as DCs or macro-phages and thus may not directly target antigens presented by tumor cells or tissue stromal cells. In order to address this, we tested T cell reactivity against MHC-deficient tumor cell lines transiently trans- fected with the respective HLA molecules and one of the newly iden-tified antigens, TTR or S100A9. In these experiments, we confirmed the relevance of the postulated TAAs in an HLA-restricted fashion. By using the present method, in contrast to all other approaches, CD4+ and CD8+ T cell responses ex vivo against intact proteins independent of HLA subtypes, the cellular source of the antigen, and the current state of mRNA expression within the tissue can be detected immediately. The latter point may be of importance, since many antigen identification approaches are based on dif-ferential gene expression without recognizing the more relevant differences in protein expression (29). Additionally, the observa-tion that even different isoforms and modifications of proteins can be separated by PF2D technology (10) in combination with our findings makes this newly introduced system highly suitable in the quest for T cell target antigens. In summary, we identified 4 different proteins in glioma-derived immunogenic protein fractions, TTR, calgranulin B/S100A9, DSG-1, and DCD, that were expressed in the mRNA of the respec- tive tumor tissue and at the protein level by tumor cells (TTR, cal-granulin B/S100A9, DSG-1) or by endothelial cells (calgranulin B/ S100A9, DSG-1, DCD). Of these, only TTR and calgranulin B/ S100A9 represented candidate target antigens of spontaneous CD4+ and CD8+ T cell responses, demonstrating that spontane-ous antitumor immune responses are not exclusively directed against tumor cell–associated antigens but can be induced against tumor stroma–associated antigens, too. Anti–stromal cell immune responses have been hitherto largely unrecognized but may play a fundamental role in immunopathology. TTR, a low-molecular-weight protein, is involved in the transport of thyroxin and retinol by interacting with retinol-binding protein (30–32). Under normal conditions it is mainly found in the liver and to a lesser extent in the pancreas, the brain, and the blood (33). TTR-deficient mice show lower levels of retinol and retinol-binding protein, which in turn was shown to be associated with malignant transformation of the ovarian epithelium (34, 35). Accordingly, upregulation of TTR in lung adenocarcinoma patients with brain metastasis has been reported, which is in agreement with our findings that increased TTR expression is part of the high-grade proteomics signature of WHO grade IV gliomas (36, 37). Calgranulin is a Ca2+ -binding protein that is overexpressed in a variety of human tumors, including breast, lung, gastric, and pancreatic cancer (38–40). While in a healthy organism it is predominantly found in the blood, it is strongly upregulated in acute inflammatory processes such as appendicitis (33, 41, 42). Regarding its functional activity in tumors, it contributes to the invasive phenotype in gastric cancer cells and has chemotactic properties (43). Both proteins might be considered as autoantigens, since they are also expressed in healthy tissues. Still, the presence of high numbers of antigen-reactive type 1 CD4+ and CD8+ memory T cells in the peripheral blood of the patient suggests a constant triggering of T cell responses against these antigens, which might be associated with their expression in the tumor tissue. Interestingly, both brain tumor tissue–associated antigens appear to represent common target antigens of tumor-specific T cells, since we detected preexisting T cell responses with specificity against one or both antigens in 4 of 10 additional cases. In conclusion, we demonstrated that proteins fractionated by PF2D can be efficiently taken up by DCs, processed, and cross-presented to antigen-specific T cells and are suitable to specifically reactivate pre-existing memory CD4+ and CD8+ T cell responses in patients. There-fore, natural repertoires of tumor-specific T cells can be exploited by the PF2D technique to identify in tissues as-yet-unknown or indi-vidual candidate antigens of potential clinical relevance.
Methods
Cell culture and patient samples. Tumor cell lines (RMA, RMA-OVA, HepG2,
HNO41) were cultivated as described previously (44). For the tissues and blood samples used, written informed consent was obtained from patients according to the research proposals approved by the Institutional Review Board at the Medical Faculty of the University of Heidelberg. For PF2D analy-sis cells and tissues were lysed in 2 ml lysis buffer (12). Before lysis, tissues were mechanically dissected into small pieces by use of an Ultra-Turrax (IKA). After centrifugation, the lysates were desalted, and buffer was exchanged to start buffer (Beckman Coulter) using PD10 Sephadex G-25 columns (Amersham). After elution of samples with 3.5 ml start buffer, the protein content was determined using the Micro BCA Protein Assay Kit (Thermo Scientific).
PF2D 2D liquid chromatography
technical advance
and immediately collected in 96 deep-well plates (450 μl/well). The UV absorbance data were further analyzed by ProteoVue and DeltaVue soft-ware (Beckman Coulter). Positive fractions were dried by centrifugation in a SpeedVac centrifuge (Bachofer), resolved in 10 μl 100 mM ammonium bicarbonate, and stored at –20°C before being subjecting to further T cell activation assays and protein identification by liquid chromatography– electrospray ionization–tandem MS (LC-ESI-MS/MS) (NextGen Sciences; Protagen; Core Facility, German Cancer Research Center).
Dot blot. Fractions collected after 2D separation were dotted on activated
PVDF membrane (Roche), followed by incubation with blocking buffer (5% dry milk in TBST), rabbit anti-OVA antibody (1:1,000, Sigma-Aldrich), and HRP-labeled donkey α -rabbit IgG antibody and visualized by ECL-Plus luminescence staining (all Amersham).
Primary OT-I T cell activation. DCs were isolated from spleens of C57BL/6
mice by magnetic beads labeled with anti-CD11c antibodies (CD11c MACS-beads, Miltenyi). All animal experiments were approved by the Institutional Animal Care and Use Committee of the German Cancer Research Center, Heidelberg, and by the government of the Federal State of Baden-Württem-berg, Germany. Aliquots of DCs (2 × 10⁴/well) were pulsed overnight with
different concentrations of PF2D-fractionated OVA protein. After 3 hours, 20 ng/ml LPS (Sigma-Aldrich) was added to induce DC maturation. CD8+
T cells were purified by anti-CD8 magnetic beads (Miltenyi) from spleen cells of naive OT-I mice and cocultured with OVA-pulsed DCs at a ratio of 1:5 for 6 hours (CD69 expression) or 24 hours (proliferative activity).
Flow cytometry
. T cells from stimulation cultures were stained with the fol-lowing anti-mouse mAbs: anti-CD69–FITC and anti-CD8–PE (all BD) for 30 minutes on ice. Dead cells were labeled with 1 μg/ml propidium iodide (Abcam) and excluded from analysis. Recordings were made from a minimum of 5 × 10⁴ cells on a FACSCalibur (BD) using FlowJo 4.3 software (Tree Star).
T cell proliferation. After primary T cell activation, [3H]thymidine (GE
Healthcare Europe) at 1 μCi/well was added for 16 hours of culture, and [3H] incorporation was measured using a liquid scintillation counter (1450
MicroBeta, PerkinElmer).
PCR. RT-PCR was performed as described previously (45) using 2 μg of total RNA for reverse transcription. Amplification of cDNA was performed in 40 cycles at 58°C annealing temperature. The PCR primers used are listed in Supplemental Table 1. Immunofluorescence. Double immunofluorescence staining for TTR, calgranulin B/S100A9, DSG-1, DCD, GFAP, and CD31 was performed as described previously (45). Antibodies and their concentrations are listed in Supplemental Table 2.
Antigens used for human T cell assays
. Test antigens were lysate from cryo-preserved autologous NCH550, HN-1, and HN-2 tumors after mechanical homogenization with an Ultra-Turrax and filtration (0.22 μ m filter, Milli-pore); synthetic polypeptides from MUC1, EGFR479-528 (23), Her-2/neu351-384 (23),
TTR, calgranulin subunits S100A8 and S100A9, DSG-1, or DCD; and synthetic HLA-I–restricted peptides from TTR (all at 200 μg/ml) or total tumor protein fractions from 1D or 2D PF2D separation. Control antigens were lysates from PBMCs of NCH550, HN-1, and HN-2, human immuno-globulin (Endobulin, Baxter), synthetic polypeptide of human IgG140-89 (23),
and/or HLA-A2–binding peptide HIVgag77-85.
Generation of human T cells and DCs. DCs were generated as described
previously (46). In brief, adherent cells from peripheral blood were cul-tured for 7 days in serum-free X-VIVO20 (LONZA) containing 50 ng/ml rhuGM-CSF (Leukine [sargramostim]) and 1,000 U/ml IL-4 (Promocell). DCs were enriched using anti-CD3– and anti-CD19–coupled magnetic beads (Invitrogen) and pulsed for 2 hours with test or control antigens. Human T cells were cultured for 7 days in RPMI (Invitrogen) containing 10% AB serum (PAN Biotech), 100 U/ml IL-2 (Proleukin, Chiron), and 60 U/ml IL-4, followed by overnight incubation without interleukins and separation from contaminating cells by anti-CD19, anti-CD15, and anti-CD56 magnetic beads (47).
IFN-γ ELISPOT assay. IFN-γ–producing T lymphocytes were determined
as described previously (47). Briefly, antigen-pulsed DCs were incubated in 3–5 wells/test group with autologous T cells at a ratio of 1:5 for 40 hours. IFN-γ spots were measured using KS ELISPOT software (Zeiss). Spots induced by control antigens were considered as background.
Expression of S100A9 and TTR cDNAs. We obtained cDNA clones encoding
human S100A9 (IRATp970G0775D, accession no. BC047681) and human TTR (IRALp962D2416Q, accession no. BC005310) from imaGenes. The S100A9 and TTR full-length cDNAs were subcloned from pCMV-Sport6 and pDNR-LIB vectors, respectively, into the expression vector pcDNA3.1+ (Invitrogen) and confirmed by sequencing. The pcDNA3.1+ plasmids were transiently transfected into COS7 cells cultured in 6-well plates by using Lipofectamine 2000 (Invitrogen) according to the instructions of the manufacturer. At day 3 after transfection, the expression of S100A9 and TTR proteins was verified by immunocytochemistry by using mouse anti– MRP-14 (S100A9) or sheep anti-TTR antibodies and peroxidase-labeled secondary reagents. Strong expression could be detected in 30%–40% of COS7 cells. For use in the IFN-γ ELISPOT assay, COS7 cells were trans-fected with either pcDNA3.1+/S100A9 or pcDNA3.1+/TTR together with pcDNA plasmids containing HLA-A*0101, HLA-A*0301, HLA-B*0801, HLA-B*3501, or HLA-Cw*0702 cDNAs.
HLA typing. HLA typing of patient NCH550 was performed as described
previously (48) by the Department of Transplantation Immunology at the Institute of Immunology of Heidelburg University Hospital.
Epitope prediction. We used the well-established algorithm SYFPEITHI for
prediction of HLA-restricted epitopes of candidate antigens (25).
Statistics. Statistical evaluation was performed using an unpaired 2-sided
Student’s t test. P values of 0.05 or less were considered significant. In all figures, numbers above the bars indicate the significant P values as com-pared with respective negative control wells. If not indicated otherwise, error bars in all figures show the mean + SEM of 3–5 wells. Acknowledgments This work was supported by the Initiative and Networking Fund of the Helmholtz Alliance on Immunotherapy of Cancer (P. Beck-hove). P. Beckhove and C. Herold-Mende received funding from the Tumorzentrum Heidelberg-Mannheim. We thank Miriam Scherpe, Daniela Zito, Farzaneh Kashfi, and Melanie Greibich for expert technical assistance; Christine Dictus, Benito Campos, Dirk Theile, and Jennifer Lohr for critically reading the manu- script and for their helpful suggestions; and Tore Kempf for sup-port in protein identification. Received for publication July 6, 2009, and accepted in revised form March 17, 2010. Address correspondence to: Christel Herold-Mende, Sektion Neu-rochirurgische Forschung, Neurochirurgische Universitätsklinik, INF 400, 69120 Heidelberg, Germany. Phone: 49.6221.566405; Fax: 49.6221.565362; E-mail: H.Mende@med.uni-heidelberg.de. 1. Lennerz V, et al. The response of autologous T cells to a human melanoma is dominated by mutat-ed neoantigens. Proc Natl Acad Sci U S A. 2005; 102(44):16013–16018.
2. Sommerfeldt N, Schutz F, Sohn C, Forster J, Schir- rmacher V, Beckhove P. The shaping of a polyva-lent and highly individual T-cell repertoire in the bone marrow of breast cancer patients. Cancer Res.
2006;66(16):8258–8265.
4. Celis E, et al. Identification of potential CTL epi-topes of tumor-associated antigen MAGE-1 for five common HLA-A alleles. Mol Immunol. 1994; 31(18):1423–1430.
5. Cox AL, et al. Identification of a peptide recognized by five melanoma-specific human cytotoxic T cell lines. Science. 1994;264(5159):716–719.
6. Kramer BF, et al. MAGED4-expression in renal cell carcinoma and identification of an HLA-A*25-restricted MHC class I ligand from solid tumor tissue. Cancer Biol Ther. 2005;4(9):943–948. 7. Ramakrishna V, et al. Naturally occurring peptides
associated with HLA-A2 in ovarian cancer cell lines identified by mass spectrometry are targets of HLA-A2-restricted cytotoxic T cells. Int Immunol. 2003; 15(6):751–763.
8. Schirle M, et al. Identification of tumor-associated MHC class I ligands by a novel T cell-independent approach. Eur J Immunol. 2000;30(8):2216–2225. 9. Sahin U, et al. Human neoplasms elicit multiple
specific immune responses in the autologous host.
Proc Natl Acad Sci U S A. 1995;92(25):11810–11813. 10. Sheng S, Chen D, Van Eyk JE. Multidimensional
liquid chromatography separation of intact pro-teins by chromatographic focusing and reversed phase of the human serum proteome: optimiza-tion and protein database. Mol Cell Proteomics. 2006; 5(1):26–34. 11. Soldi M, et al. Proteome profile of human urine with two-dimensional liquid phase fractionation. Proteomics. 2005;5(10):2641–2647. 12. Billecke C, et al. Analysis of glioma cell platinum response by metacomparison of two-dimensional chromatographic proteome profiles. Mol Cell Pro-teomics. 2006;5(1):35–42.
13. Gunther NW, Nunez A, Fortis L, Solaiman DK. Proteomic based investigation of rhamnolipid production by Pseudomonas chlororaphis strain NRRL B-30761. J Ind Microbiol Biotechnol. 2006; 33(11):914–920.
14. Lee HJ, Kwon MS, Lee EY, Cho SY, Paik YK. Establish-ment of a PF2D-MS/MS platform for rapid profiling and semiquantitative analysis of membrane protein biomarkers. Proteomics. 2008;8(11):2168–2177.
15. Ruelle V, et al. An immuno-PF2D-MS/MS pro- teomic approach for bacterial antigenic character-ization: to Bacillus and beyond. J Proteome Res. 2007; 6(6):2168–2175.
16. Schabacker DS, Stefanovska I, Gavin I, Pedrak C, Chandler DP. Protein array staining methods for undefined protein content, manufacturing quality control, and performance validation. Anal Biochem. 2006;359(1):84–93.
17. Girling A, Bartkova J, Burchell J, Gendler S, Gillett C, Taylor-Papadimitriou J. A core protein epitope of the polymorphic epithelial mucin detected by the monoclonal antibody SM-3 is selectively exposed in a range of primary carcinomas. Int J Cancer. 1989; 43(6):1072–1076. 18. Muller-Berghaus J, et al. Melanoma-reactive T cells in the bone marrow of melanoma patients: associa-tion with disease stage and disease duration. Cancer Res. 2006;66(12):5997–6001. 19. Neninger E, et al. Combining an EGF-based cancer vaccine with chemotherapy in advanced nonsmall cell lung cancer. J Immunother. 2009;32(1):92–99. 20. Andrade Filho PA, Lopez-Albaitero A, Gooding
W, Ferris RL. Novel immunogenic HLA-A*0201- restricted epidermal growth factor receptor-spe-cific T-cell epitope in head and neck cancer patients.
J Immunother. 2010;33(1):83–91.
21. Cheever MA, et al. The prioritization of cancer antigens: a national cancer institute pilot project for the acceleration of translational research. Clin Cancer Res. 2009;15(17):5323–5337.
22. Novellino L, Castelli C, Parmiani G. A listing of human tumor antigens recognized by T cells: March 2004 update. Cancer Immunol Immunother. 2005;54(3):187–207.
23. Bonertz A, et al. Antigen-specific Tregs control T cell responses against a limited repertoire of tumor antigens in patients with colorectal carcinoma.
J Clin Invest. 2009;119(11):3311–3321.
24. Keller BO, Sui J, Young AB, Whittal RM. Interferenc-es and contaminants encountered in modern mass spectrometry. Anal Chim Acta. 2008;627(1):71–81. 25. Rammensee H, Bachmann J, Emmerich NP,
Bachor OA, Stevanovic S. SYFPEITHI: database for MHC ligands and peptide motifs. Immunogenetics. 1999;50(3–4):213–219.
26. Koch C, Jensen SS, Oster A, Houen G. A comparison of the immunogenicity of the native and denatured forms of a protein. APMIS. 1996;104(2):115–125.
27. Schirmbeck R, Bohm W, Melber K, Reimann J. Pro-cessing of exogenous heat-aggregated (denatured) and particulate (native) hepatitis B surface antigen for class I-restricted epitope presentation. J Immu-nol. 1995;155(10):4676–4684.
28. Schirmbeck R, Bohm W, Reimann J. Injection of detergent-denatured ovalbumin primes murine class I-restricted cytotoxic T cells in vivo. Eur J Immu-nol. 1994;24(9):2068–2072.
29. Zinkernagel RM, Bachmann MF, Kundig TM, Oehen S, Pirchet H, Hengartner H. On immunolog-ical memory. Annu Rev Immunol. 1996;14:333–367.
30. Hou X, Aguilar M, Small D. Transthyretin and famil-ial amyloidotic polyneuropathy. Recent progress in understanding the molecular mechanism of neuro-degeneration. FEBS J. 2007;274(7):1637–1650.
31. Irace G, Edelhoch H. Thyroxine-induced confor-mational changes in prealbumin. Biochemistry. 1978;17(26):5729–5733.
32. Peterson PA. Studies on the interaction between prealbumin, retinol-binding protein, and vitamin A.
J Biol Chem. 1971;246(1):44–49.
33. Shmueli O, et al. GeneNote: whole genome expres-sion profiles in normal human tissues. C R Biol. 2003;326(10–11):1067–1072.
34. Roberts D, et al. Decreased expression of retinol-binding proteins is associated with malignant
transformation of the ovarian surface epithelium.
DNA Cell Biol. 2002;21(1):11–19.
35. van Bennekum AM, Wei S, Gamble MV, Vogel S. Biochemical basis for depressed serum retinol levels in transthyretin-deficient mice. J Biol Chem. 2001;276(2):1107–1113. 36. Marchi N, Mazzone P, Fazio V, Mekhail T, Masaryk T, Janigro D. ProApolipoprotein A1: a serum mark-er of brain metastases in lung cancer patients. Can-cer. 2008;112(6):1313–1324. 37. Park CK, Jung JH, Park SH, Jung HW, Cho BK. Multifarious proteomic signatures and regional heterogeneity in glioblastomas. J Neurooncol. 2009; 94(1):31–39.
38. El-Rifai W, et al. Gastric cancers overexpress S100A calcium-binding proteins. Cancer Res. 2002; 62(23):6823–6826.
39. Seth A, Kitching R, Landberg G, Xu J, Zubovits J, Burger A. Gene expression profiling of ductal carci-nomas in situ and invasive breast tumors. Antican-cer Res. 2003;23(3A):2043–2051.
40. Shen J, Person M, Zhu J, Abbruzzese J, Li D. Protein expression profiles in pancreatic adenocarcinoma compared with normal pancreatic tissue and tissue affected by pancreatitis as detected by two-dimen-sional gel electrophoresis and mass spectrometry.
Cancer Res. 2004;64(24):9018–9026.
41. Cross SS, Hamdy FC, Deloulme JC, Rehman I. Expression of S100 proteins in normal human tis-sues and common cancers using tissue microarrays: S100A6, S100A8, S100A9 and S100A11 are all overexpressed in common cancers. Histopathology. 2005;46(3):256–269.
42. Newton RA, Hogg N. The human S100 protein MRP-14 is a novel activator of the {beta}2 integrin Mac-1 on neutrophils. J Immunol. 1998;160(3):1427–1435. 43. Yong H, Moon A. Roles of calcium-binding proteins,
S100A8 and S100A9, in invasive phenotype of human gastric cancer cells. Arch Pharm Res. 2007;30(1):75–81. 44. Herold-Mende C, et al. Expression and functional significance of vascular endothelial growth factor receptors in human tumor cells. Lab Invest. 1999; 79(12):1573–1582.
45. Dictus C, Tronnier V, Unterberg A, Herold-Mende C. Comparative analysis of in vitro conditions for rat adult neural progenitor cells. J Neurosci Methods. 2007; 161(2):250–258.
46. Choi C, et al. Enrichment of functional CD8 memory T cells specific for MUC1 in bone marrow of patients with multiple myeloma. Blood. 2005; 105(5):2132–2134.
47. Feuerer M, et al. Therapy of human tumors in NOD/SCID mice with patient-derived reactivated memory T cells from bone marrow. Nat Med. 2001; 7(4):452–458.


![5,6,7,8 Tetrahydro 4aH thieno[3,2 b]quinolizin 4(10H) one](data:image/gif;base64,R0lGODlhAQABAIAAAP///wAAACH5BAEAAAAALAAAAAABAAEAAAICRAEAOw==)