© 2017, IRJET | Impact Factor value: 6.171 | ISO 9001:2008 Certified Journal | Page 2010
Simulation of DVR by Using Ultra Capacitor to Analysis of THD with and
without Dc-Dc Converter
Pravin G. Bhende
1, Mr.Saurabh H. Thakare
2, Dr.Vijay.G.Neve
31
P.G. Student, Department of Electrical Engineering, Padm.Dr.V.B.Kolte COE,Malkapur,M.S., India
2Asst.Professor, Department of Electrical Engineering, Padm.Dr.V.B.Kolte COE,Malkapur,M.S., India
3
HOD, Department of Electrical Engineering, Jagadambha COE & Technology,Yavatmal,M.S., India
---***---
Abstract
- Issues related to power quality have become morecritical in recent times due to the increased penetration of renewable into the power grid. Voltage sags and swells are amongst the most important issues associated with a power grid, and extensive research has been directed towards the mitigation of these issues. The quality of the power may be improved by using power conditioning equipment. To protect sensitive load from the effect of voltage disturbance on the distribution feeder the Dynamic voltage restorers (DVR) are used. In the DVR control strategies the absence of a buck-boost converter in some of the existing DVR systems necessitates energy storage of high voltage rating. Ultra capacitors (UCAP) have typical characteristics such as low energy density and high power density for the mitigation of voltage sag and swell The DVR system discussed in this paper has a bidirectional buck-boost converter and an ultra-capacitor as the energy storage device This paper presents an enhance DVR topology suitable for delivering extended mitigation for PQ problems. In the proposed DVR, Ultra-Capacitor is used as an energy storage device as it provides extravagant power in a short interval of time due to this many advantages it offers over the conventional battery, has been used as the active source for the DVR This paper presents modeling and simulation of a DVR for power quality problems and Compare the THD for Voltage Sag and Swell when Ultra Capacitor connected to the series inverter via with and without Dc-Dc converter. All the simulation work is done in MATLAB software.
Key words: Dynamic Voltage Restorer (DVR),
Ultra-capacitor (UCAP), Voltage sag/swell, PI controller, DC-DC Converter.
1. INTRODUCTION
In recent years , the term power quality refers to the characterization of the quality of power being delivered to the customer premises in terms of certain indices like the magnitude and frequency of voltage, waveform shape etc. Power quality has turn into major issues by way of the beginning of power electronics devices, whose behavior is most responsive to the power quality problems. In the production industries, load devices utilizes power electronic based controllers which are fast responding to pitiable
voltage quality and will be in OFF mode if the source voltage is lowered and may mis-operate in many methods if harmonic distortion of the source voltage is much more. Power quality issues is an incidence evident as unwanted voltage, current or frequency, the performance is operation failure or miss operation of user device. Much of this modern load equipment itself uses electronic switching devices which then can contribute to poor network voltage quality. With a fast increasing technology in industrial sector, electrical companies are observing more stipulating demands on the power quality from the power consumers and the association of the universal financial system has advanced in the direction of globalization and the gain boundaries of a lot of tricks be likely to reduced. The improved compassion of the huge amount of work like (industrial, Services and even residential) to power quality issues makes the accessibility of electric power system with excellence a essential feature for competitiveness in each sector. Some of the salient power quality issues include voltage sags/swells, harmonics, long term voltage disruptions etc. Switching of loads and capacitor banks, faults or short circuits in the power system, starting currents of large machines and many such occurrences may manifest as power quality issues. A survey conducted by International Energy Agency lists voltage sag as the most important power quality issue to be dealt with Voltage sag/swell is a momentary dip/rise in voltage from 0.9 - 0.1 p.u (sag) / 1.1 – 1.8 p.u (swell) of the nominal rms value. Typically the duration of voltage sags or swells can lie anywhere between half cycle to one minute.
© 2017, IRJET | Impact Factor value: 6.171 | ISO 9001:2008 Certified Journal | Page 2011
2. DYNAMIC VOLTAGE RESTORER (DVR)
The DVR (Dynamic Voltage Restorer) model is shown in Fig-1. It consists of the Insulated gate bipolar transistor (IGBT), its gate driver, filter circuit consists of the inductance and capacitor and an isolation transformer.
Fig- 1: Basic Model of DVR
The key purpose of a DVR is the protection of sensitive loads from power quality problems such as voltage sag and swell. If a fault arises on the transmission lines, DVR injects a series voltage and pre-fault value is obtained by compensating the load voltage. The injected voltage of the DVR connected in series can be written as
VDVR=Vload+ZTHIL-VTH (1)
Where, Vload is the required load voltage magnitude, ZTH is the load impedance, IL is the load current and VTH is the source voltage during sag and swell condition.
The load current can be calculated by given formula,
IL= (2)
In order to provide dynamic voltage restoration, there are various methods available to control the inverter connected in series. The control method requires the use of the proportional and integral controller. The output signal of the PI controller is directly proportional to the sequence of measured actuating error signal and its time. The transfer function is given by,
Transfer Function=(K1 /s)+KP
Power quality problem includes voltage sag and swell are generated at the load terminals by inducing the fault. The sensing of load voltage takes place and is passed through the sequence analyzer and its amplitude is compared with a reference voltage (Vref). In order to maintain the base voltage across the load terminals, the IGBT inverter is controlled by using PI controller. Using DVR, the
compensation is achieved by either injecting or absorbing the real and reactive power into the system. The main disadvantage of DVR states that it can supply only limited amount of real power during compensation. For effective compensation to take place, DVR can be connected through the energy storage device.
3. ULTRA-CAPACITOR (UCAP)
The specifics of ultra capacitor construction are dependent on the application and use of the ultra capacitor. The materials may differ slightly from manufacturer or due to specific application needs. The ultra capacitor is consist of a positive electrode, a negative electrode and separator between these two electrodes. The assembly of the ultra capacitors can vary from product to product. This is due in part to the geometry of the ultra capacitor packaging. UCAP can be divided into three categories according to the energy storage mechanism namely Double-Layer Capacitor, organic polymer electrode Ultra-capacitor and metal oxide super capacitor. Double layer Capacitor is shown in following Fig-2.
Fig- 2: Ultra-Capacitor Model
While charging, the Positive attracts electrolyte anion and negative attracts cation. When discharging, it can release all stored energy instantly. UCAP is mainly suitable for short term high power application.
4. Bidirectional Dc–Dc Converter And Controller
© 2017, IRJET | Impact Factor value: 6.171 | ISO 9001:2008 Certified Journal | Page 2012 inverter. The amount of active power support required by
the grid during a voltage sag event is dependent on the depth and duration of the voltage sag, and the dc–dc converter should be able to withstand this power during the discharge mode. The dc–dc converter should also be able to operate in bidirectional mode to be able to charge or absorb additional power from the grid during voltage swell event.
Fig-3. Model of the bidirectional dc–dc converter and its controller.
In this paper, the bidirectional dc–dc converter acts as a boost converter while discharging power from the UCAP and acts as a buck converter while charging the UCAP from the grid. A bidirectional dc–dc converter is required as an interface between the UCAP and the dc-link since the UCAP voltage varies with the amount of energy discharged while the dc-link voltage has to be stiff. Average current mode control, which is widely is used to regulate the output voltage of the bidirectional dc–dc converter in both buck and boost modes while charging and discharging the UCAP bank. This method tends to be more stable when compared to other methods such as voltage mode control and peak current mode control. Average current mode controller is shown in Fig. 3, where the dc-link and actual output voltage Vout is compared with the reference voltage Vref and the error is passed through the voltage compensator C1(s), which generates the average reference current Iucref .When the inverter is discharging power into the grid during voltage sag event, the dc-link voltage Vout tends to go below the reference Vref and the error is positive; Iucref is positive and the dc–dc converter operates in boost mode. When the inverter is absorbing power from the grid during voltage swell event or charging the UCAP, Vout tends to increase above the reference Vref and the error is negative; Iucref is negative and the dc–dc converter operates in buck mode. Therefore, the sign of the error between Vout and Vref determines the sign of Iucref and thereby the direction of operation of the bidirectional dc–dc converter. The actual UCAP current (which is also the inductor current) Iuc is then compared to the average reference current Iucref and the
error is then passed through the current compensator C2(s). The compensator transfer functions, which provide a stable response, are given by,
C1 (s) = 1.67 +
C2 (s) = 3.15 +
5. PROPOSED WORK
Fig- 4: Block diagram of Integrated UCAP-DVR without Dc-Dc Converter
The block diagram of the without Dc converter UCAP-DVR system is shown in Fig-4. It consists of three phase series inverter, UCAP energy storage device and three phase isolation transformer connected to distribution Grid. The three phase supply voltage of 415 V,50 Hz is connected to the sensitive load in both the block diagram.
Fig- 5: Block diagram of Integrated UCAP-DVR with Dc-Dc Converter
© 2017, IRJET | Impact Factor value: 6.171 | ISO 9001:2008 Certified Journal | Page 2013 circuit vice versa in Fig-5. the energy storage device i.e. UCAP
is connected to the inverter via Dc-Dc Buck Boost Converter because to maintain stiff Dc voltage to the inverter.
And the various Simulation results of this two system are discussed and shown in results section
6. SIMULATION/EXPERIMENTS RESULTS
The simulation of the UCAP-DVR with and without DC-DC converter is carried out in MATLAB/Simulink for a 415 V, 50Hz system. Fig-6. shows the simulation model of three phase DVR Circuit with DC-DC converter and Fig-7. shows the simulation model of UCAP-DVR without Dc-Dc converter and three phase RL load are connected. Between three phase ac supply and load an injection transformer having 1:1 turn’s ratio is connected. Primary of transformer is connected in series with load, while its secondary is connected to the inverter circuit. Three VI measurements are connected at source side, load side and DVR side, so that these voltages are used to see the waveforms on scope. Voltage of the DC storage device is 300volts. SPWM control technique is used in the DVR in both the model to stimulate the sag and swell.
Fig-6: Simulation model of Three phase DVR with Dc-Dc Converter
Fig-7: Simulation model of Three phase DVR without Dc-Dc Converter
6.1 Case study: Voltage sag compensation
At the power frequency sag is a decrease for durations from 0.5 cycle to 1 minute in between 0.1 and 0.9 pu in rms voltage or current. The system model with 20% voltage sag created in 0.2s to 0.3s in three phase voltage as shown in Fig-8(a). When the three phase supply voltage sag is produce at 0.2s to 0.3s the DVR activated suddenly in milliseconds to compensate load voltage and inject the lost sag voltage to the load voltage side to maintain the magnitude constant during voltage sag condition as shown in Fig-8(c).
a) Source Voltage
b) Injected Voltage
c) Load Voltage
Fig-8: Simulation results for voltages Sag Condition (a) Source voltage (b) Injected DVR Voltage (c)Load
voltage
6.2 Case study: Voltage Swell compensation
A swell is defined as, at the power frequency for durations from 0.5 cycle to 1 minute an increase between 1.1 pu and 1.2 pu in rms voltage or current. In this simulation 20% voltage swell are created in three phase at 0.2s to 0.3s as shown in Fig-9(a). When voltage swell are produced in 0.2s to 0.3s the DVR is activated and inject the missing voltage as shown in Fig-9(c).
© 2017, IRJET | Impact Factor value: 6.171 | ISO 9001:2008 Certified Journal | Page 2014 thus the voltage sag event can be compensated. Similarly, the
magnitude of source voltage has increased due to the injected voltage, but the load voltage remains constant and thus the voltage swell can be compensated.
a) Source Voltage
b) Injected Voltage
c) Load Voltage
Fig-9: Simulation results for voltages Swell Condition (a) Source voltage (b) Injected DVR Voltage(c) Load
voltage.
Thus, the voltage sag and swell problems are compensated effectively by the use of Integrated of UCAP with DVR.
6.3 Case study: Voltage harmonics Compensation
The supply system is designed to operate (termed the fundamental frequency; usually 50 or 60 Hz)at which The Harmonics are sinusoidal voltages or currents having frequencies that are integer multiples of the frequency. Generally on the power system, Harmonic distortion originates in the nonlinear characteristics of devices and loads. Harmonic distortion levels are described by the complete harmonic spectrum with magnitudes and phase angles of each individual harmonic component. It is also common to use a single quantity, the total harmonic distortion(THD), as a measure of the effective value of harmonic distortion.
Fig-10:THD for UCAP-DVR without Dc-Dc Converter during Voltage sag
Fig-11:THD for Integrated UCAP-DVR with Dc-Dc converter during Voltage sag
Fig-10 & Fig-11. Shows the stimulated THD for the integrated Ultra capacitor connected to the DVR via Dc-Dc converter.
© 2017, IRJET | Impact Factor value: 6.171 | ISO 9001:2008 Certified Journal | Page 2015 Fig-13:THD for Integrated UCAP-DVR with Dc-Dc
converer during Voltage swell
Fig-12 & Fig-13. Shows the stimulated THD for the Ultracapacitor connected to the DVR without Dc-Dc converter.
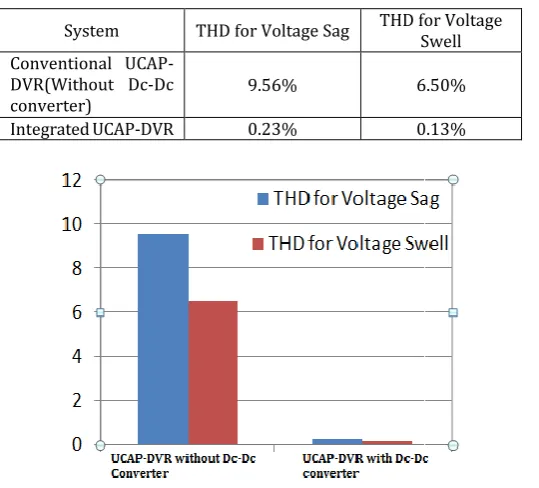
[image:6.595.63.266.88.246.2]Thus, some distortion may be seen in compensated voltage is specified in the Total harmonic distortion analysis. The voltage sag and swell event in terms of THD for the integrated UCAP-DVR with Conveter is shown in Fig-10 and Fig-11. The comparison of total harmonic distortion between the conventional DVR where UCAP is directly connected to the Series Inverter and the proposed system i.e. Integrated UCAP-DVR where UCAP is connected to the Series Inverter via Dc-Dc Converter is shown in Table-1.
Table -1: THD Comparison
System THD for Voltage Sag THD for Voltage Swell Conventional
UCAP-DVR(Without Dc-Dc
converter) 9.56% 6.50%
Integrated UCAP-DVR 0.23% 0.13%
Chart-1:The comparison for Two DVR System
7. REFERENCES
[1]. Deepak Somayajula, Mariesa L. Crow,” An Integrated Dynamic Voltage Restorer-Ultracapacitor Design for Improving Power Quality of the Distribution Grid”, IEEE Transactions On Sustainable Energy, Vol. 6, No. 2, April 2015.
[2] Rakeshwari Pal, Dr.Sushma Gupta,”Simulation of Dynamic Voltage Restorer (DVR) to mitigate voltage sag during Three-Phase Fault”, 2016 International Conference on Electrical Power and Energy System (ICEPES), India. Dec 14-16,2016.
[3]. O. Anaya-Lara and Acha E., “Modeling and analysis of custom power systems by PSCAD/EMTDC,” IEEE Trans. Power Delivery, vol. 17, no.1, pp. 266-272, January 2002.
[4] Ragini Saxena, Manorama Kushwah,”Optimization of Voltage sag/Swell using Dynamic Voltage Restorer (DVR)”, International Conference on Electrical, Electronic and Optimization Technique (ICEET)-2016.
[5].Posad C.J., Ramirez J.M and Correa R.E., “Voltage compensation for common disturbances at the distribution level,” Innovative Smart Grid Technologies (ISGT Latin America), IEEE PES Conference onpp.1-6, 19-21 Oct. 2011
[6] Geeta V. Awad, Prof.S.D.Jawale,”Simulation Model of Three Phase Dynamic Voltage Restorer For Voltage Compensation”,2016 International Conference on Electrical Power and Energy System (ICEPES), 978-1-5090-2476-6/16 ©2016 IEEE.
[7] Venmathi M. and Ramesh L., “The impact of Dynamic Voltage Restorer on voltage sag mitigation,” Sustainable Energy and Intelligent Systems (SEISCON 2012), IET Chennai 3rd International on, pp.1-7, 27-29 Dec. 2012.
[8] Abdullahi Bala Kunya, Tankut Yalcinoz, Gaddafi Sani Shehu,”Voltage Sag and Swell Alleviation in Distribution Network using Custom Power Devices; D-STATCAM and DVR”, 16th International Power Electronics and Motion Control Conference and Exposition, Antaya, Turkey 21-24 Sept 2014
[9] Ramchandra Nittala,” Phase Shifting Transformer based Interline DynamicVoltage Restorer to Mitigate Voltage Sag”, 2013 Annual IEEE India Conference.
[10]. Ghosh A. and Ledwich G. F., “Power Quality enhancement Using Custom Power Devices,” Kluwer Academic Publishers, 2002.
[image:6.595.31.301.478.722.2]© 2017, IRJET | Impact Factor value: 6.171 | ISO 9001:2008 Certified Journal | Page 2016 [12].Pal Y., Swarup A. and Singh B., “A Review of
Compensating Type Custom Power Devices for Power Quality Improvement,” Power System Technology and Power India Conference, IEEE, (POWERCON),vol.1, no.8, pp.12-15, Oct. 2008.
[13].Chang C.S., Ho Y.S. and Loh P.C., “Voltage quality enhancement with power electronics based devices,” Power Engineering Society Winter Meeting, IEEE , vol.4, pp.2937-2942 , 2000.
[14]. Ghosh A. and Ledwich G., “Compensation of distribution system voltage using DVR,” Power Delivery, IEEE Transactions on, vol.17, no.4, pp.1030-1036, Oct 2002.
[15]B.Hasanin, Shazly A.Mohammed, Abdel-Moamen M.A,”Analysis, Modeling and simulation of Dynamic Voltage Restorer (DVR) for Compensattion of Voltage Quality Disturbances” International juornal of Control, Automation and Systems, VOL.1 No.2, April 2013.
[16] S. Santoso, M. F. McGranaghan, R. C. Dugan, and H.W. Beaty, Electrical Power Systems Quality, 3rd ed. New York, NY, USA: McGraw-Hill, Jan.2012.