EVALUATION AND RESEARCH OF INCUBATOR’S HATCH
ABILITY OF SMALL AND MEDIUM-SIZED ENTERPRISE
BASED ON MULTICLASS ANALYSIS
XUE WU
Chongqing University of Science and Technology College of Business Administration, Chongqing,400020,China
ABSTRACT
With the continuous development of business incubator nowadays, the existing evaluation method of enterprise incubator’s hatch ability has been unable to meet the needs of small and medium-sized enterprises. This paper proposes a small and medium-sized enterprise incubator’s hatch ability evaluation model based on multiclass method, this model introduced the principal component analysis and factor analysis, first, it selects small and medium-sized enterprise incubator’s hatch ability evaluation index, then it makes data conversion to these indicators, then it carries out the variable correlation analysis, and finally do the hatch ability evaluation. The experimental results show that the small and medium-sized enterprise incubator’s hatch ability evaluation model based on multiclass can evaluate effectively small and medium-sized enterprise incubator’s ability, that is to say this model is practical and effective.
Keywords: Principal Component Analysis, Factor Analysis Method, Small and Medium-sized Enterprise
Incubator, Hatchability Evaluation
1. INTRODUCTION
Business incubator is a new type of social and economic organization, it reduces venture business risk and business cost, enhances the enterprises’ survival rate and the success rate through providing the research, developing, and managing site, the sharing facilities like communication, network and office tools, and by providing the systematic training and consulting, and the supporting of political, financial, legal and market promotion [1]. However, with the continuous development of our country’s enterprise incubator, it also appears some problems in its operation, such as the lag of basic services ability, the low of incubation effect, the low quality of incubator management personnel, these all affect the enterprise’s ability of incubator hatch ability (2-3). Therefore, when our eyes are focusing on the achievement of our country’s enterprise incubator over twenty years, we also should notice the problems that we have [4-6].
For the research of enterprise incubator’s hatch ability evaluation, such as Chan and Lau put forward the science and technology business incubator related assessment framework by using the organization theory and cluster theory, the framework including nine evaluation criteria: resource collection, resource sharing, consulting services, public image, the network platform, geographical advantages, cost advantage, and
financing support (7), In Mo Guang Zheng’study of higher school social service evaluation, he put forward a enterprise incubator hatchability index system in university science and technology park, constructing the incubator’s hard and soft environment condition, incubator’s financing ability, management ability, talent gathered ability, marketing ability, and the key factors, which consists of 17 indicators [8]. As for foreign study, foreign scholars started earlier the study of the assessment and research of business incubator, who has made great achievements, and latter they also use a quantitative method to evaluate and analysis, which has the certain scientific, but lack of system related theory, and no specialized hatch ability analysis, what’s more, the research according to the actual situation of the country’s enterprise incubator’s development, the research results has a certain significance to the evaluation theory of enterprise incubator hatchability, but we need more study about our country enterprise incubator’s hatch ability’s research and evaluation.
2. PINCIPLE COMPONENT ANALYSIS
Principal component analysis is a kind of commonly used multivariate statistical method, which has been widely used in the social economy, enterprise management and geological, biochemical, pharmaceutical, and other fields, such as clothing finalize the design, enterprise's economic benefit analysis, and the aim making of new development project [9].
The target of principal component analysis is to simplify the multivariate statistics system. That is to say, we carry out the dimensional reduction treatment to the high dimension variable space under the principle of least losing the data information [10].
Assuming the assessment questions has p’s index x x1, 2,...,xp,thesep’s index indicate the
natures of all the assessment objects, thus the observed p’s index value of every object is a sample value, which is a vector of p’s
dimension. If there are n’s objectives, there are
n’s vectors of p’s dimension, showing in matrix
X:
11 12 1
21 22 2
1 2 ... ... ... ... ... ... ... p p
n n np
x x x
x x x
X
x x x
=
(1)
If we take p’s index x x1, 2,...,xp as the random variables,their expecting value and covariance matrix are 1 1 2 2 ... ... x p p x x E E x
µ
µ
µ
= = (2)11 12 1
21 22 2
1 2 ... ... ( ) ( ( , )) ... ... ... ... ... p p
ij i j
p p pp
v v v
v v v
V v Cov x x
v v v
= = = (3) ij
v is the variance of the variable of i,thus the change status of these p’s variables can also be
indicated by 1 p ij i v =
∑
. The problem now is whether we can find a pare of new variables1, 2,..., m( )
y y y m<p ,that can make
, 1,...,
j j
y =L x j′ = m (4)
{ : 1}
j
L ∈ =
γ
L L L′ = ,γ
is called thecollection of regulated vectors of p’s dimension.
Which satisfy:
(1)y1is in all the similar forms to y=L x′
reaching the maximum variance L∈
γ
; (2)y2is in all the similar forms to y=L x′not related with y1and reaching the maximum variance L∈
γ
;(3)ykis in all the similar forms to y=L x′
not related with y1,...,yk−1and reaching the maximum varianceL∈
γ
,k=3, 4,...,m.This problem is just to solve
maxVar y( )=Var L x( ′ )=L VL′ ,and
1
L L′ = (5) Using the Lagrange multiplier method to
establish the objective function
( 1)
Q=L VL′ −
λ
L L′ − (6)Thus Q 2VL 2 L
L
λ
∂ = − ∂
and Q 0
L
∂ =
∂ ,then we have VL=
λ
L, 1L L′ = .
This indicates that L is the facture vector of matrix V,and under the above formula, we have
( )
Var y =L VL′ =
λ
L L′ =λ
(7)Namely characteristic root
λ
is variance of variabley. So only to solve the feature vector Lcorresponding to the biggest characteristic root, the main ingredients can work out.
So the found new variables y y1, 2,...,ymare all
the linear combination of the original variable x x1, 2,...,xp . The coordinate system constructed by y y1, 2,...,ym is got by the translation and orthogonal rotation of the original coordinate system; we say the space constructed by
1, 2,..., m
3. FACTOR ANALYSIS METHOD
3.1Factor Analysis Model
Factor analysis using a small amount of comprehensive index (main factor) instead of multiple primary indexes, the got main factor is for the linear combination of the original index.
Assuming there are p’s observation variables
1, 2,..., p
x x x ,put these into standardization, making the mean of the variable as 0 after standardization, and the variance is 1. Recording the original public factor’s variables as
1, 2,..., m
f f f ,and the public factors after the standardization areF F1, 2,...,F mm( <p),m’s public factors that can not presented are called special factors, marked as
ε ε
1, 2,...,ε
p. And the factor analysis model is1 11 1 12 2 1 1
2 21 1 22 2 2 2
1 1 2 2
... ...
...
...
m m
m m
p p p pm m p
x a F a F a F
x a F a F a F
x a F a F a F
ε
ε
ε
= + + + + = + + + +
= + + + +
(8)
In which,aijis the factor loading, the greater the absolute value of aijis(|aij| 1≤ ),xidepends greater on Fj,all the elements aij composing the factor loading matrix A.
3.2Assessment Steps
(1)Constructing the original matrix X according to the selected index system and the index data, and carry out the standardization to the matrixX, and get the standardized matrixZ;
(2) UsingZ to calculate correlation coefficient matrix R , order |R−
λ
l| 0= , and solving the characteristic value, the contribution rate and cumulative contribution rate of R , under the principal of the main component characteristic root not less than 1 or main component’s variance cumulative contribution rate not less than 85% , thus we can determine the number of main factor (setm< p);(3) Calculation feature vector and initial factor loading matrixA, using the method of regression to estimate factor score, taking the proportion of each factor’s variance contribution rate occupies total variance factor contribution rate as weight to go the weighted summary, finally get factor’s comprehensive analysis model
1 2
1 2
1 1 1
... m m
m m m
i i i
i i i
F
λ
Fλ
Fλ
Fλ
λ
λ
= = =
= + + +
∑
∑
∑
(9)(4) If factor loading quantity is averagely, and difficult to discriminate which indicator contacts closely with a certain factor, then using the maximum variance method to do orthogonal rotation of the initial factor, making the contribution of the public factors disperse the better, and the original index have the large load only in a public factor. In this way we can give the main factor reasonable economic meaning to analyze the researching problem.
(5) According to the sample factor score to do the comprehensive analysis and evaluation, the higher the score shows the better properties of the sample.
4. EVALUATION MODEL OF INCUBATOR
HATCHABILITY
4.1 Index Choosing
When evaluating the small and medium-sized enterprise’s incubator hatchability, we must first select evaluation index.
The quantitative indicators selected by this article show as follows: small and medium-sized enterprise incubator site areax1, small and
medium-sized enterprise graduation ratesx2, the number of
employees of enterprise in hatch x3 ,the total
income of the enterprises in hatch x4, the tax
payment of the enterprises in hatchx5, staff’s high
quality structurex6, the number of new hatched
enterprisesx7, the net value of fixed assets by the
end of the yearx8, the total fund obtained by small
and medium-sized enterprise incubatorx9. 4.2 Data Conversion
In order to make it possible for the comparison between the indexes, and eliminate the possible influence on the evaluation result caused by observation and dimension differences, thus we need to carry out the standardization processing to the index data of incubator hatchability, using SPSS software to start the original data standardization process. The specific computation formula is as follows:
Assuming the original data matrix is
( ij)( 1, 2,..., ; 1, 2,..., )
In whichxij is the j’s index value of i’s incubator sample,N is the evaluation index number. Then carry out the Dimensionless processing according to the formula below:
( ij j)
ij
j
x Z
S
µ
−=
(11)
In the formula(6),Zij is the standard value of
data xij,
µ
jis the average value of index j,Sj isthe standard error of index j.
After the standardization processing of the
sample observed data xij,we can get the average
value 0 of the standard value
( 1, 2,..., )
ij
Z j= p
,variance 1.
4.3 Correlation Analysis of The Variance
Because one of the main task of the factor analysis is to concentrate the original variables, which is to put forward the overlaps information of the original variable and integrate into the factor, and finally realize the purpose of reduce the number of variables, for this progress, it requires a strong correlation between the original variable, or if the original variables are independent, it cannot be concentrated, and also has no need for factor analysis.
Checking whether there is relationship between variables, we usually can use the method of calculating simple correlation coefficient matrix, calculating the inverse image correlation matrix (Anti-image correlation matrix), and the Bartlett Sphericity inspection (Bartlett of Sphericity), KMO (Kaiser - Meyer - Olkin) inspection methods to study the relationship between the original variables. This paper takes KMO and Bartlett spherical to analyze the correlation of variables.
5. INCUBATOR’S HATCH ABILITY
EVALUATION OF SMALL AND MEDIUM-SIZED ENTERPRISE
This paper selects 134 small business incubators as a sample for incubator’s hatch ability evaluation. First take KMO and Bartlett spherical to analyze the correlation of variables.
Table 1 shows the test results, the first behavior test the correlation KMO statistics between variables, its value is 0.742 > 0.5, shows that factor analysis effect is good; The second line hypothesis the test chi-square value is 433.719, the associated probability is 0.000, less than significance level
0.05, obviously, the correlation coefficient matrix is not unit array, and it has strong correlation between variances. Therefore, the original data selected by this paper is proper to use the factor analysis. And through the various factor extent sizes, the main factors of these nine factors are first three factors.
Table 1: KMO and Bartlett’s Test
Kaiser-Meyer-Olkin Measure of Sampling
0.742
Adequacy
Bartlett’s Test of Approx.Chi-Sqiare 433.719
Sphericity df 36
Sig. 0.000
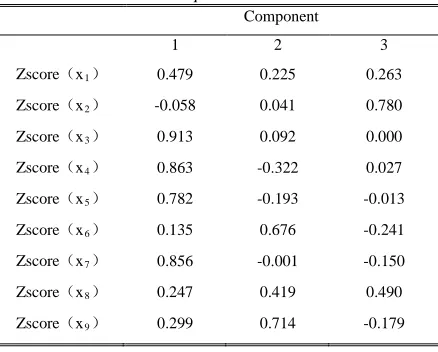
[image:4.612.308.527.346.522.2]Then use Varimax method to carry on the factor rotation of first three factors, the results show as table 2 and table 3, in which the table 2 is the factor loading matrix before rotating, table 3 is the factor loading matrix after rotating.
Table 2: Component Matrix(a)
Component
1 2 3
Zscore(x1) 0.479 0.225 0.263
Zscore(x2) -0.058 0.041 0.780
Zscore(x3) 0.913 0.092 0.000
Zscore(x4) 0.863 -0.322 0.027
Zscore(x5) 0.782 -0.193 -0.013
Zscore(x6) 0.135 0.676 -0.241
Zscore(x7) 0.856 -0.001 -0.150
Zscore(x8) 0.247 0.419 0.490
[image:4.612.310.528.391.704.2]Zscore(x9) 0.299 0.714 -0.179
Table 3:Rotated Component Matrix(A)
Component
1 2 3
Zscore(x1) 0.395 0.225 0.377
Zscore(x2) -0.106 -0.228 0.742
Zscore(x3) 0.907 0.112 0.089
Zscore(x4) 0.913 -0.119 0.037
Zscore(x5) 0.805 -0.005 0.029
Zscore(x6) -0.022 0.730 -0.006
Zscore(x7) 0.837 0.232 -0.034
Zscore(x8) 0.111 0.281 0.621
[image:4.612.310.526.542.712.2]We can see it out the constructive relation between factors from the factors after the rotation of Table 3. Among them, the first factorF1 mainly
reflects the enterprise personnel number in the hatch, enterprise income in hatch, the new hatch enterprise number and the pay taxes, and the first factor mainly manifests the enterprise incubator's innovation ability and their incubation scale. The second factor F2 mainly reflects the incubation
fund and staff’s high quality structure, mainly manifests the enterprise incubator’s management and service ability, the superior the quality of the staff structure is, the stronger of its management ability is, but as for incubation fund, it has the influence to the self development of enterprise incubator.
The third factor F3 reflects the enterprise
graduation rates and net value of fixed assets by the end of the year, which mainly manifests the enterprise incubator’s self development ability and incubation efficiency. The above three factors covers 8 of the 9 indicators, who is good for representativeness and explanatory.
We can get from Table 3 the proportion of each factor extracts each index information. Thus, we can see that:
In the first principal componentF1, employees of
enterprise in hatch, total income of the enterprise in hatch, the tax payment and new hatch enterprise are with high load, which explains this several variables has a strong relationship with this factor, and the higher the index value is, the stronger the relationship is between the variables and factor, or it becomes more distance, from that, we can see that in the variables who reflect the enterprise incubator innovation ability, the important influence factors is the total income of enterprise in hatch.
In the second principal components F2 , the
structure of staff quality and incubation fund have high load, so it demonstrates that the two variables have a closely relationship with the factors, and incubation fund has the largest contribution for main components, which reflects in the incubator self-development ability, the important factors are the incubation fund.
In the third principal component F3 , enterprise
graduation rates and net value of fixed assets by the end of the year are with high load, so it demonstrates that the two variables have the closely relationship with the factors, and enterprise graduation rate has the largest contribution for main
components F3 , which reflects the enterprise
graduation rate is also an important factor which influences the enterprise incubator innovation ability.
6. CONCLUSION
This paper evaluates the incubate ability of SME incubator with the principle component analysis and factor analysis, and makes the example evaluation to the incubate ability of 134 SME incubators in our country. Results show that, the proposed evaluation method is practical and effective; it is worth for spreading use.
ACKNOWLEDGEMENTS
Collaborative incubation problem research of Sciencifical and micro enterprise. Item number:cstc 2012cx-rkxa0063
REFERENCES:
[1] Q. Y. Yu, Q. J. Wang, J. Du. "Evaluation of enterprise's incubator's hatch ability," Science and technology, Vol. 8, No. 20, 2001, pp. 5727-5731.
[2] X. Y. Cao. "Evaluation and research of enterprise’s incubator's hatch ability,"
Scientifically progress and strategy, Vol. 18, No. 6, 2001, pp. 13-14.
[3] M. K. Shen. "The empirical research of factor analysis method on the choice of regional and strategic emerging industry," Enterprise economy, Vol. 18, No. 9, 2012, pp. 106-109. [4] Q. S. Zhu, G. C. Meng, Y. Ge. "The online video
shot boundary detection based on incremental principal component analysis," Computer engineering and science, Vol. 34, No. 1, 2012, pp. 94-97.
[5] X. N. Pang, L. Wang. "Indicator system construction of circular economic comprehensive evaluation Based on the principal component analysis method,"
Statistics and decision, Vol. 3, No. 14, 2012, pp. 56-58.
[6] M. John, S. P. Yu. "Comprehensive evaluation of Xinjiang urbanization development level Based on the principal component analysis and cluster analysis," Technology management and research, Vol. 32, No. 21, 2012, pp. 51-55. [7] Y. J. Pu, Q. Zhang, S. Huang. "Analysis of
development in the western region - based on Malmquisit index and spatial econometric model combination," Systematic engineering, Vol. 30, No. 9, 2012, pp. 94-100.
[8] A. P. Zhou, G. Cheng. "Analysis of network behavior characteristics and the influence factor Based on the peak flow," Journal of communication, Vol. 33, No. 10, 2012, pp. 117-125.
[9] F. J. Ren. "Henan industrial advantage research based on the principal component analysis,"
Scientific management and research, Vol. 32, No. 18, 2012, pp. 59-63.
[10] H. Y. Fan, D. Z. Liu, Y. H. Ma. "Three phase integration model of factor’s element analysis ,"