Development 140, 82-92 (2013) doi:10.1242/dev.082172 © 2013. Published by The Company of Biologists Ltd
INTRODUCTION
During development, gradients of intercellular signals (called morphogens) are read and modified dynamically by fields of target cells. As a result, spatiotemporal patterns of gene expression are generated. These patterns are then translated into cell function and into the development of functional body structures (Freeman and Gurdon, 2002; Davidson, 2006). Yet how the integration between intercellular signals and intracellular gene networks occurs is only beginning to be understood.
One of the best characterized family of morphogens is that of hedgehog (hh). Hh genes are evolutionarily conserved and participate in many key developmental processes. Not surprisingly, their malfunction has been associated with a number of developmental diseases and with cancer (Jiang and Hui, 2008; Varjosalo and Taipale, 2008; Ingham et al., 2011). Experimental work in Drosophila and in vertebrates indicates that the Hh signaling pathway is subject to extensive feedback among elements of the pathway, most notably that of the Hh receptor patched (ptc) (Chen and Struhl, 1996; Marigo and Tabin, 1996). Furthermore, the combination of experimental and modeling studies on developing fly wings and on vertebrate neural tube and limbs have uncovered new roles for this feedback in the dynamics of Hh gradient formation, in
its robustness and in the generation of distinct patterns of target gene expression (Briscoe et al., 2001; Saha and Schaffer, 2006; Dessaud et al., 2007; Dessaud et al., 2008; González et al., 2008; Nahmad and Stathopoulos, 2009; Dessaud et al., 2010; Irons et al., 2010; Probst et al., 2011; Balaskas et al., 2012). Therefore, the iteration between mathematical modeling and experimentation is emerging as a productive way of illuminating the problem of Hh morphogen action during organ growth and patterning. Here, we investigate this issue in a particularly simple and genetically tractable model organ: the Drosophilaocellar complex.
The Drosophilaocelli are three simple eyes [one anterior (or medial) ocellus and two posterior (or lateral) ocelli] located at the vertices of a triangular patch of cuticle on the dorsal head. Together, the ocelli and the interocellar cuticle (plus its bristles) are referred to as the ‘ocellar complex’ (Fig. 1A). The development of the ocellar complex depends on hh. Flies homozygous for a hh temperature-sensitive mutation raised at the restricted temperature during larval development (Royet and Finkelstein, 1996) or expressing a dominant-negative Ptc receptor [PtcΔloop2 (Briscoe et al., 2001)] lack the ocellar complex (Fig. 1B). Therefore, hh signaling is required for the specification and pattern of two tissue types: ocellus and interocellar cuticle.
The ocellar complex forms by the fusion of the dorsal-anterior domains of the eye discs (Haynie and Bryant, 1986). Here, the ocellar field is specified by the action of, at least, two transcription factors: the pax6 gene twin of eyeless (toy) and the Otx family member orthodenticle(otd) (ocelliless,oc– FlyBase) (Finkelstein et al., 1990; Wieschaus et al., 1992; Royet and Finkelstein, 1995; Punzo et al., 2002; Blanco et al., 2010; Wang et al., 2010; Brockmann et al., 2011). hhis expressed within the ocellar field in the prospective interocellar region (Royet and Finkelstein, 1996; 1CABD (CSIC-UPO-Junta de Andalucía), Sevilla 41013, Spain. 2Condensed Matter
Physics Department Universidad de Sevilla, Sevilla 41012, Spain. 3Istituto Regionale Vini e Oli di Sicilia, Palermo 90143, Italy.
*These authors contributed equally to this work
‡Present address: University of Konstanz, Konstanz 78457, Germany §Author for correspondence ([email protected])
Accepted 21 September 2012 SUMMARY
During development, extracellular signaling molecules interact with intracellular gene networks to control the specification, pattern and size of organs. One such signaling molecule is Hedgehog (Hh). Hh is known to act as a morphogen, instructing different fates depending on the distance to its source. However, how Hh, when signaling across a cell field, impacts organ-specific transcriptional networks is still poorly understood. Here, we investigate this issue during the development of the Drosophilaocellar complex. The development of this sensory structure, which is composed of three simple eyes (or ocelli) located at the vertices of a triangular patch of cuticle on the dorsal head, depends on Hh signaling and on the definition of three domains: two areas of eyaand soexpression – the prospective anterior and posterior ocelli – and the intervening interocellar domain. Our results highlight the role of the homeodomain transcription factor engrailed (en) both as a target and as a transcriptional repressor of hhsignaling in the prospective interocellar region. Furthermore, we identify a requirement for the Notchpathway in the establishment of enmaintenance in a Hh-independent manner. Therefore, hhsignals transiently during the specification of the interocellar domain, with enbeing required here for hhsignaling attenuation. Computational analysis further suggests that this network design confers robustness to signaling noise and constrains phenotypic variation. In summary, using genetics and modeling we have expanded the ocellar gene network to explain how the interaction between the Hh gradient and this gene network results in the generation of stable mutually exclusive gene expression domains. In addition, we discuss some general implications our model may have in some Hh-driven gene networks.
KEY WORDS: Ocellus, hedgehog, Patterning, Mathematical model, Retinal determination genes, Gene network, Drosophila,engrailed, Notch
A Hh-driven gene network controls specification, pattern
and size of the
Drosophila
simple eyes
Daniel Aguilar-Hidalgo1,2,*, María A. Domínguez-Cejudo1,*, Gabriele Amore3, Anette Brockmann1,‡, María C. Lemos2, Antonio Córdoba2and Fernando Casares1,§
D
E
V
E
LO
P
M
E
N
Royet and Finkelstein, 1997). The retinal determination (RD) genes eyes absent (eya) and sine oculis (so) are required for the formation of the ocelli (Bonini et al., 1993; Cheyette et al., 1994; Serikaku and O’Tousa, 1994; Bonini et al., 1998; Blanco et al., 2009; Blanco et al., 2010; Brockmann et al., 2011). Both eya and so are expressed with identical patterns in two domains flanking hh, and mark the prospective ocelli in late third larval (L3) stage discs (Blanco et al., 2009). The expression of eyaand sodepends on secreted Hh and on their mutual positive feedback (Pauli et al., 2005; Blanco et al., 2009). In addition to the activation of eyaand so, expression of the TALE-homeodomain transcription factor homothorax (hth) is concomitantly repressed in the ocellar domains. Otherwise, maintenance of hth expression prevents ocellar development (Brockmann et al., 2011).
In this paper, we have investigated how the single domain of hh expression is capable of generating the ocellar pattern through the regulation of a downstream gene network using both genetic and modeling approaches.
MATERIALS AND METHODS
Drosophilastrains and genetic manipulations
oc2-GAL4(Blanco et al., 2009) was used to drive UAS lines specifically in the developing dorsal anterior region of the eye-antennal imaginal disc (EAD), where the ocellar region derives from. In the case of UASdsRNAi strains, crosses were raised at 29°C, to maximize the penetrance of the knock-downs. Other crosses were set at 25°C. UAS lines used were as
follows: UAS-GFP-ptcΔloop2 [ptcDN (Briscoe et al., 2001)],
UAS-ci(Alexandre et al., 1996), UAS-mamDN(dominant negative) (Kumar and
Moses, 2001) and UAS-en(Guillén et al., 1995; Tabata et al., 1995); the
hedgehogtranscriptional reporter line hhP30(referred to herein as hh-Z)
and the engrailedtranscriptional reporter line enXho25(referred to herein
as en-Z), which are from the Bloomington Stock Center
(http://flystocks.bio.indiana.edu); and UAS-DlRNAi (28032) and
UAS-Su(H)RNAi (103597), which are from the VDRC (http://stockcenter.vdrc.at/control/main). The GFP:Ptc strain [CB02030 from Flytrap (http://flytrap.med.yale.edu/) (Buszczak et al., 2007)] is a GFP-protein trap that tags the Ptc product. Two reference strains,
Oregon-R (Or-Oregon-R) and w1118, and stocks carrying mutant alleles for patched [ptc: yw;
FRT42 ptcS2/CyO(BL # 6332)], smoothened (smo: w; smo3FRT40A/CyO),
cubitus interruptus (ci: ywhsflp; Ci+ FDT40A /CyO ;; Ci94) and Notch [N:
w[ch2], N264-39/FM4, B[+](BL # 730)] are described in FlyBase.
The flip-out method (Basler and Struhl, 1994) was used to induce gain-of-function clones. Clones were induced 48-72 hours after egg laying
(AEL) by a 10 heat-shock at 35.5°C in larvae from the cross of yw, hs-flp,
act>hsCD2>Gal4;UAS-lacZ females with UAS-hthGFP males (hth+
clones) or yw, hs-flp, act >hsCD2 >Gal4;UAS-GFPfemales with UAS-en
males (en+clones). enloss-of-function clones were generated through
mitotic recombination (Xu and Rubin, 1993) in yw, hs-flp; FRT42D
Df(2R)enE/FRT42D, ubiGFPlarvae. Df(2R)enEdeletes both the engrailed
and invected paralogous genes (described in FlyBase). Clones were induced 48-72 hours AEL by a 45 heat-shock at 37°C. Clones were marked in larval tissues by the absence of GFP. Adult heads from this experiment were mounted and their dorsal head examined for ocellar field defects. Clones were not marked in the adult.
Adult cuticle preparation and quantifications
Dorsal head cuticle pieces were dissected from adult or late pharate heads in PBS, and mounted in Hoyers solution:acetic acid (1:1), as described previously (Casares and Mann, 2000). Images were obtained in a Leica DM500B microscope with a Leica DFC490 digital camera and processed with Adobe Photoshop. Ocellar (longest axis) and interocellar lengths were measured with ImageJ (http://imagej.nih.gov/ij/) on digital images and expressed in pixels.
Immunostaining and imaging
Immunofluorescence was carried out as described previously (Bessa and Casares, 2005). Antibodies used were: guinea pig anti-Hth (Casares and
Mann, 2000), guinea pig anti-So (Mutsuddi et al., 2005), rabbit anti β
-galactosidase (Cappel), mouse Ptc (Nakano et al., 1989), mouse Eya (10H6), mouse En (4D9), mouse Dl (C594.9B) and rat anti-CiA (2A1) [which detects the activator form of Ci (Aza-Blanc et al., 1997; Méthot and Basler, 1999); all from the Developmental Studies Hybridoma Bank, University of Iowa (http://dshb.biology.uiowa.edu)]. Appropriate Alexa-conjugated secondary antibodies were used. Nuclei were counterstained with DAPI. Image acquisition was carried out in an Apotome Zeiss Axio Imager M2 fluorescence microscope and a Leica SME confocal system. Images were processed with Adobe Photoshop.
Expression profiles
[image:2.612.52.326.60.289.2]Confocal sections of GFP:ptc eye discs at different stages of L3 development, and co-stained with anti-Eya, were selected. To ensure that only signal coming from the prospective ocellar regions were analyzed, each of these regions was outlined with the lasso tool, copied and pasted on a black background and saved as a TIFF file, using Adobe Photoshop. The expression profiles were obtained from these TIFF files using ImageJ.
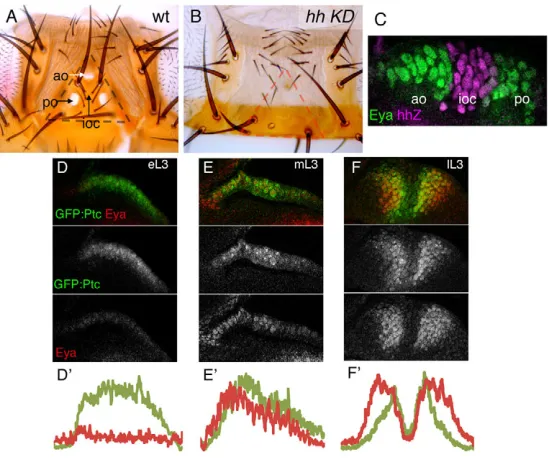
Fig. 1. Dynamic hhsignaling and the development of the ocellar complex.(A,B) Dorsal views of adult heads from wild-type (A) or oc2>ptcloop2 (hhsignaling knock down;hhKD). The ocellar complex is outlined by the triangle. Anterior ocellus (ao), posterior ocellus (po) and interocellar cuticle (ioc) are marked. All elements of the ocellar complex are obliterated when the hh signaling pathway is blocked. (C) Ocellar region of a late L3 disc from a hhZlarvae. The -galactosidase-expressing domain (magenta; hhZ) labels the prospective interocellar cuticle (ioc) and is flanked by two domains of Eya expression (green) in the prospective anterior (ao) and posterior (po) ocelli. This orientation (anterior towards the left) will be maintained throughout. (D-F⬘) Prospective ocellar regions of early (‘e’, D), mid (‘m’, E) and late (‘l’, F) third instar (L3) GFP:Ptc larvae, stained for anti-Eya. GFP signal was detected directly. Merged and single channels are shown. Below, signal intensity histograms of both GFP:Ptc (green) and Eya (red) signals of the respective discs. GFP:Ptc, which is used as a read-out of the Hh signaling, is initially expressed at high an uniform levels through the region (D-E⬘), to later evolve into a high-low-high pattern (F,F⬘). Eya expression is detected at low and uniform levels in eL3 (D,D⬘), to then increase as a single domain in mL3 (E,E⬘), which is later transformed into a high-low-high pattern similar to Ptc (F,F⬘).
D
E
V
E
LO
P
M
E
N
Temperature fluctuation assay
A temperature fluctuation assay was carried out essentially as previously (Li et al., 2009). Embryos were collected for 24 hours (at 25°C) and grown for an additional 24 hours at 25°C and then transferred to 31°C until larvae reached third instar. Then, larvae were subjected to five cycles of temperature pulses (1.5 hours at 18°C + 1.5 hours at 31°C). After these pulses, cultures were maintained at 25°C until eclosion. As controls, the same strains were grown at constant 25°C throughout development.
Model implementation
A simplified one-cell model (13 equations) was implemented using Vensim software, a visual tool for solving ODEs that allows parameter values modification in run-time (Vensim PLE version 5.11, Ventana Systems, http://www.vensim.com/software.html). This program contains a fourth order Runge Kutta method (RK4) to solve ODE systems. The 31-cell full model was implemented using MATLAB and solved with the integrator ode45.
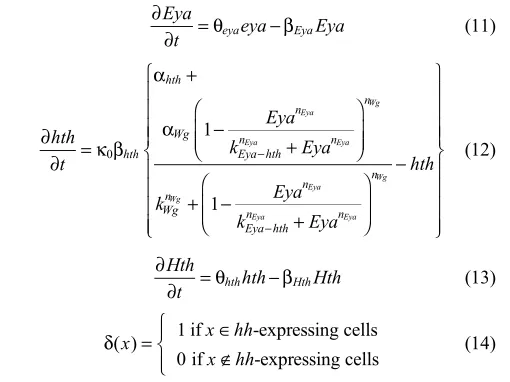
Complete list of model equations and general descriptions
Each of the 13 differential equations of the reaction-diffusion type describes the behavior of one system variable (gene transcription and protein production) in a row of 31 cells with a symmetrical distribution of cells centered on the morphogen source (five middle cells). Equation 1 describes the classical evolution of a morphogen (Hh) gradient with production and diffusion terms. In this model, the level of complexity was increased by adding a negative regulation, as formation of Ptc/Hh complexes reduces dynamically the concentration of free Hh. The production term is limited to
the hh-expressing cells, as expressed in Eqn 14.
Following von Dassow et al. (von Dassow et al., 2000), all other equations distinguish between mRNA transcription and translation. Translation is described using linear terms of production and degradation. Transcriptional regulation is described using non-linear terms, either positive or negative, in the form of compound Hill equations. The specific
form of these type of terms is ϕ(Xψ(Y,k2,n2),k1,n1), where
ϕ(X,k,n)=Xn/(kn+Xn) and ψ(Y,k,n)=1–Yn/(kn+Yn). The ocellar model
contains autoregulations. In these cases, the equation term is described as
a simple sigmoid in the form ϕ(X,k,n) (see supplementary material
Appendix S1 for further details). For each species, the equation takes specific forms, depending on its specific regulatory relationships (for example, with or without autoregulation term).
The model contains different parameter types: αx for the basal
transcription rates, βxfor the degradation rates, kxfor the Hill equation
transcriptional regulators, nxfor the Hill coefficients, θxfor the translation
rates and γx for protein complex formation. The non-dimensional
parameters k0, kCi, kEnand kCiptcare used for changing the scale of different
terms and D is the diffusion coefficient. Subscript X-Y, with X and Y
system variables, indicates regulation from X to Y. For example, kEn-ptcis
the Hill transcriptional regulation parameter of the interaction from En to
ptc. All the reaction-diffusion equations contain a degradation term.
∂ ∂ =
∂
∂ +δ α − γ − ⋅ − β Hh
t D
Hh
x ( )x hh Ptc HhPtc Hh HhHh (1) 2
2
∂
∂ =κ β
α +κ
− + ⎛ ⎝ ⎜ ⎜ ⎞ ⎠ ⎟ ⎟ + − + ⎛ ⎝ ⎜ ⎜ ⎞ ⎠ ⎟ ⎟ ⎡ ⎣ ⎢ ⎢ ⎢ ⎢ ⎢ ⎢ ⎢ ⎢ ⎤ ⎦ ⎥ ⎥ ⎥ ⎥ ⎥ ⎥ ⎥ ⎥ ⋅ − + ⎛ ⎝ ⎜⎜ ⎞⎠⎟⎟ − ⎧ ⎨ ⎪ ⎪ ⎪ ⎪ ⎪⎪ ⎩ ⎪ ⎪ ⎪ ⎪ ⎪ ⎪ ⎫ ⎬ ⎪ ⎪ ⎪ ⎪ ⎪⎪ ⎭ ⎪ ⎪ ⎪ ⎪ ⎪ ⎪ − − − − ptc t Ci Ci k Ci
k Ci Ci
k Ci
En
k En ptc
1 1 1 (2) ptc ptc Ciptc A
n Rn
Ci n R n n Ci n A
n Rn
Ci n Rn n n En ptc n n 0 CiA CiR R CiR CiR CiA A CiA CiA CiR R CiR CiR CiA En ptc
En ptc En ptc
∂
∂ =θ − γ − ⋅ − β Ptc
t ptcptc Ptc HhPtc Hh PtcPtc (3) ∂
∂ =γ − ⋅ − β PtcHh
t Ptc HhPtc Hh PtcHhPtcHh (4)
∂ ∂ =κ β
α − + ⎛ ⎝ ⎜ ⎞ ⎠ ⎟ + − + ⎛ ⎝ ⎜ ⎞⎠⎟ − ⎧ ⎨ ⎪ ⎪⎪ ⎩ ⎪ ⎪ ⎪ ⎫ ⎬ ⎪ ⎪⎪ ⎭ ⎪ ⎪ ⎪ − − − − − − − − ci t En k En k En k En ci 1 1 (5) ci ci n
En cin n n cin n En ci n n n 0 En ci
En ci En ci Ci
ci
En ci
En ci En ci Ci
(
)
∂
∂ =κ β θ − − κ − ⎛ ⎝⎜ ⎞ ⎠⎟ +⎛ ⎝⎜ ⎞ ⎠⎟ ⎛ ⎝ ⎜ ⎜ ⎜ ⎜ ⎜ ⎞ ⎠ ⎟ ⎟ ⎟ ⎟ ⎟ + − ⎛ ⎝⎜ ⎞ ⎠⎟ +⎛⎝⎜ ⎞⎠⎟ ⎛ ⎝ ⎜ ⎜ ⎜ ⎜ ⎜ ⎞ ⎠ ⎟ ⎟ ⎟ ⎟ ⎟ Ci
t ci Ci
Ci PtcHh Ptc k PtcHh Ptc k Ci PtcHh Ptc k PtcHh Ptc 1 1 (6) A
Ci ci A Ci An n PHn n n Ci n An n PHn n n 0 A CiA PH PH PH CiA A CiA CiA PH PH PH CiA ∂ ∂ =κ
− ⎛ ⎝⎜ ⎞ ⎠⎟ +⎛ ⎝⎜ ⎞ ⎠⎟ ⎛ ⎝ ⎜ ⎜ ⎜ ⎜ ⎜ ⎞ ⎠ ⎟ ⎟ ⎟ ⎟ ⎟ + − ⎛ ⎝⎜ ⎞ ⎠⎟ +⎛ ⎝⎜ ⎞ ⎠⎟ ⎛ ⎝ ⎜ ⎜ ⎜ ⎜ ⎜ ⎞ ⎠ ⎟ ⎟ ⎟ ⎟ ⎟
− κ β Ci t Ci PtcHh Ptc k PtcHh Ptc k Ci PtcHh Ptc k PtcHh Ptc Ci 1 1 (7) R Ci An n PHn n n Ci n A n n PHn n n Ci R 0 CiA PH PH PH CiA A CiA CiA PH PH PH CiA R ∂ ∂ =κ β
α + − + ⎛ ⎝ ⎜ ⎜ ⎞ ⎠ ⎟ ⎟ + − + ⎛ ⎝ ⎜ ⎜ ⎞ ⎠ ⎟ ⎟ ⎡ ⎣ ⎢ ⎢ ⎢ ⎢ ⎢ ⎢ ⎢ ⎤ ⎦ ⎥ ⎥ ⎥ ⎥ ⎥ ⎥ ⎥ +κ + − ⎧ ⎨ ⎪ ⎪ ⎪ ⎪⎪ ⎩ ⎪ ⎪ ⎪ ⎪ ⎪ ⎫ ⎬ ⎪ ⎪ ⎪ ⎪⎪ ⎭ ⎪ ⎪ ⎪ ⎪ ⎪ en t Ci Ci k Ci
k Ci Ci
k Ci
En
k En en
1 1 (8) en en A
n Rn
Ci n Rn n Ci n
An R
n Ci n Rn n En n DlEn n n 0 CiA CiR R CiR CiR CiA A CiA CiA CiR R CiR CiR CiA En En En ∂
∂ =θ − β En
t enen EnEn (9)
∂
∂ =κ β
α + α − + ⎛ ⎝ ⎜⎜ ⎞⎠⎟⎟ + − + ⎛ ⎝ ⎜⎜ ⎞⎠⎟⎟ + + − ⎧ ⎨ ⎪ ⎪ ⎪ ⎪ ⎪ ⎪⎪ ⎩ ⎪ ⎪ ⎪ ⎪ ⎪ ⎪ ⎪ ⎫ ⎬ ⎪ ⎪ ⎪ ⎪ ⎪ ⎪⎪ ⎭ ⎪ ⎪ ⎪ ⎪ ⎪ ⎪ ⎪ − − eya t Ci Hth k Hth k Ci Hth k Hth Eya
k Eya eya
1 1 (10) eya eya Toy A n n
Hth eyan n n Ci eya n A n n Hth eya n n n n
Eyan n 0 CiA Hth Hth Hth CiA A CiA CiA Hth Hth Hth CiA Eya
Eya Eya
D
RESULTS
Hh signaling and eyes absent expression are dynamic during ocellar patterning
In order to understand how the ocellar pattern (Fig. 1C) was generated, we analyzed the expression of ptc (a Hh signaling readout) and eyes absent (eya) (a Hh target) in the prospective ocellar region throughout L3. To monitor Ptc expression, we used a GFP:Ptc protein trap line. In early L3 discs, we detected a single domain of GFP:Ptc expression and uniformly low levels of Eya (Fig. 1D). By mid-L3, levels of Eya rise within the GFP:Ptc-expressing region, also as a single domain (Fig. 1E). From mid to late-L3, the final pattern arises through the repression of Ptc/Eya expression in the prospective interocellar cuticle (Fig. 1F). This pattern suggests the existence of a repressor capable of attenuating the hh pathway in the middle of the ocellar field [see also Brockmann et al. (Brockmann et al., 2011)] and whose expression and/or activity should build up during L3.
engrailed is activated by Hh and attenuates its signaling pathway to establish the ocellar pattern engrailed (en) is a candidate hhrepressor. It encodes a homeodomain transcription factor with an additional transcriptional repressor domain (Jaynes and O’Farrell, 1991). En is known to repress transcription of two major hhsignaling components, ptcand ci, in embryos and wing imaginal discs (Eaton and Kornberg, 1990; Hidalgo and Ingham, 1990; Sanicola et al., 1995; Schwartz et al., 1995; Domínguez et al., 1996; Biehs et al., 2010). In the wing, hh expression in its posterior compartment depends on en. However, hh signaling from the posterior compartment induces enexpression in anterior cells at a short range. Therefore, enis a low sensitivity hh target in the anterior wing (Guillén et al., 1995; Ohlmeyer and Kalderon, 1998; Méthot and Basler, 1999). In the ocellar region, hh expression precedes that of en, which is expressed in a hh-like pattern in late L3 (Royet and Finkelstein, 1996). These results suggest that encould be a hhtarget in the ocellar region. To test this point, we first checked the relative expression of hh, using the hh-Z strain as a hhtranscriptional reporter, and of en. Their domains almost completely overlapped, with some En-only cells adjacent to the hh-Zdomain (Fig. 2A). Second, when we knocked down the hh signaling pathway in oc2 >GFP-PtcΔloop2discs, enexpression was lost. The expression of so, which follows that of eya, was also lost from the ocellar region, confirming the effectiveness of the knock-down (Fig. 2B). This result indicated that enis a hhpathway target
∂
∂ =θ − β Eya
t eyaeya EyaEya (11)
∂
∂ =κ β
α +
α −
+
⎛ ⎝
⎜⎜ ⎞⎠⎟⎟
+ −
+
⎛ ⎝
⎜⎜ ⎞⎠⎟⎟ − ⎧
⎨ ⎪ ⎪ ⎪⎪
⎩ ⎪ ⎪ ⎪ ⎪
⎫
⎬ ⎪ ⎪ ⎪⎪
⎭ ⎪ ⎪ ⎪ ⎪
−
−
hth t
Eya
k Eya
k Eya
k Eya
hth 1
1
(12) hth
hth
Wg
n
Eya hth
n n
n
Wgn
n
Eya hth
n n
n 0
Eya
Eya Eya
Wg
Wg
Eya
Eya Eya
Wg
∂
∂ =θ − β Hth
t hthhth HthHth (13)
δ = ∈
∉ ⎧ ⎨ ⎪ ⎩⎪
x x hh
x hh
( ) 1 if -expressing cells
0 if -expressing cells (14)
in the ocellar region. To test for enfunction, we carried out three experiments. First, we verified the status of the hhsignaling pathway in the en-expressing cells by examining ciexpression. In the en domain, ciis repressed (Fig. 3A), a fact that is consistent with the repressor role of enin other developmental contexts. Second, to test directly this repressing role, we induced marked clones of cells homozygous for the Df(2R)enE. This deficiency removes both en and its paralog invected (inv), thus avoiding potential functional redundancy between both genes. In Df(2R)enEclones spanning the ocellar field the expression of Ptc and Ci is now continuous, lacking the characteristic gap in the prospective interocellar region (Fig. 3B). In adult mosaics, the anterior and posterior ocelli are often fused (Fig. 3C). The fact that the area of the fused ocelli is larger than the sum of the wild-type anterior and posterior ones suggests that the increase in ocellar surface is at the expense of interocellar cuticle. And third, we checked the effects of enoverexpression on the hh target eya. In GFP-marked en-expressing clones, eyais repressed in a cell-autonomous manner (Fig. 3D). This eya loss could be explained either by endirectly repressing eyaor, indirectly, by en blocking the hh pathway. To distinguish between these two possibilities, we overexpressed ci throughout the ocellar field in oc2>cilarvae, therefore making citranscription insensitive to en regulation. In these larvae, the expression of both eyaand enis detected in most of the ocellar field (Fig. 3E,F). Therefore, Ci can activate eya even in the presence of en. In oc2>ci adults, the resulting ocellar complex is composed of a large, single ocellus, without interocellar cuticle (Fig. 3G). This indicates that eyais functionally epistatic over en, and suggests that the primary role of enis as a hhpathway regulator. In all, these results indicate that high concentrations of Hh result in high en expression, which in turn attenuates hh signaling in the middle of the ocellar field. As a consequence, RD expression and ocellar specification can only occur in regions that flank the endomain, which becomes the interocellar domain.
Delta:Notchsignaling is required for en
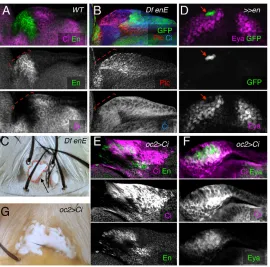
[image:4.612.50.305.58.249.2]maintenance and interocellar region specification en lays both downstream and upstream of the Hh signaling pathway, being activated by Hh and also repressing the pathway Fig. 2.enis a hh-signaling target.(A-B⬘) Ocellar fields of late-L3 larvae. (A) hh-Zlarva stained for -galactosidase (‘hh-Z’) and anti-En. Individual channels are shown. The red arrows indicate nuclei expressing En, but not -galactosidase. (B,B⬘) oc2>ptcloop2-GFP larva, stained for En and So. The expression of ptcloop2is detected in the ocellar field as the GFP-positive patch (arrows). In this region, the en expression is almost totally absent. The En channel is shown separately (B⬘). In this genotype, So expression is also lost, indicating that the hh-signaling knock down induced by overexpression of ptcloop2is effective.
D
E
V
E
LO
P
M
E
N
components ci and ptc. Therefore, these genetic relationships should lead to an unstable enexpression (indeed, this conjecture was confirmed by our mathematical modeling, see below). Therefore, after its induction by hh signaling, an additional mechanism was required to stably maintain high levels of en expression in a hh-independent manner. It had been reported that in individuals mutant for a Notchtemperature-sensitive (Nts) allele,
raised at the restrictive temperature during late larval life, the ocelli fuse (Amin, 2004), generating a ‘cyclopic’ ocellus similar to that observed in Df(2R)enEmosaics. To confirm the involvement of Notch signaling in ocellar development, we genetically manipulated several Notchpathway components. Ocellar-specific knock-downs of the nuclear transducer Su(H)[Su(H)KD] and the Dlligand (Dl KD), or the overexpression of a dominant-negative
form of mastermind (mamDN), a Notchco-activator, resulted in expanded or fused ocelli (Fig. 4A; and not shown). Interestingly, similar knock down of the other Notchligand, Ser, does not affect ocellar complex development (not shown). The similarity between the Notchpathway mutant phenotypes and the loss of enpointed to Notchsignaling being required for enexpression. Indeed, in Su(H)KDdiscs, the endomain is reduced in size and expression intensity and, concomitantly, the two RD domains extend, contacting each other (Fig. 4B,C).
[image:5.612.52.322.59.326.2]In principle, the input of Dl/Notch in the network could be upstream of hh(maintaining its expression or signaling) or parallel to hh. However, the incomplete activation of enshould persist in the former scenario. When we checked the signaling status of the hhpathway in Su(H)KDdiscs by analyzing ptcexpression, we Fig. 3.enis a repressor of the hhpathway that is required for the interocellar region.(A,B,D-F) Ocellar fields of late-L3 larvae and (C,G) adult ocellar regions. (A) Wild-type ocellar field stained for En and Ci. The expression patterns of En and Ci are mutually exclusive. (B) A DfenEclone spanning the ocellar region. Within the mutant tissue (marked by the absence of GFP), Ptc and Ci are now expressed. The broken lines in A,B mark the approximate span of the En domain in a wild-type disc. (C) Ocellar region of an adult containing unmarked DfenEclones. A single ocellus extends over the whole left region (arrow). (D) Small en-expressing clone (>>en), marked with GFP, represses Eya cell-autonomously (arrows). (E,F) Ocellar fields from oc2>ci larvae express high levels of Ci (magenta). Both En (E) and Eya (F) are expressed in a single domain. In all immunofluorescence images, merged and separate channels are shown. (G) Ocellar region of a oc2>ciadult showing the enlargement of the ocelli and absence of interocellar cuticle. The fact that in this genotype both enand RD genes, such as eya,are expressed indicates that RD genes are functionally epistatic over en.
Fig. 4.Notchsignaling is required for enexpression and the specification of the interocellar region.(A) Adult dorsal head and (B-D) late-L3 ocellar fields. (A) A oc2>Su(H) RNAi [Su(H)KD] individual, showing enlarged ocelli (asterisks) at the expense of the interocellar region. No interocellar bristles remain. The ocellar complex region is marked by the triangle. (B) Wild-type expression of enand so.(C) In Su(H)KDdiscs, the en expression domain is weaker and smaller, whereas the sodomains extend and fuse into a single domain. (D) In this genotype, the hhsignaling
pathway is not compromised, as strong Ptc signal is detected throughout the prospective ocellar field.
D
E
V
E
LO
P
M
E
N
[image:5.612.52.500.515.682.2]detected an unsplit domain of strong Ptc signal, indicative of sustained hh production and signaling when the activity of the Notch pathway is reduced (Fig. 4D). In addition, the fact that knocking down the Notchpathway still allowed specification of ocelli, which is a hh-controlled fate, agrees with Dl/Notchacting parallel to, or downstream of, hh.
To determine the developmental window in which Notch signaling was required for the maintenance of en, we performed the following experiment. Dl expression was knocked down at different times during third instar, taking advantage of the temperature sensitivity of the GAL4/UAS system (supplementary material Fig. S1; see also Materials and methods), and the size of the interocellar cuticle in adults was analyzed, the fate of which depends on stable and high levels of enexpression. Interocellar cuticle surface was estimated by the number of interocellar bristles formed (from 0 in its absence, to 6-8 in the wild type). Disconnecting Dl/Notchsignaling using a UAS-Dl-RNAi ( oc2>Dl-RNAi or ‘Dl KD’) prior to 80 hours post fertilization (hpf) results in almost total absence of interocellar cuticle. Dl KDduring the 80-85 hpf interval results in intermediate phenotypes with incomplete and variable interocellar regions (supplementary material Fig. S1). Interestingly, this developmental window coincides with the establishment of a strong domain of enexpression and the split of the eya/sodomain in the disc (not shown). Knocking down Dlafter 85 hpf no longer precludes the generation of the interocellar cuticle. This result shows that Notch signaling activity is required to establish the interocellar fate during a short developmental interval (coinciding with upregulation of en in the ocellar field), after which, it remains stable. As the interocellar fate depends on en, we interpret this result as enexpression becoming fixed by Notch during the 80-85 hour interval.
A mathematical model for the Hh-driven ocellar patterning
In order to test whether our genetic reasoning was capable of generating the ocellar pattern, we developed a mathematical model incorporating all known genetic interactions (Fig. 5A). Several simplifications were made. First, the two-dimensional ocellar region is modeled as one dimensional (i.e. Fig. 5B, as a row of 31 cells). Second, the hhtranscription domain (the central five cells) is set as a de facto in our model. Third, our model assumes that there is no proliferation during the developmental interval considered (see supplementary material Appendix S1). Hh production and diffusion have been modeled as in Eqn 1 (see Materials and methods), similar to the formalism used by Nahmad and Stathopoulos to model Hh gradient formation in the wing primordium, considering a diffusion coefficient of D=0.5μm2/s (Nahmad and Stathopoulos, 2009). Downstream of the Hh gradient, transcription and translation of all genes have been modeled using ordinary differential equations (ODEs), essentially following the modeling of the Drosophila embryonic segment polarity network by von Dassow and colleagues (von Dassow et al., 2000). Gene transcription may generally be affected by basal (b) and regulated transcription (T), and autoregulation (a), plus a decay term (Fig. 5C). Autoregulation is relevant only for enand eya. Transcriptional regulation terms have been modeled as sigmoids, allowing for potential cooperativity in transcriptional activation and repression. The general form of the transcription and translation equations, as well as the full set of equations are described in Materials and methods. In what follows, we explain how the new regulatory steps have been modeled. Further details on the specific biology underlying other equations (Eqns 2-7) are
described in supplementary material Appendix S1. We have shown that Dl/Notchsignaling is required for maintaining high En levels in the interocellar region. We have modeled enmaintenance as an autoregulation (Eqn 8), as en has been shown to autoregulate during embryo segmentation (Heemskerk et al., 1991). The contribution of Dl/Notch signaling would be to facilitate the autoregulation of en by lowering k in the autoregulatory term (which indicates the En concentration for which half autoregulatory activation is reached). Because of this, it has been named kDlEn.
This implementation is the simplest form of representing the role of Dl/Notchin allowing enautoregulation we could think of. It considers a constant and uniform Dl/Notchinput and that the hh and Notch pathway act independently of one another. The en autoregulation adds on top of a positive Hh signaling input on en transcription (Eqn 8). The expression of eyahas been shown to depend only on CiA (Blanco et al., 2009), so no CiR input on eya regulation has been included. In addition, the eya-so positive-feedback loop (Pauli et al., 2005; Brockmann et al., 2011) has been collapsed into a direct eyaautoregulation for simplicity (Eqn 10). In addition, previous results had suggested a mutual repression between hthand eya(Brockmann et al., 2011), which is probably direct (supplementary material Fig. S2). Therefore, hthhas been modeled as a repressor input on eya(Eqn 10). In addition, hth transcription is modeled as being positively regulated by a constant term (αwg) (Eqn 12), which represents the likely action of
Wnt1/wingless (wg) (Azpiazu and Morata, 2000; Casares and Mann, 2000; Pichaud and Casares, 2000).
[image:6.612.324.556.59.260.2]The working model has 61 free parameters. For a few, prior biological knowledge is helpful in defining at least some ranges. For example, the basal transcription rates of ptcand ciare positive, as these genes are widely transcribed. In order to generate a working set of parameter values that result in the target ‘wild-type’ Fig. 5. Regulatory network and one-dimensional model.
(A) Biotapestry ‘view from the genome’ of the gene network. (B) One-dimensional lattice of 31 cells. hhis transcribed in the middle five cells (stripes). The target patterns for Eya (green), En (purple) and Hth (blue) are represented. These patterns correspond to the prospective ocellar (OC), interocellar (IOC) and periocellar (POC) regions. (C) Generic gene (g) model. Transcript (g) and protein product (G) are indicated. The rate of transcription is dictated by basal transcription rate (‘b’), regulated transcription, both positive and negative (‘T’), and autoregulation (‘a’). Decay rates applying to g and G and have not been represented.
D
E
V
E
LO
P
M
E
N
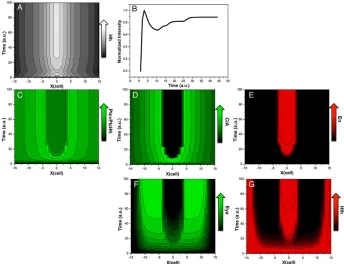
pattern (Fig. 5B, seven interocellar and two patches of nine ocellar cells in a 31 row), we first built a one-cell model in which to carry out the first parameter exploration. Then, this parameter set was used as a starting point to manually fine-tune the parameter values on the full model to reach a control pattern (see Materials and methods for further details). With this set of parameter values (supplementary material Table S1), the model accurately recapitulates the target pattern, including the dynamics of Eya, Ptc, CiA, En and Hth expression (Fig. 6; supplementary material Fig. S3). Modeling indicates that before reaching a steady state, the Hh gradient undergoes a transient expansion or ‘overshoot’ (Fig. 6A,B). This early dynamics depends on the non-linear Ptc-mediated feedback (Casali and Struhl, 2004; Nahmad and Stathopoulos, 2009). The model also predicts observed mutant behaviors, including the expansion of the ocellar tissue at the expense of interocellar cuticle in Dl and en loss-of-function mutants, or the effects of hth on ocellar size (supplementary material Fig. S4). Another computational experiment, the overexpression of Dl, predicted the expansion of the interocellar region at the expense of the ocelli. When this prediction was tested experimentally, by overexpressing Dlin the developing ocellar region (oc2>Dl), the interocellar region enlarged and the anterior ocellus disappeared (supplementary material Fig. S4).
The model GRN is robust against variations in initial conditions and noise
An important test for any systems behavior is the stability of its solution and whether this solution is unique or not. To test this point, the initial condition of every system variable was randomized (up to a 10-fold change) in each individual cell (supplementary material Table S2). The solution obtained for the system is stable, as the resulting patterns are the same as the wild type (supplementary material Fig. S5A). Only when the initial condition for En exceeds the concentration determined by the parameter kDlEn, which is responsible for En autoregulation
(kDlEn>0.2), is enexpression fixed throughout, which precludes the
establishment of the eya pattern, as expected (supplementary material Fig. 5B,C). In fact, En expression is not detected in the ocellar region until mid-L3, after Eya expression has increased uniformly in the ocellar region (not shown).
Next, and to test whether the network topology is robust to fluctuations, we perturbed all parameters related with production and degradation rates (αX,θX,βX) with a uniform random signal (white noise). The noise amplitude was 20% for each corresponding rate (Fig. 7A). This fluctuation alters the evolution of the network elements as shown in the Eya time series of Fig. 7B. Under these conditions, the system reproduces the ocellar pattern with a slight deviation (widening) of the interocellar region. This experiment shows that indeed the network model is robust. To further test the robustness of the biological system, we subjected several Drosophilastrains to temperature fluctuations during early L3, as a means to increase the noise in the system (Li et al., 2009). We included two reference strains as controls (the wild-type strain Oregon-R and w1118) and stocks in which the gene dose of smo,ptc,
ciand Notchis halved (see Materials and methods), and measured the longer axes of the anterior and posterior ocelli and the interocellar distance. These different genotypes can be thought of as representing the same gene network in which the parameter values may have different, genotype-specific, values. First, we found that different strains showed differences in ocellar and interocellar sizes, indicating that the genotype has a significant influence in the precise size and proportions within the ocellar complex (supplementary material Fig. S6). Second, and directly related to the aim of the experiment, we found that for some genotypes, the temperature fluctuation regime results in size deviations from the control. However, these deviations are smaller than the differences between genotypes. For example, while the difference in ocellar size between w1118and Notch–/+(at 25°C) is
[image:7.612.50.394.473.737.2]about 12%, the temperature fluctuations alter ocellar size in Notch–/+ by only 5%. Furthermore, the external noise introduced did not result in a significantly ‘noisier’ phenotype, measured as the coefficient of variation of ocellar and interocellar sizes
Fig. 6. Spatiotemporal dynamics of the Hh gradient and observed model variables.(A) Surface contour plot showing the Hh gradient dynamics. (B) Temporal variation of Hh concentration (normalized intensity) in cell 5. The magnitude of the Hh gradient varies with time, with an early ‘overshoot’, followed by a retraction to then reaching steady state. (C-G) Surface contour plots for the wild-type set of parameters depicting the dynamics of the variables that have been experimentally analyzed: total Ptc (Ptc+Ptc:Hh, C), CiA (D), En (E), Eya (F) and Hth (G). With this parameter set, the model correctly predicts qualitatively the biological pattern. (a.u.: arbitrary units). Cell number is represented on the xaxis.
D
E
V
E
LO
P
M
E
N
(supplementary material Fig. S6). Therefore, the ocellar complex is robust against noise, as the model predicts. In addition, different genotypes, equivalent to the same gene network with a (presumably slightly) different set of parameter values, give rise to ocellar patterns that are also quantitatively different, even if these differences are small. The next section explores the properties of the model across the parameter space.
Exploration of parameter space suggests that the network imposes constraints on phenotypic variation
Next, we carried a parameter sensitivity assay. First, and starting with our working parameter set, we varied one parameter at a time in a two orders of magnitude range around its wild-type value, and measured the departure this variation caused from the wild-type pattern. As a metric for this deviation, we calculated a goodness score as a distance (λ) between the wild-type Eya pattern and that obtained from the varied parameter run, both normalized (see supplementary material Appendix S1). We established three thresholds for the complementary of this distance (1-λ): 1-λ≥0.8 (‘good’), 0.8>1-λ≥0.6 (‘medium’) and 0.6>1-λ≥0.4 (‘bad’), with 1-λ≥0.8 being the most accurate fits (Fig. 7D,E; supplementary material Table S1). Twenty-eight out of 61 parameters gave goodness values above 0.8 over several orders of magnitude and were classified as ‘insensitive’ (i.e. large variations in their value did not result in major deviations from the target pattern) (Fig. 7E; supplementary material Fig. S9.1-9.4; supplementary material Table S1). The remaining ones (33) were sensitive (Fig. 7D), although the range of values for each specific parameter that resulted in a score of at least 0.8 varied among them (see supplementary material Table S1). The most sensitive parameter is the basal transcription rate constant
αen,which is also the parameter that does not allow variation in the noise experiments. This suggests that enexpression has to be kept strictly off in the absence of patterned Hh signal. Not surprisingly, other sensitive parameters are those related to ptc
and ci expression, which affect the major feedbacks in the network (supplementary material Table S1).
[image:8.612.51.371.59.328.2]Second, we carried out an analysis in which all 33 sensitive parameters were simultaneously randomized at each run inside one of the goodness intervals (the remaining parameters were left fixed at their wild-type values). A total of 10,000 runs were obtained, distributed among ‘good’ (6000), ‘medium’ (3000) and ‘bad’ (1000) randomized parameter values. For all 10,000 parameter sets, the distance for all the patterns of the system (one per variable) to the wild type was calculated. In this way, each parameter set defines a point in a 13-dimensional space, each dimension being one of the model variables (see supplementary material Appendix S1). For visualization, this information was reduced to three dimensions, two of them being the projections of the distance distributions two by two, and another representing the density of multidimensional points in such projections. The resulting 2D histogram (Fig. 7F; supplementary material Fig. S7) plots the density of patterns from the 10,000 randomized runs distributed relative to their distance from the wild type (point 0,0) (see supplementary material Appendix S1 for details). Therefore, it represents a map of the phenotypic space generated by the GRN (gene regulatory network) using randomized sets of parameters. Several conclusions can be derived from this analysis. First, the distribution of solutions (patterns) was not evenly dispersed. Instead, the solutions tended to concentrate in clusters or ‘islands’. Second, the wild-type pattern was placed inside a big and dense cluster, so this solution is highly probable, which indicates that the pattern is stable. Finally, when we analyzed the patterns of Eya and En (the two major readouts of the GRN) located in dense islands far apart from the wild type, we found that those patterns were still qualitatively similar to the wild type [Fig. 7F; see, for example, the high stability island around (−0.7,0.7) in supplementary material Fig. S7B]. This is interesting, because in this experiment we used parameter values coming not only from the ‘good’ interval, but also from ‘medium’ and ‘bad’ ones, as derived from our previous single parameter analysis. In summary, these analyses indicate that the
Fig. 7. Analysis of the robustness of the model against noise and parameter variations.(A) Application of a white noise distribution of 20% amplitude to enas an example of noise implementation. (B) Eya time series with- and without-noise rates, shown in black and red. (C) Eya (red) and En (black) patterns when applying noise (continuous) or without noise (discontinuous). Rates with noise result in slightly broader interocellar region. (D,E) Examples of complementary distance when varying each parameter at a time over a range of two orders of magnitude. (D) ptcpresents narrow ranges for ‘good’, ‘medium’ and ‘bad’ patterns [thresholds black (>0.8), red (0.6-0.8) and blue (0.4-0.6), respectively], while (E) nen remains in the ‘good’ range in most of the studied range. (F) Density plot of 10,000 points in the 13-dimensional space corresponding to the distances of the 13 variable patterns to the wild type (black dot, situated at point 0,0). Some Eya and En patterns are also shown
corresponding to the wild-type condition (bottom-left diagram) and three additional cases extracted from dense clusters located at different distances from the control.
D
E
V
E
LO
P
M
E
N
GRN is robust, because wide and random parameter variation results in specific phenotypic clusters, all of them similar to the wild type.
DISCUSSION
Many gene networks are described as static regulatory (activating and inhibitory) relationships between network components (genes and their products), disregarding essential dynamic and spatial aspects. In such descriptions, all genetic interactions are given as though happening at once and without spatial context. Mathematical modeling allows us to test the logic consistency of such networks, and whether or not they are capable of explaining the spatial and temporal dynamics of the biological system.
Using an integration of experimentation and mathematical network modeling, our results help to explain how several alternative fates are controlled by the Hh morphogen (Fig. 8). Previous descriptions of the genetic interactions involved in the specification and patterning of the ocellar complex structures did not offer satisfactory explanations for this fate choice decision.
A first important point is the addition to the GRN of enas a hhtarget with self-maintaining capability. The transduction of the Hh gradient generates an initial asymmetry, with only the cells receiving the highest Hh concentrations being able to maintain enexpression. This in turn sets in motion the dynamics of the GRN. The evolution of some key system components is shown in Fig. 8.
A second important point is the action of enas a Hh-pathway repressor. The fact that enexpression is sustained just in cells receiving the highest Hh concentrations (the Hh-producing cells and their adjacent neighbors) makes these cells read the Hh signal only transiently, as the signaling pathway is blocked as en expression builds up. This means that it would be impossible for
ento reach sufficient expression levels to shut off the pathway – and therefore, to inactivate eya– unless additional mechanisms were considered. In fact, the inactivation of eyais necessary for the specification of the interocellar region: thus, uniform and high ci expression results in the co-expression of eyaand enthroughout the ocellar field. In this situation, eyais functionally epistatic over en, and the only tissue type specified is ocellus. Therefore, a stable interocellar region can be established only if the initiation of en expression is followed by a hhsignaling-independent phase. Such a transition from signal-induced expression to independent mode of maintenance has been reported for en during Drosophila embryonic segmentation (Heemskerk et al., 1991). In the ocellar field, we propose that this transition requires Notch signaling, specifically activated by its ligand Dl (but not by Ser). The molecular mechanisms of this enmaintenance are not yet clear, but might involve PREs (polycomb response elements) in the enlocus (Kwon et al., 2009).
[image:9.612.52.561.439.578.2]Our model includes another repressor, hth, which enters the network as a direct repressor of RD. Its contribution seems limited to restricting the external extent of the eya/soexpression domain. In hthKDanimals, the ocelli are larger, but the interocellar cuticle is still present. In our model, enrepressive action suffices to turn off hhsignaling pathway, thereby precluding RD activation. We have tested, through modeling, the possibility of hthbeing required for en activity, as it has been shown to be the case during embryonic segmentation (Kobayashi et al., 2003). In this case, though, making the repression function of endependent on hth does not allow the network to reach any steady state in which the interocellar domain is established – i.e. endoes not reach the maintenance threshold. To verify this prediction, we checked en expression and the activity status of the hhpathway in hthKDdiscs. As predicted, enis expressed at normal levels in a domain where ciis off, as in wild type (supplementary material Fig. S8).
Fig. 8. Logic of the ocellar complex GRN.A Biotapestry representation of the ocellar complex (OC) GRN architecture. Genes are represented by horizontal lines topped by a bent arrow (the transcriptional start site, TSS). Positive and negative interactions (lines emerging from the TSS) are represented by arrows or capped lines, respectively. Protein-protein interactions are represented by circles. Different cell types are symbolized with colored boxes (named accordingly). Cell signaling is represented by lines reaching from inside one cell type to the outside (thickness indicates strength of the signaling); chevrons and circles are used to represent signal reception and transduction, respectively. White circles outside cell boxes represent signaling ligands. Genes and interactions are represented in color if active, in gray otherwise. Three cell types are specified according to the decreasing level of Hh signal they receive: inter-ocellar, ocellar and periocellar cells. Hh signal triggers both RD genes (eyaand so) and en expression. In interocellar cells, high Hh concentrations promote the expression of en, which in turn represses RD genes by shutting down ptcand ci expression, and therefore eliminating Hh signal reception. Inside ocellar cells, enexpression does not occur because of weaker Hh signaling; this makes RD gene activation possible. Ocellar and interocellar cells therefore achieve distinct gene expression patterns. In interocellar cells, en expression is maintained by the Dl/Notchpathway (present throughout the entire OC). This particular interaction is represented with a diamond (within the enauto-activation line). RD genes expression domain is also defined through the contribution of hth; this gene is likely to be activated downstream of the wgpathway. In ocellar cells, Eya and So (acting as a complex) repress hth. Periocellar cells lie at the periphery of Hh signaling and RD gene activation is prevented by Hth: this repression contributes to define the size of the ocelli. The periocellar region gives rise to the front
cuticle in the adult head.
D
E
V
E
LO
P
M
E
N
Recently, a similar situation to the one we detailed here has been described during the dorsoventral patterning of the vertebrate neural tube by Shh(Ribes et al., 2010). The floor plate (FP), the ventral-most region of the neural tube, expresses Shhand requires maximal Shhconcentrations for its specification (Chiang et al., 1996; Ericson et al., 1996). However, this requirement is transient and followed by an attenuation of the pathway. This attenuation is necessary for FP specification (Ribes et al., 2010). This process of FP specification is reminiscent of the specification of the interocellar cuticle in our system. This similarity raises the possibility that a negative-feedback loop in the Shhpathway, of the type we have described here, could be part of the neural tube GRN. However, after the initial asymmetry within the ocellar field has been established, an external input, the Dl/Notchsignal, is needed to maintain it. In our model, there is no need for a localized Notch signal: uniform signaling suffices, provided that en expression reaches a specific concentration threshold. In fact, using an anti-Dl monoclonal antibody, we detect uniform levels of Dlexpression in the ocellar field in mid-L3 (not shown), the developmental period when we start to see the distinct domains emerging. Interestingly, a recent report finds an association between mutations in Dll1,a vertebrate Dl-like ligand, and holoprosencephaly (Dupé et al., 2011). Holoprosencephaly, a developmental defect caused by abnormal specification of the ventral midline structures of the anterior neural tube, is frequently associated with malfunction of the Shh pathway. In fact, work in vertebrates indicates that Notch signaling is indeed required for FP fate acquisition parallel to Shh (le Roux et al., 2003; Peyrot et al., 2011). It is therefore tempting to speculate that the Notchpathway is required to fix the FP fate in the vertebrate neural tube by stabilizing gene expression during the phase of Shhsignaling attenuation, as we propose here for Notch in the Drosophilaocellar GRN.
The model we have described explains how mutually exclusive gene expression domains are produced under the control of a Hh gradient by connecting a repressive gene circuitry. These expression domains underlie the morphology of the structures that will later form and cannot be explained unless the information of Hh gradient is integrated with the logic of the GRN. They can therefore be considered as the emerging properties of the system we have described.
The structure of this GRN confers robustness to the patterning mechanism, buffering variations in the initial conditions, as well as absorbing noise. Although the model predicts an early overshoot of the Hh gradient, this might not be crucial, as variations in the initial conditions converge to the same pattern.
Interestingly, random variation of parameter values results in the system deviating from the ‘wild-type’ pattern in a non-random manner, but instead falling into specific ‘islands’ of the phenotypic space. That is, variations in the control parameters of the GRN generate phenotypes that maintain certain rules of proportionality. Still these phenotypic ‘variants’ are robust against noise, as is the wild-type pattern (supplementary material Fig. S7). These mathematical properties of the ocellar network might ensure the phenotypic stability of the ocellar structures in wild flies exposed to varying environmental conditions during development, as well as constraining the phenotypic variability of the ocelli during evolution.
Acknowledgements
We thank I. Guerrero, I. Rebay and R. S. Mann for antibodies; P. Rojas, J. Blanco, C. M. Luque, the Bloomington, VDRC and Flytrap Stock Centers, and the Consolider ‘From Genes to Shape’ DrosophilaCollection for fly strains; and O. Abreu for help with experiments.
Funding
This work was funded by the Spanish Ministry for Science and Innovation (MICINN/MINECO, co-funded by Feder program) [BFU2009-07044], by Proyecto de Excelencia CVI 2658 (Junta de Andalucía) to F.C., by Consolider ‘From Genes to Shape’ (in which F.C. is participant researcher;
MICINN/MINECO), and by MICINN/MINECO [FIS2008-04120 to A.C. and M.C.L.].
Competing interests statement
The authors declare no competing financial interests.
Supplementary material
Supplementary material available online at
http://dev.biologists.org/lookup/suppl/doi:10.1242/dev.082172/-/DC1
References
Alexandre, C., Jacinto, A. and Ingham, P. W.(1996). Transcriptional activation of hedgehog target genes in Drosophila is mediated directly by the cubitus interruptus protein, a member of the GLI family of zinc finger DNA-binding proteins. Genes Dev.10, 2003-2013.
Amin, A.(2004). Genetic cross-talk during head development in Drosophila. J. Biomed. Biotechnol.2004, 16-23.
Aza-Blanc, P., Ramírez-Weber, F. A., Laget, M. P., Schwartz, C. and Kornberg, T. B.(1997). Proteolysis that is inhibited by hedgehog targets Cubitus interruptus protein to the nucleus and converts it to a repressor. Cell89, 1043-1053.
Azpiazu, N. and Morata, G.(2000). Function and regulation of homothorax in the wing imaginal disc of Drosophila. Development127, 2685-2693.
Balaskas, N., Ribeiro, A., Panovska, J., Dessaud, E., Sasai, N., Page, K. M., Briscoe, J. and Ribes, V.(2012). Gene regulatory logic for reading the Sonic Hedgehog signaling gradient in the vertebrate neural tube. Cell148, 273-284.
Basler, K. and Struhl, G.(1994). Compartment boundaries and the control of Drosophila limb pattern by hedgehog protein. Nature368, 208-214.
Bessa, J. and Casares, F.(2005). Restricted teashirt expression confers eye-specific responsiveness to Dpp and Wg signals during eye specification in Drosophila. Development132, 5011-5020.
Biehs, B., Kechris, K., Liu, S. and Kornberg, T. B.(2010). Hedgehog targets in the Drosophila embryo and the mechanisms that generate tissue-specific outputs of Hedgehog signaling. Development137, 3887-3898.
Blanco, J., Seimiya, M., Pauli, T., Reichert, H. and Gehring, W. J.(2009). Wingless and Hedgehog signaling pathways regulate orthodenticle and eyes absent during ocelli development in Drosophila. Dev. Biol.329, 104-115.
Blanco, J., Pauli, T., Seimiya, M., Udolph, G. and Gehring, W. J.(2010). Genetic interactions of eyes absent, twin of eyeless and orthodenticle regulate sine oculis expression during ocellar development in Drosophila. Dev. Biol.344, 1088-1099.
Bonini, N. M., Leiserson, W. M. and Benzer, S.(1993). The eyes absent gene: genetic control of cell survival and differentiation in the developing Drosophila eye. Cell72, 379-395.
Bonini, N. M., Leiserson, W. M. and Benzer, S.(1998). Multiple roles of the eyes absent gene in Drosophila. Dev. Biol.196, 42-57.
Briscoe, J., Chen, Y., Jessell, T. M. and Struhl, G.(2001). A hedgehog-insensitive form of patched provides evidence for direct long-range morphogen activity of sonic hedgehog in the neural tube. Mol. Cell7, 1279-1291.
Brockmann, A., Domínguez-Cejudo, M. A., Amore, G. and Casares, F.(2011). Regulation of ocellar specification and size by twin of eyeless and homothorax. Dev. Dyn.240, 75-85.
Buszczak, M., Paterno, S., Lighthouse, D., Bachman, J., Planck, J., Owen, S., Skora, A. D., Nystul, T. G., Ohlstein, B., Allen, A. et al.(2007). The carnegie protein trap library: a versatile tool for Drosophila developmental studies. Genetics175, 1505-1531.
Casali, A. and Struhl, G.(2004). Reading the Hedgehog morphogen gradient by measuring the ratio of bound to unbound Patched protein. Nature431, 76-80.
Casares, F. and Mann, R. S.(2000). A dual role for homothorax in inhibiting wing blade development and specifying proximal wing identities in Drosophila. Development127, 1499-1508.
Chen, Y. and Struhl, G.(1996). Dual roles for patched in sequestering and transducing Hedgehog. Cell87, 553-563.
Cheyette, B. N., Green, P. J., Martin, K., Garren, H., Hartenstein, V. and Zipursky, S. L.(1994). The Drosophila sine oculis locus encodes a homeodomain-containing protein required for the development of the entire visual system. Neuron12, 977-996.
Chiang, C., Litingtung, Y., Lee, E., Young, K. E., Corden, J. L., Westphal, H. and Beachy, P. A.(1996). Cyclopia and defective axial patterning in mice lacking Sonic hedgehog gene function. Nature383, 407-413.
Davidson, E. H.(2006) The Regulatory Genome: Gene Regulatory Networks in Development and Evolution.San Diego, CA: Academic Press.
Dessaud, E., Yang, L. L., Hill, K., Cox, B., Ulloa, F., Ribeiro, A., Mynett, A.,
Novitch, B. G. and Briscoe, J.(2007). Interpretation of the sonic hedgehog