Gender Differences in Coffee Consumption and Its Effects
in Young People
Shinichi Demura1, Hiroki Aoki2, Toshihide Mizusawa3, Kei Soukura3, Masahiro Noda4, Toshiro Sato5
1
Graduate School of Natural Science & Technology, Kanazawa University, Kanazawa, Japan; 2Fukui National College of Technol-ogy, Sabae, Japan; 3University of Fukui, Fukui, Japan; 4Jin-ai University, Echizen, Japan; 5Niigata University of Health and Welfare, Niigata, Japan.
Email: [email protected]
Received November 28th, 2012; revised January 5th, 2013; accepted January 14th, 2013
Copyright © 2013 Shinichi Demura et al. This is an open access article distributed under the Creative Commons Attribution License, which permits unrestricted use, distribution, and reproduction in any medium, provided the original work is properly cited.
ABSTRACT
This study aimed to examine gender differences in coffee consumption and awareness of its effects in young people. To examine the above problem, a survey was conducted in 1189 young people (567 males aged 19.3 ± 1.5 years; 622 fe-males aged 19.1 ± 1.2 years). The coffee consumption rate was significantly higher in fe-males (50.8%) than in fefe-males (32.8%). In the coffee consumption group, no significant differences were found in the reasons for consumption, the components of coffee, and its effects on health. In the coffee nonconsumption group, significant gender differences were noted in the reasons for avoiding coffee; females (64.8%) disliked its taste more than males (39.4%). More young people of both genders in the consumption group were aware that coffee contains caffeine (79.9% - 86.5%) as com-pared with the nonconsumption group (67.0% - 74.2%). However, few people in both groups were aware about the components other than caffeine. In addition, more people in the nonconsumption group were unaware of the adverse effects of coffee on the body. The results of this study demonstrated that young males drink coffee more than young females. Among those who avoided coffee consumption, females disliked its taste more than males. Many people re-gardless of coffee consumption were aware about the components of coffee, but few knew about the other ingredients in this beverage. In addition, few people were aware of the negative effects of coffee on the health and body.
Keywords: Young; Males; Females; Coffee; Ingredients
1. Introduction
Coffee is a luxury drink that is widely consumed by peo-ple all over the world (70% - 80%) [1]. Coffee has a re-laxing effect and it alleviates stress [2]. In addition, regular coffee drinking has been reported to reduce the risk of diabetes mellitus, hepatic cirrhosis, rectal cancer, car-diovascular disease, and other illnesses [3-9]. According to Garzaro etal. in 2011 [10], majority of the 100 sub-jects found the tested coffee-flavored iced dessert pleas-ant, on the basis of the Organoleptic-Sensorial Question-naire (OSQ), in terms of taste, aspect, texture, and smell. No statistically significant differences were observed be-tween the male and female subjects. Many people in Ja-pan drink coffee regardless of age or gender [2]. How-ever, gender differences in coffee consumption have not been adequately determined, although Yamazawa et al. [11] reported gender differences in coffee-flavored des-serts and coffee consumption.
People drink coffee for different reasons, and these
reasons may differ between males and females. Mirmiran
etal. [12] reported gender as a factor influencing nutrient consumption. Du et al. [13] demonstrated that females have higher interest in the nutrients than males. Thus, knowledge about coffee may also differ between males and females.
Many studies have examined the effects of coffee con-sumption [5-9]. Information about the advantages and disadvantages of coffee consumption is easily available through the media. Compared with the nonconsumers, coffee consumers have more interest in and more knowl-edge about the various components in this beverage and its effects on the body. In addition, the sanative proper-ties of coffee as a luxury drink have been the focus of one recent study [14]. However, coffee drinkers may have overly high expectations of the beneficial effects of coffee on health.
2. Methods
1) Survey Method and Participants
A survey was administered to 1528 young people and data was gathered from subjects from a range of occupa-tional fields, such as students, office workers, teachers, etc. Therefore, specific criteria for subject selection were not prepared. The survey (Table 1) was created with
Table 1. Survey items. Coffee ingestion (Yes or No)
Reasons of coffee consumption
1. To wake up 2. Relaxed 3. Breath freshener 4. Delicious 5. Health-related Consumers
6. Stress reduction Reasons of coffee nonconsumption
1. Stopped by doctor 2. Dislike the taste 3. Harmful for the body Nonconsumption
4. Expensive Ingredient included in coffee (Free answer) Awareness on effects of coffee on health
1. Nonexpectant
2. Diabetes mellitus prevention 3. Cancer prevention 4. Diet
5. Metabolic syndrome prevention Consumers
6. Resolution of stress Awareness on effects of coffee to health
1. Unknown
2. Diabetes mellitus prevention 3. Cancer prevention 4. Diet
5. Metabolic syndrome prevention Nonconsumption
6. Resolution of stress Awareness on negative effects of coffee to body
1. Unknown 2. Stomach problems 3. Close to a restroom 4. Become to loose stools 5. Dehydration
6. Trembling hand Consumers and Nonconsumption
7. Getting palpitations Consumption of drinks besides coffee
1. Coffee drink
2. Refreshing drinks with coffee 3. Green tea
4. Tea
5. Juice 6. Milk 7. Water
8. Carbonated drink Consumers and Nonconsumption
9. Sports drink
reference to questionnaires from previous studies [2,15]. Survey items were selected on the basis of presence or absence of coffee consumption, reasons for coffee con-sumption or nonconcon-sumption, ingredients in coffee, the effects of coffee on health, and preferred alternative drinks (see Table 1). Participants responded freely regarding the ingredients in coffee. Participants responded to ques-tions included in the other survey items with a “yes” or “no.”
2) Data Analysis
The chi-squared frequency test (χ2 test) was used to clarify gender differences for each question item. The significance level in this study was set at p < 0.05, which was adjusted using the Bonferroni method.
3. Results
Validity testing determined that data for 1189 respon-dents (567 males aged 19.3 ± 1.5 years; 622 females aged 19.1 ± 1.2 years) were useful for the purposes of the analysis. Thus, the response rate was 86.9%.The coffee consumption group comprised 288 males and 204 fe-males, whereas the coffee nonconsumption group com-prised 279 males and 418 females.
Table 2 shows the results for coffee consumption
based on gender differences. The coffee consumption rate was significantly higher in males (50.8%) than in females (32.8%). Incidentally, coffee nonconsumption rate was significantly higher in females. Participants were grouped into those who drink coffee (coffee consumption group) and those who do not (coffee nonconsumption group).
Tables 3-7 show the reasons for coffee consumption
Table 2. Coffee consumption by gender. Males (n = 567) Females (n = 622)
n n χ
2 p
Coffee consumption 288 (50.8%) 204 (32.8%) 39.6* 0.00
Coffee nonconsumption 279 (49.2%) 418 (67.2%)
*
p < 0.05.
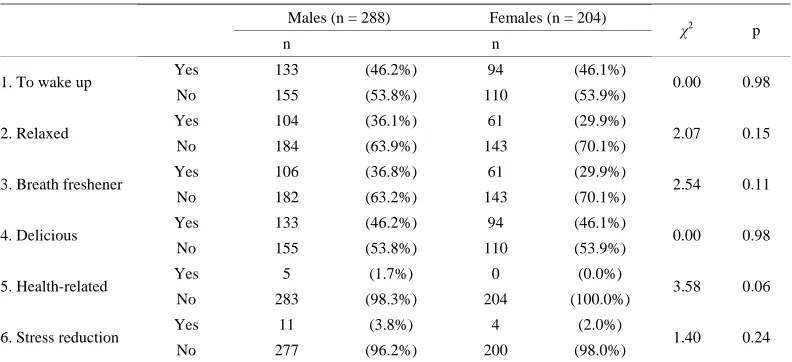
Table 3. Gender differences regarding reasons for consuming coffee. Males (n = 288) Females (n = 204)
n n χ
2 p
Yes 133 (46.2%) 94 (46.1%)
1. To wake up
No 155 (53.8%) 110 (53.9%) 0.00 0.98
Yes 104 (36.1%) 61 (29.9%)
2. Relaxed
No 184 (63.9%) 143 (70.1%) 2.07 0.15
Yes 106 (36.8%) 61 (29.9%)
3. Breath freshener
No 182 (63.2%) 143 (70.1%) 2.54 0.11
Yes 133 (46.2%) 94 (46.1%)
4. Delicious
No 155 (53.8%) 110 (53.9%) 0.00 0.98
Yes 5 (1.7%) 0 (0.0%)
5. Health-related
No 283 (98.3%) 204 (100.0%) 3.58 0.06
Yes 11 (3.8%) 4 (2.0%)
6. Stress reduction
No 277 (96.2%) 200 (98.0%) 1.40 0.24
Table 4. Gender differences regarding awareness of components in the coffee consumption group. Males (n = 288) Females (n = 204)
n n χ
2 p
Yes 249 (86.5%) 163 (79.9%)
1. Caffeine
No 39 (13.5%) 41 (20.1%) 3.77 0.05
Yes 14 (4.9%) 11 (5.4%)
2. Polyphenol
[image:3.595.101.495.508.689.2]No 274 (95.1%) 193 (94.6%) 0.07 0.79
Table 5. Gender differences regarding awareness of the positive effects of coffee on health in the coffee consumption group. Males (n = 288) Females (n = 204)
n n χ
2 p
Yes 245 (85.1%) 170 (83.3%)
1. Nonexpectant
No 43 (14.9%) 34 (16.7%) 0.27 0.60
Yes 3 (1.0%) 2 (1.0%)
2. Diabetes mellitus prevention
No 285 (99.0%) 202 (99.0%) 0.00 0.95
Yes 4 (1.4%) 5 (2.5%)
3. Cancer prevention
No 284 (98.6%) 199 (97.5%) 0.75 0.39
Yes 7 (2.4%) 4 (2.0%)
4. Diet
No 281 (97.6%) 200 (98.0%) 0.12 0.73
Yes 5 (1.7%) 1 (0.5%)
5. Metabolic syndrome prevention
No 283 (98.3%) 203 (99.5%) 1.54 0.22
Yes 31 (10.8%) 19 (9.3%)
6. Resolution of stress
No 257 (89.2%) 185 (90.7%) 0.28 0.60
no significant gender differences were found for this pa-rameter. Approximately 40% respondents of both gen-ders answered that they were unaware of any negative
Table 6. Gender differences regarding awareness of the negative effects of coffee on the body in the coffee consumption group.
Males (n = 288) Females (n = 204)
n n χ
2 p
Yes 121 (42.0%) 74 (36.3%)
1. Unknown
No 167 (58.0%) 130 (63.7%) 1.64 0.20
Yes 70 (24.3%) 57 (27.9%)
2. Stomach problems
No 218 (75.7%) 147 (72.1%) 0.82 0.36
Yes 106 (36.8%) 83 (40.7%)
3. Close to a restroom
No 182 (63.2%) 121 (59.3%) 0.76 0.38
Yes 30 (10.4%) 27 (13.2%)
4. Become to loose stools
No 258 (89.6%) 177 (86.8%) 0.93 0.34
Yes 12 (4.2%) 8 (3.9%)
5. Dehydration
No 276 (95.8%) 196 (96.1%) 0.02 0.89
Yes 8 (2.8%) 4 (2.0%)
6. Trembling hand
No 280 (97.2%) 200 (98.0%) 0.34 0.56
Yes 15 (5.2%) 2 (1.0%)
7. Getting palpitations
[image:4.595.99.495.344.609.2]No 273 (94.8%) 202 (99.0%) 6.40 0.01
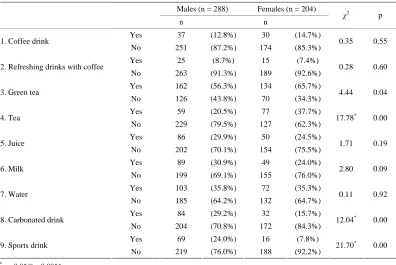
Table 7. Gender differences regarding consumption of other drinks in the coffee consumption group. Males (n = 288) Females (n = 204)
n n χ
2 p
Yes 37 (12.8%) 30 (14.7%)
1. Coffee drink
No 251 (87.2%) 174 (85.3%) 0.35 0.55
Yes 25 (8.7%) 15 (7.4%)
2. Refreshing drinks with coffee
No 263 (91.3%) 189 (92.6%) 0.28 0.60
Yes 162 (56.3%) 134 (65.7%)
3. Green tea
No 126 (43.8%) 70 (34.3%) 4.44 0.04
Yes 59 (20.5%) 77 (37.7%)
4. Tea
No 229 (79.5%) 127 (62.3%) 17.78
* 0.00
Yes 86 (29.9%) 50 (24.5%)
5. Juice
No 202 (70.1%) 154 (75.5%) 1.71 0.19
Yes 89 (30.9%) 49 (24.0%)
6. Milk
No 199 (69.1%) 155 (76.0%) 2.80 0.09
Yes 103 (35.8%) 72 (35.3%)
7. Water
No 185 (64.2%) 132 (64.7%) 0.11 0.92
Yes 84 (29.2%) 32 (15.7%)
8. Carbonated drink
No 204 (70.8%) 172 (84.3%) 12.04
* 0.00
Yes 69 (24.0%) 16 (7.8%)
9. Sports drink
No 219 (76.0%) 188 (92.2%) 21.70
*
0.00
*p < 0.05/9 = 0.0056.
found in the percentage of drinkers of tea (20.5% vs. 37.7%), carbonated drinks (29.2% vs. 15.7%), and sports drinks (24.0% vs. 7.8%). Female respondents consumed tea (20.5% vs. 37.7%) more than males, whereas males consumed more carbonated drinks and sports drinks than females.
Tables 8-12 show the reasons for coffee nonconsump-tion (Table 8), components of coffee (Table 9), and awareness of the positive (Table 10) and negative (Table
Table 8. Gender differences regarding reasons for coffee nonconsumption. Males (n = 279) Females (n = 418)
n n χ
2 p
Yes 1 (0.4%) 1 (0.2%)
1. Stopped by doctor
No 278 (99.6%) 417 (99.8%) 0.08 0.77
Yes 110 (39.4%) 271 (64.8%) 2. Dislike the taste
No 169 (60.6%) 147 (35.2%) 43.58
* 0.00
Yes 9 (3.2%) 10 (2.4%)
3. Harmful for the body
No 270 (96.8%) 408 (97.6%) 0.44 0.51
Yes 14 (5.0%) 1 (0.2%) 4. Expensive
No 265 (95.0%) 417 (99.8%) 18.15
* 0.00
*
[image:5.595.98.495.257.329.2]p < 0.05/4 = 0.0125.
Table 9. Gender differences regarding awareness of ingredients in the coffee nonconsumption group. Males (n = 279) Females (n = 418)
n n χ
2 p
Yes 207 (74.2%) 280 (67.0%)
1. Caffeine
No 72 (25.8%) 138 (33.0%) 4.13 0.04
Yes 9 (3.2%) 33 (7.9%) 2. Polyphenol
No 270 (96.8%) 385 (92.1%) 6.44
* 0.01
*p < 0.05/2 = 0.025.
Table 10. Gender differences regarding awareness of the positive effects of coffee on health in the coffee nonconsumption group.
Males (n = 279) Females (n = 418)
n n χ
2 p
Yes 224 (80.3%) 332 (79.4%)
1. Unknown
No 55 (19.7%) 86 (20.6%) 0.08 0.78
Yes 2 (0.7%) 2 (0.5%)
2. Diabetes mellitus prevention
No 277 (99.3%) 416 (99.5%) 0.17 0.68
Yes 8 (2.9%) 13 (3.1%)
3. Cancer prevention
No 271 (97.1%) 405 (96.9%) 0.03 0.85
Yes 5 (1.8%) 23 (5.5%)
4. Diet
No 274 (98.2%) 395 (94.5%) 5.97 0.02
Yes 3 (1.1%) 7 (1.7%)
5. Metabolic syndrome prevention
No 276 (98.9%) 411 (98.3%) 0.43 0.51
Yes 32 (11.5%) 27 (6.5%)
6. Resolution of stress
No 247 (88.5%) 391 (93.5%) 5.42 0.02
Table 11. Gender differences regarding awareness of the negative effects of coffee on the body in the coffee nonconsumption group.
Males (n = 279) Females (n = 418)
n n χ
2
p
Yes 173 (62.0%) 234 (56.0%)
1. Unknown
No 106 (38.0%) 184 (44.0%) 2.50 0.11
Yes 43 (15.4%) 66 (15.8%)
2. Stomach problems
No 236 (84.6%) 352 (84.2%) 0.02 0.89
Yes 58 (20.8%) 97 (23.2%)
3. Close to a restroom
No 221 (79.2%) 321 (76.8%) 0.57 0.45
Yes 19 (6.8%) 30 (7.2%)
4 .Become to loose stools
No 260 (93.2%) 388 (92.8%) 0.03 0.85
Yes 2 (0.7%) 9 (2.2%)
5. Dehydration
No 277 (99.3%) 409 (97.8%) 2.22 0.14
Yes 4 (1.4%) 7 (1.7%)
6. Trembling hand
No 275 (98.6%) 411 (98.3%) 0.06 0.80
Yes 4 (1.4%) 6 (1.4%)
7. Getting palpitations
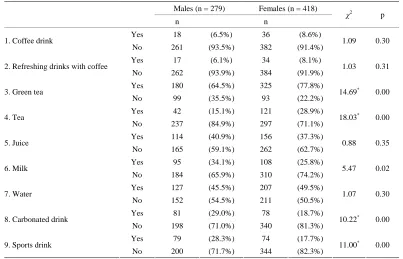
[image:5.595.98.496.377.532.2] [image:5.595.99.496.569.735.2]Table 12. Gender differences regarding consumption of drinks other than coffee in the coffee nonconsumption group. Males (n = 279) Females (n = 418)
n n χ
2 p
Yes 18 (6.5%) 36 (8.6%)
1. Coffee drink
No 261 (93.5%) 382 (91.4%) 1.09 0.30
Yes 17 (6.1%) 34 (8.1%)
2. Refreshing drinks with coffee
No 262 (93.9%) 384 (91.9%) 1.03 0.31
Yes 180 (64.5%) 325 (77.8%) 3. Green tea
No 99 (35.5%) 93 (22.2%) 14.69
*
0.00
Yes 42 (15.1%) 121 (28.9%) 4. Tea
No 237 (84.9%) 297 (71.1%) 18.03
* 0.00
Yes 114 (40.9%) 156 (37.3%) 5. Juice
No 165 (59.1%) 262 (62.7%) 0.88 0.35
Yes 95 (34.1%) 108 (25.8%) 6. Milk
No 184 (65.9%) 310 (74.2%) 5.47 0.02
Yes 127 (45.5%) 207 (49.5%) 7. Water
No 152 (54.5%) 211 (50.5%) 1.07 0.30
Yes 81 (29.0%) 78 (18.7%) 8. Carbonated drink
No 198 (71.0%) 340 (81.3%) 10.22
* 0.00
Yes 79 (28.3%) 74 (17.7%) 9. Sports drink
No 200 (71.7%) 344 (82.3%) 11.00
* 0.00
*
p < 0.05/9 = 0.0056.
ness of polyphenol as a component of coffee; however, the response rate for this survey item was extremely low (3% - 8%). Most males and females (approximately 70%) knew that coffee contains caffeine. No significant gender differences were found in awareness of the effects of coffee on health; responses from males and females were similar (1.1% - 80.3% vs. 1.7% - 79.4%) for all items. More than their 80% answered that they were unaware of the positive effects of coffee on health. Answer rates for males and females were similar (0.7% - 62.0% vs. 1.4% - 56.0%) for all items regarding the negative effects of coffee on health, so no significant gender differences were found for these items. Approximately 50% males and females answered that they were unaware of the negative effects of coffee on health. For questions re-garding alternative beverages, significant gender differ-ences were found in the percentage of drinkers of green tea (64.5% vs. 77.8%) and tea (15.1% vs. 28.9%), car-bonated drinks (29.0% vs. 18.7%), and sports drinks (28.3% vs. 17.7%). Females consumed more tea than males (20.5% vs. 37.7%), and males consumed more carbonated drinks and sports drinks in the coffee non-consumption group.
Tables 13-15 show gender differences regarding
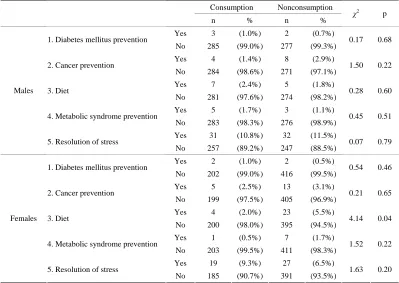
awareness of ingredients (Table 13) and awareness of the positive (Table 14) and negative (Table 15) effects of coffee on health and the body between the coffee con-sumption and nonconcon-sumption groups. A significant group difference was found only for caffeine. More respondents
in the consumption group were aware of the effects of caffeine, but more than 65% respondents in the noncon-sumption group also were aware of this fact. No signifi-cant differences were found in the awareness of the ef-fects of coffee on health between both groups (1.1% - 10.8% for the consumption group vs. 0.5% - 9.3% for the nonconsumption group). No significant group differences were found in responses indicating lack of awareness of negative effects of coffee on health and need to be close to a restroom. More respondents in the nonconsumption group (>50%) were unaware of the negative effects of coffee on health, and more respondents in the consump-tion group (approximately 40%) indicated the need to be close to a restroom after drinking coffee. In addition, more respondents in the consumption group reported stomach problems due to coffee consumption (27.9% vs. 15.8%).
4. Discussion
Table 13. Gender differences between the consumption and nonconsumption groups in terms of awareness of ingredients in coffee.
Consumption Nonconsumption
n % n % χ
2 p
Yes 249 (86.5%) 207 (74.2%) 1. Caffeine
No 39 (13.5%) 72 (25.8%) 13.5
* 0.00
Yes 14 (4.9%) 9 (3.2%) Males
2. Polyphenol
No 274 (95.1%) 270 (96.8%) 0.97 0.32
Yes 163 (79.9%) 280 (67.0%) 1. Caffeine
No 41 (20.1%) 138 (33.0%) 11.2
* 0.00
Yes 11 (5.4%) 33 (7.9%)
Females
2. Polyphenol
No 193 (94.6%) 385 (92.1%) 1.31 0.25
*p < 0.05/2 = 0.025.
Table 14. Gender differences between groups in terms of awareness of the positive effects of coffee on health. Consumption Nonconsumption
n % n % χ
2 p
Yes 3 (1.0%) 2 (0.7%)
1. Diabetes mellitus prevention
No 285 (99.0%) 277 (99.3%) 0.17 0.68
Yes 4 (1.4%) 8 (2.9%)
2. Cancer prevention
No 284 (98.6%) 271 (97.1%) 1.50 0.22
Yes 7 (2.4%) 5 (1.8%)
3. Diet
No 281 (97.6%) 274 (98.2%) 0.28 0.60
Yes 5 (1.7%) 3 (1.1%)
4. Metabolic syndrome prevention
No 283 (98.3%) 276 (98.9%) 0.45 0.51
Yes 31 (10.8%) 32 (11.5%)
Males
5. Resolution of stress
No 257 (89.2%) 247 (88.5%) 0.07 0.79
Yes 2 (1.0%) 2 (0.5%)
1. Diabetes mellitus prevention
No 202 (99.0%) 416 (99.5%) 0.54 0.46
Yes 5 (2.5%) 13 (3.1%)
2. Cancer prevention
No 199 (97.5%) 405 (96.9%) 0.21 0.65
Yes 4 (2.0%) 23 (5.5%)
3. Diet
No 200 (98.0%) 395 (94.5%) 4.14 0.04
Yes 1 (0.5%) 7 (1.7%)
4. Metabolic syndrome prevention
No 203 (99.5%) 411 (98.3%) 1.52 0.22
Yes 19 (9.3%) 27 (6.5%)
Females
5. Resolution of stress
No 185 (90.7%) 391 (93.5%) 1.63 0.20
tion groups. In short, young females may choose to drink tea rather than coffee more often than young males. In contrast, Yamamoto etal. [17] reported that 68% female students responded that they like coffee. In this study, only approximately 50% female respondents considered coffee to be delicious, even in the coffee consumption group. These results may indicate that young females may not drink coffee regularly, although they may like it. Further studies are required to examine the relationship between coffee consumption and preference for the taste of coffee.
In the coffee consumption group, approximately 50% respondents reported that the reason they liked to drink
coffee was because it helped them wake up or because they liked its taste. Caffeine in coffee has a stimulating effect on the central nervous system [18]. Many people who drink coffee expect to feel awake. To consume the same food and drinks regularly, it is very important that a person considers them delicious. Many respondents of both genders in this study drank coffee for its taste. In addition, almost all respondents (approximately 80%) knew that coffee contains caffeine, but few knew about for the other ingredients in coffee (4.9% - 5.4%).
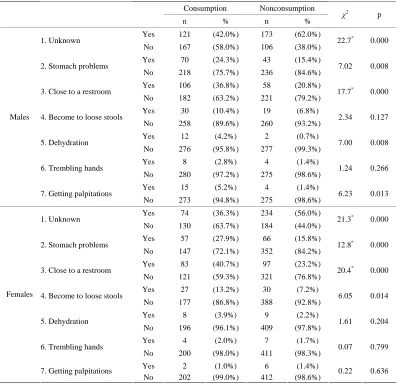
Table 15. Gender differences between groups in terms of awareness of the negative effects of coffee on the body. Consumption Nonconsumption
n % n % χ
2 p
Yes 121 (42.0%) 173 (62.0%)
1. Unknown
No 167 (58.0%) 106 (38.0%) 22.7
* 0.000
Yes 70 (24.3%) 43 (15.4%)
2. Stomach problems
No 218 (75.7%) 236 (84.6%) 7.02 0.008
Yes 106 (36.8%) 58 (20.8%)
3. Close to a restroom
No 182 (63.2%) 221 (79.2%) 17.7
*
0.000
Yes 30 (10.4%) 19 (6.8%)
4. Become to loose stools
No 258 (89.6%) 260 (93.2%) 2.34 0.127
Yes 12 (4.2%) 2 (0.7%) 5. Dehydration
No 276 (95.8%) 277 (99.3%) 7.00 0.008
Yes 8 (2.8%) 4 (1.4%) 6. Trembling hands
No 280 (97.2%) 275 (98.6%) 1.24 0.266
Yes 15 (5.2%) 4 (1.4%) Males
7. Getting palpitations
No 273 (94.8%) 275 (98.6%) 6.23 0.013
Yes 74 (36.3%) 234 (56.0%)
1. Unknown
No 130 (63.7%) 184 (44.0%) 21.3
* 0.000
Yes 57 (27.9%) 66 (15.8%)
2. Stomach problems
No 147 (72.1%) 352 (84.2%) 12.8
* 0.000
Yes 83 (40.7%) 97 (23.2%)
3. Close to a restroom
No 121 (59.3%) 321 (76.8%) 20.4
*
0.000
Yes 27 (13.2%) 30 (7.2%)
4. Become to loose stools
No 177 (86.8%) 388 (92.8%) 6.05 0.014
Yes 8 (3.9%) 9 (2.2%)
5. Dehydration
No 196 (96.1%) 409 (97.8%) 1.61 0.204
Yes 4 (2.0%) 7 (1.7%)
6. Trembling hands
No 200 (98.0%) 411 (98.3%) 0.07 0.799
Yes 2 (1.0%) 6 (1.4%)
Females
7. Getting palpitations
No 202 (99.0%) 412 (98.6%) 0.22 0.636
*p < 0.05/7 = 0.007.
in taste preference in a group of junior high school stu-dents, and reported that taste differs between males and females. Most youth have tasted coffee at least once in their lives. Hence, more females may dislike the taste of coffee based on their past experience, and thus do not choose to drink. In addition, almost all respondents of both genders (70%) in the nonconsumption group knew that coffee contains caffeine, but few knew about the other ingredients in coffee. According to Du etal. [13], knowledge and attitude regarding nutrients differ be-tween males and females. However, young people who do not drink coffee may not be interested in it, regardless of gender.
No gender differences were found in responses to the items regarding the effects of coffee on health. More than 80% respondents expected no adverse effects, particu-larly in the coffee consumption group. In Japan, it is widely known that tea drinking has healthy effects. Ac-cording to Matsui [20], about 50% of nonsugar tea
drink-ers found its health benefits very appealing and hence have chosen this beverage. In Japan, coffee is a luxury drink, unlike refreshing drinks such as tea. Approximately 50% respondents in the coffee consumption group drank coffee because they liked its taste. Thus, people who drink coffee regularly may do so because they enjoy its taste and expect to experience its positive effects, such as helping them to feel awake.
in the consumption group and more than 65% of those in the nonconsumption group knew that coffee contains caffeine, it is considered that the caffeine is a widely known component among young people. However, no significant gender differences between the consumption and nonconsumption groups were found regarding the effects of coffee on health. In Japan, alternative healthy drinks such as water or lactic acid bacteria beverages have been manufactured. In addition, many people rec-ognize the healthy effect of tea [20].
On the other hand, the risk of myocardial infarction and glaucoma are increased by coffee consumption [22, 23]. However, regarding the adverse effects of coffee on the body, both male and female respondents in the non-consumption group (>50%) were unaware of these ef-fects, and approximately 40% of those in the consump-tion group were unaware of these effects. In addiconsump-tion, approximately 40% of those in the consumption group felt the need to be close to a restroom after drinking cof-fee. Many studies have reported results of tests of coffee from the medical and pharmaceutical viewpoints [3-7]. The media also frequently reports the effects of coffee. However, the adverse effects of coffee consumption may not be adequately reported. Therefore, young people may know little about these effects regardless of their prefer-ence for coffee. It is necessary to spread awareness re-garding the positive and negative effects of coffee on health, regardless of coffee consumption. Similar to the coffee-drinking habit of westerners, many Japanese, in-cluding the youth, tend to drink coffee during business or social meetings. Moreover, coffee can be freely ordered at a coffee-specialty store, tea shop, or fast food center and can be easily bought at a supermarket or from vend-ing machines. Such circumstances are responsible for giving rise to many coffee drinkers.
5. Conclusion
In conclusion, in this study, young males reported drink-ing more coffee than young females. Among coffee non-consumers, females disliked the taste of coffee more of-ten than males. Many young people know that coffee contains caffeine, but few know about other components of this beverage. In addition, few people know the posi-tive and negaposi-tive effects of coffee on health.
REFERENCES
[1] B. Schilter, C. Cavin, A. Tritscher and A. Constable, “Health Effects and Safety Consideration,” In R. J. Clarke and O. G. Vitzthum, Eds., Coffee Recent Developments, Blackwell Science Company, Ames, 2001, p. 166.
[2] T. Yamato, M. Kino, T. Obata, H. Ohta and M. Aomine, “Modulatory Effect of Coffee on Restrained Stress-In- duced Release of Neurotransmitters in Rat,” Journal of
Japanese Society of Nutrition and Food Science, Vol. 55, No. 2, 2002, pp. 85-91. doi:10.4327/jsnfs.55.85
[3] E. Giovannucci, “Meta-Analysis of Coffee Consumption and Risk of Colorectal Cancer,” American Journal of Epidemiology, Vol. 147, No. 11, 1998, pp. 1043-1052. doi:10.1093/oxfordjournals.aje.a009398
[4] A. Tverdal and S. Skurtveit, “Coffee Intake and Mortality from Liver Cirrhosis,” Annals of Epidemiology, Vol. 13, No. 6, 2003, pp. 419-423.
doi:10.1016/S1047-2797(02)00462-3
[5] T. Yamaji, T. Mizoue, S. Tabata, S. Ogawa, K. Yamagu- chi, E. Shimizu, M. Mineshita and S. Kono, “Coffee Consumption and Glucose Tolerance Status in Middle- Aged Japanese Men,” Diabetologia, Vol. 47, No. 12, 2004, pp. 2145-2151. doi:10.1007/s00125-004-1590-5
[6] C. E. Ruhl and J. E. Everhart, “Coffee and Tea Consump- tion Are Associated with a Lower Incidence of Chronic Liver Disease in the United States,” Gastroenterology, Vol. 129, No. 6, 2005, pp. 1928-1936.
doi:10.1053/j.gastro.2005.08.056
[7] M. Inoue, I. Yoshimi, T. Sobue, S. Tsugane and J.P.H.C. Study Group, “Influence of Coffee Drinking on Subse- quent Risk of Hepatocellular of Coffee Drinking on Sub- sequent Risk of Hepatocellular Carcinoma: A Prospective Study in Japan,” Journal of the National Cancer Institute, Vol. 97, No. 4, 2005, pp. 293-300.
doi:10.1093/jnci/dji040
[8] L. F. Andersen, D. R. Jacobs Jr., M. H. Carlsen and R. Blomhoff, “Consumption of Coffee Is Associated with Reduced Risk of Death Attributed to Inflammatory and Cardiovascular Diseases in the Iowa Women’s Health Study,” American Journal of Clinical Nutrition, Vol. 83, No. 5, 2006, pp. 1039-1046.
[9] H. Iso, C. Date, K. Wakai, M. Fukui, A. Tamakoshi and J.A.C.C. Study Group, “The Relationship between Green Tea and Total Caffeine Intake and Risk for Self-Reported Type 2 Diabetes among Japanese Adults,” Annals of In- ternal Medicine, Vol. 144, No. 8, 2006, pp. 554-562. doi:10.7326/0003-4819-144-8-200604180-00005
[10] M.Garzaro, L. Raimondo, G. Pecorari, M. Sensini, G. Riva, A. Palmo and C. Giordano, “Digestibility, Palat- ability and Emotional Status after Ingestion of an Iced Dessert: Analysis of Subjective Responses in 100 Healthy Volunteers,” Journal of Biological Regulators & Homeo- static Agents, Vol. 25, No. 1, 2011, pp. 101-107.
[11] K. Yamazawa, K. Hirokawa and H. Shimizu, “Sex Dif- ferences in Preferences for Coffee Sweetness among Japa- nese Students,” Perceptual and Motor Skills, Vol. 105, No. 2, 2007, pp. 403-404.
[12] P. Mirmiran, F. Mohammadi-Nasrabadi, N. Omidvar, F. Hosseini-Esfahani, H. Hamayeli-Mehrabani, Y. Mehrabi and F. Azizi, “Nutritional Knowledge, Attitude and Prac- tice of Tehranian Adults and Their Relation to Serum Li- pid and Lipoproteins: Tehran Lipid and Glucose Study,” Annals of Nutrition & Metabolism, Vol. 56, No. 3, 2010, pp. 233-240. doi:10.1159/000288313
pp. 735-738.
[14] M. Izumi and M. Takaya,” Influence of Various of Ex- traction Conditions and Amount of Chlorogenic Acid on the Taste of Coffee,” Journal of Cookery Science of Ja- pan, Vol. 41, No. 4, 2008, pp. 257-261.
[15] A.Drewnowski, S.A. Henderson, A. Levine and C. Hann, “Taste and Food Preferences as Predictors of Dietary Practices in Young Women,” Public Health Nutrition, Vol. 2, No. 4, 1999, pp. 513-519.
[16] E. M. Rodenburg, M. Eijgelsheim, J. M. Geleijnse, N. Amin, C. M. van Duijn, A. Hofman, A. G. Uitterlinden, B. H. Stricker and L. E. Visser, “CYP1A2 and Coffee Intake and the Modifying Effect of Sex, Age, and Smoking,” American Journal of Clinical Nutrition, Vol. 96, No. 1, 2012, pp. 182-187. doi:10.3945/ajcn.111.027102
[17] T. Yamato, M. Aomine, T. Koga and H. Ohta, “Relation- ship between Coffee Drinking and Reduction of Mental Stress in Young Women,” Food Science and Technology Research, Vol. 11, No. 4, 2005, pp. 395-399.
doi:10.3136/fstr.11.395
[18] B. B. Fredholm, “On the Mechanism of Action of Theo- phylline and Caffeine,” Acta Medica Scandinavica, Vol. 217, No. 2, 1985, pp. 149-153.
[19] S. Maruyama, T. Koda and T. Takahashi, “Gender Dif-
ferences among Junior High School Students Regarding Taste Preference of Dried Bonito Soup Stocks,” Japanese Journal of Adolescentology, Vol. 28, No. 1, 2010, pp. 170-176.
[20] Y. Matsui, “The Attractive Power of Oolong Tea,” Jour- nal for the Integrated Study of Dietary Habits, Vol. 11, No. 1, 2000, pp. 2-15. doi:10.2740/jisdh.11.2
[21] H. S. Seo, M. Hirano, J. Shibato, R. Rakwal, I. K. Hwang and Y. Masuo, “Effects of Coffee Bean Aroma on the Rat Brain Stressed by Sleep Deprivation: A Selected Tran- script- and 2D Gel-Based Proteome Analysis,” Journal of Agricultural and Food Chemistry, Vol. 56, No. 12, 2008, pp. 4665-4673. doi:10.1021/jf8001137
[22] M. C. Cornelis, A. El-Sohemy, E. K. Kabagambe and H. Campos, “Coffee, CYP1A2 Genotype, and Risk of Myo- cardial Infarction,” The Journal of the American Medical Association, Vol. 295, No. 10, 2006, pp. 1135-1141. doi:10.1001/jama.295.10.1135