http://www.scirp.org/journal/me ISSN Online: 2152-7261
ISSN Print: 2152-7245
The Capability Approach and Evaluation of the
Well-Being in Senegal: An Operationalization
with the Structural Equations Models
Felwine Sarr, Muhammad Ba
Gaston Berger University, Saint-Louis, Senegal
Abstract
This article uses the theoretical framework of the capabilities approach to of-fer a structural assessment model of well-being in the context of Senegal. To this end, we mobilize the Senegalese data (ESPS-II) and an evaluation space including basic and central capabilities of [1] and [2], which are: living condi-tions, education and health body, non-institutional support and good gover-nance, on the one hand, and the three dimensions of well-being (economic well-being, life satisfaction and subjective well-being), on the other hand. With the modeling technique by structural equations: PLS-PM (Partial Linear Square-Path Modeling), we find that the estimation model of well-being has built good predictive quality. In addition, it shows that the basic capabilities (education, living conditions and health of the body) positively determine well-being (economic well-being, subjective well-being and life satisfaction). Also, economic well-being and life satisfaction positively predict and cause subjective well-being. Contrariwise, non-institutional support and good go-vernance do not significantly cause subjective well-being. Between these two capabilities, only good governance has a significant and positive effect on life satisfaction.
Keywords
Capabilities Approach, Well-Being, Structural Equations Models (SEM), Partial Linear Square-Path Modeling (PLS-PM)
1. Introduction
The aim of this article is to provide, in an exploratory framework, a structural model assessment of welfare based on the capability approach (labeled “CA” in this article) by applying it to data from a developing country: Senegal, and using How to cite this paper: Sarr, F. and Ba, M.
(2017) The Capability Approach and Evalu- ation of the Well-Being in Senegal: An Operationalization with the Structural Equ- ations Models. Modern Economy, 8, 90- 110.
http://dx.doi.org/10.4236/me.2017.81007
Received: November 19, 2016 Accepted: January 17, 2017 Published: January 20, 2017
Copyright © 2017 by authors and Scientific Research Publishing Inc. This work is licensed under the Creative Commons Attribution International License (CC BY 4.0).
a modeling technique that is the PLS-PM approach (Linear Partial Square-Path Modeling) family of structural equation modeling (SEM).
CA developed by [3] [4] [5], is not a theory that explains the poverty, inequa-lity or welfare, but a flexible, multi-purpose approach that allows conceptualiz-ing and measurconceptualiz-ing these phenomena [4] [6] [7] [8]. In this sense, the CA is a normative framework which proposes that the social organization and the vidual states are assessed in accordance with the increased capabilities of indi-viduals to do what they value [9]. The two main concepts of the conceptual basis of the CA are: capabilities (freedoms to accomplish) and functioning (achieve-ments). The capabilities are defined as real freedoms (or ability) to perform statements and actions. The functioning is the many aspects of life that a person values and manifested by achievements in terms of doing and being. Their na-ture can be very basic to be healthy; have enough food; be preserved from pre-mature death, etc. Or very complex to be happy; take part in the life of one’s community; stay fit, etc. [10]. Thus, according to [5], the capabilities include, among others, all information on the combinations of functioning that a person can choose, i.e. its real freedom to enjoy values activities and states. The evalua-tion space offered by the capabilities approach is the real freedoms. In other words, the evaluation exercise does not focus on livelihoods, such as income, but on the real possibilities of living which individuals have [5]. However, due to its informational requirement and its methodological complexity, empirical appli-cations of the capabilities approach have been questioned by some authors [11] [12] [13] [14] [15]. These will be dispelled by series of practical applications of this approach in different geographical contexts, on the assessment of poverty or welfare. Sen’s approach is an open structure which is deliberately undefined and allows a user that takes into account the context of evaluation. Moreover, this is what makes its theoretical relevance along with its practical difficulty. This con-stitutes the major interest and the aspect which this work particularly deals with. Most studies concerning developing countries assess the well-being of individu-als and their level of poverty; considering mainly the income or the different as-sets that they have as the basis of their assessment.
carry in the low to accentuate the accomplishments or achievements, disregard-ing the achievement freedoms or capability. In addition, a gap in their models is related to the demonstration of a causal structure of poverty or well-being of all relevant dimensions. It is in this sense that modeling by structural equation has a great advantage over other statistical and econometric tools used in the imple-mentation of the CA and the measure of well-being. MES allows, indeed, to me- asure capability as a latent variable; and to give the nature of the causal relation-ships between these variables. In addition, with the PLS-PM MES approach we have a fundamental contribution that the other models do not: the ability to ha- ve a prediction of a dimension from the different causal variables of the model.
The rest of the article is organized as follows. In the second section, we present a review of the empirical literature of the CA, by focusing on the work that has focused on the context of developing countries and use of MES. The third section presents the methodology for the application of CA. In the fourth section, we specify and estimate our empirical model and report our results. Fi-nally, in the last section we discuss our results and conclude.
2. Review CA Empirical Literature
Sen [27], two years after Commodities and Capabilities, makes an application, one of the first of CA, comparing the ranking of countries according to some operations from that based on the income approach. It will follow another ap-plication based on the macroeconomic data that will calculate the HDI, whose CA is the theoretical framework [28]. In fact, the mid-90s mark the emergence of CA empirical literature, in large expansion today [29]-[34]. Most of these ap-plications are for geographic context of Western countries (Italy, Belgium, Eng-land...), Asia and Latin America. The few CA applications, to our knowledge, whose context is African countries are made in South Africa [35] [36] [37]; Ni-geria [38] and Senegal [26].
However, this first part of the empirical literature is based on a measurement of functioning space, with the use of techniques such as the fuzzy set theory. It was only in the 2000s that has developed empirical literature measurement ca-pabilities, especially with the use of SEM. In this statistic tool, capabilities are represented by the latent variables and are reflected in the operations that are manifest or observed variables. Kuklys [39] and Krishnakumar [33] are among other—the pioneers of this literature—in the context of developing countries. In the context of developing countries some evaluation efforts in the space of capa-bilities exist, but with a relatively low number of applications on the African continent.
93 inclusion approaches. He uses MIMIC (Multiple Indicators, multiple causes) approach of SEM, in particular the LISREL (SEM-CB)1 to estimate the
capabili-ties and relationships with other dimensions of poverty. In this estimate, the au-thor finds that there is a strong relationship between poverty capabilities and economic well-being.
Di Tommaso [41] uses the CA to suggest a model for estimating the welfare of Indian children. From the following capabilities: body health, sense of imagina-tion and thinking and leisure activity and play, she estimates the welfare of children, considered as a latent variable, through the MIMIC model. Also, in this context, according to one of the main conclusions of the study; there would be a strong relationship between the capabilities of children and their levels of well- being.
With the same target population [42] applying an SEM-CB of the Bolivian data from 2002 to estimate two capabilities of children aged 7 - 14 years: know-ledge (ability to be educated) and living conditions (ability to be housed proper-ly). These capabilities and their indicators are chosen according to the availabil-ity of data in the base of MECOVI Bolivian program. The result of their estima-tion with SEM shows a strong interdependence between capabilities and a major impact on factors such as ethnicity, family, and infrastructure in the well-being.
In the Pakistani context, [43] describes a model that simultaneously considers the capabilities, the functioning and conversion factors. This model is estimated with the Pakistani investigation data PSES (Pakistant Socio-economic Survey), conducted in 1998. In this dataset, the author uses the answers to the questions: “Is your life interesting? And have you been able to enjoy the day to day of your activities?” With the PLS-PM Technical, he finds that capabilities are positively related to functioning and freedoms. Hassan [44] uses the same dataset and shows with two estimation techniques: SEM and MCO that capabilities are most important and stable determinants of subjective well-being.
Anand, et al. [34] examined the relationship that exists between capabilities and happiness and, given the heterogeneity between individuals. With a sample of 976 adults, they seek with the SEM to model the direct effects of capabilities on the satisfaction of general life, taking into account heterogeneities related to personal traits of individuals who act on reported life satisfaction and achieve-ment of capabilities. The SEM estimations show that happiness depends on the capabilities, autonomy and social life.
In an Ethiopian context, [45] operationalize Sen’s approach in assessing the relationship between capabilities and functioning “be happy” or subjective well- being of women rural Ethiopians. The capabilities are selected according to the data available in the dataset EHRS (Ethiopian Household Rural Survey). With the use of the SEM, especially MIMIC, it gives the result: the existence of a strong correlation between the capabilities (perception of agency and salary) and achievement of subjective well-being: “be happy”.
which means that it is relatively limited. It is in this sense also that this article seeks to explore the context of Senegal, where there is not, to our knowledge, a study that attempted to measure the capabilities as framework for well-being measurement. Also, this paper is the first to use SEM approach in measurement well-being in Senegal and, particularly, PLS-PM (Partial Least Square-Path Modeling) in CA, excepted Hassan [43].
3. Methodology
3.1. Choice of Dimensions
In the evaluation process, the choice of dimensions and indicators is seminal. According to [46], the choice of the first is based on theoretical foundations or philosophical view and the later on practical or statistical considerations. Re-garding the choice of dimensions, there is no list of predefined capabilities in Sen, unlike Nussbaum [47] offering. Sen [48] argues that any list should be spe-cific to the study contexts and determine by a public reasoning. According to [49], there are five methods generally used by applications of CA and multidi-mensional poverty, to select the relevant dimensions and that is: the fact of being based on existing data; to make normative assumptions based on the valuesof the society that uphold social or religious theories; using a set of dimensions that result from a consensus or public discussion, as the Millennium Development Goals, the human rights...; to initiate a deliberative participation and to base on empirical evidence.
In this paper, we rely on the theory including that of Sen and Nussbaum choose values dimensions. In fact, in an assessment context as that of the coun-try in development, we choose the basic capabilities [50], which are: the freedom to enjoy good living conditions, freedom to read and write freedom to lead a life free from disease, freedom to eat properly and freedom to participate in public and social life of the community. These dimensions refer to all of the items priori-tized by Senegalese for human development in the “My World” survey [51]. Next, we take a broader definition of health that includes nutrition, which is the bodily health. Moreover capabilities “participations in public and social life” is divided into two distinct dimensions are: good governance and social ties (not institutional support). The first is the fifth priority according to the results of My World. As for the second, we consider its relevance following the socio-cultural context of the country and we propose to test its relevance in measuring well-being.
Consequently, we have the following dimensions: living conditions, educa-tion, body health, social ties (not institutional support), good governance, eco-nomic well-being, life satisfaction and subjective well-being. At each of its di-mensions will match one or more indicators that are considered in the CA as accomplishments or functionings. As we mentioned above, the choice of these indicators will depend on the availability of data in the dataset as an information source mobilized.
3.2. Structural Equation Model to PLS-PM
The challenges of operationalizing the CA require specific statistical techniques to take into account the multidimensional nature of the approach and the inte-ractions between its variables. Moreover, in addition to the fuzzy set theory (FST), the multivariate data reduction techniques and regression approaches, SEM is a relevant new tool for empirical modeling of CA [52]. It’s statistical tool for modeling causal relationships between multiple variables defined from a theoretical model. Thus, the SEM has for innovative idea-which makes them the second of generational patterns being able to estimate the complexity, by taking into account the system of a causal relationship between a latent concept and several observed variables, say manifest variables [53]. There are two types of models in the SEM: the measurement model (or external model) and the struc-tural model (or internal model). In addition, there are two types for SEM mod-eling: the hard modeling and the soft one. The first is the so-called LISREL (Li-near Structural Relation). It is based on the analysis of covariance matrix. LISREL is a method that is quite complex, based on the CPA and confirmatory factor analysis, it is unusual to require rather restrictive assumption as the nor-mal distribution of data, identification of models, etc. This is why it is referred to as a rough method. Note also that this is a confirmatory method, therefore, re-quires an existing theory that we must confirm or compared to data available to the researcher. Conversely, the PLS-PM method is called soft because it requires few assumptions and its implementation is relatively convenient. This approach based on estimates partial least squares and was developed by [54] [55]. In con-trast, the LISREL approach, the PLS is predictive approach and ranks among the most exploratory methods. Indeed, it does not require an existing theory and could be a first step before modeling approach of covariance calling LISREL (Li-near Structural Relation).
4. Application: Evaluation of a Structural Model of Welfare
in Senegal
4.1. Model Specification
Specifying the model consists of the MES to set the measurement and structural models. The first describes the relationship between manifest variables and la-tent variables; and the second consists of all relationships between the lala-tent va-riables between them. We build an outer model that is reflective type, i.e. the manifest variables are the reflections of their latent variables.
0
h h h h
x =π +π ξ ε+ (1)
where xh is vector of manifest variables (functioning) of latent variable
(capa-bilities and well-being); πh is the loading associated to manifest variables xh
and εh the error term represents the imprecision in the measurement process.
[image:7.595.66.536.533.716.2]The indicators are chosen from the ESPS-II (Enquête de suivi de la pauvreté au Sénégal) dataset. Table 1A in the Appendix gives the indicators for each di-mension associated with it and its terms. For inner or structural model, the rela-tionship between latent variables is assumptions that the estimate should con-firm or deny. Trivially, we assume that capabilities affect the dimensions of well- being (economic, life satisfaction and subjective well-being). Relations between the dimensions are derived from the empirical literature of the CA and the ap-plication context.
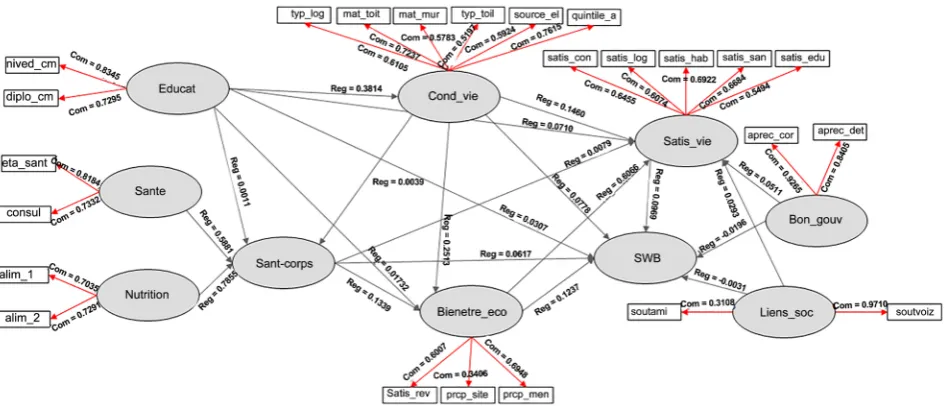
Figure 1 below shows the model shows that each of his supposed relationship.
0
j j ji i j
i
ξ =β +
∑
β ξ ν+ (2)where ξj as endogen latent variable and ξi, the i-th exogenous latent varia-
bles or independent of inner model; βj0 is the intercept and βji is the generic
path coefficient interrelating the i-th exogenous latent variable to the j-th one,
j
ν is the error in the inner relation (i.e. disturbance term in the prediction of the j-th endogenous laten variable from its explanatory latent variables).
The model to estimate is presented in the following figure.
4.2. Source of Information
In 2011, the State of Senegal through its National Agency of Statistics and De-mography (ANSD) launched a follow-up survey of poverty: follow-up survey of poverty in Senegal (ESPS-II), second of its kind after the ESPS-I. This one gave aim to collect information on the main indicators of poverty, develop a profile of poverty, highlight the socioeconomic characteristics of different social groups and ultimately to analyze the determinants of poverty [56]. 20250 on sample households, 17891 were eventually interviewed. However, ANSD in its final re-port notes that the household sample was divided into two groups, one called sub-sample that received the total administration of the household question-naire; while the other portion of households forming the expanded sub-sample had a lighter application of this questionnaire [56]. In doing so, the 17891 households surveyed are distributed as follows: 5953 households received the questionnaire in its entirety and 11938 households was applied partial question-naire. Our work covers the reduced sample subsample of ESPS-II. Some va-riables such as subjective well-being or, more broadly, those that are part of Sec-tion L are available for individuals of partial subsample. By giving us [56], we be-lieve this fairly representative sample size that we will base our empirical work. By construction, we exclude from this sample household heads who are not Se-negalese nationalities and for which we have a high rate of non-response in rela-tion to certain issues. So we spend a sample of 5953 to 5873 individuals.
4.3. Estimation and Results
The XLSTAT software that has a module XLSTAT-PLSPM mobilized to estimate model presented in Figure 1. For the regression, we use the partial least square method (PLS) instead of OLS end to guard against the risk of co-linearity as recommended by Tenenhaus et al. [57]. In addition, for purposes of prediction and not evaluation, regression by partial least squares is indicated.
Figure 2 shows the results of the model with the structural factors and manif-est variables communities. In the SEM in general, PLS-PM in particular, the re-sults of the model analysis on three levels: outer model, inner model and global model.
4.3.1. Outer Model
Our model is hierarchical component model (HCM) type, i.e. we have a latent variable, which has the obvious indicators of others latent variables. These are the: bodily health. Thus, to evaluate the results of the measurement model, ac-cording to [58], we will test the reliability and internal consistency and validity to the dimensions of the first order. As for the hierarchy variable, the reliability is not relevant for these types of variables [59]; only the criterion of validity will be tested. Table 1 summarizes the different criteria for accepting the validity of the measurement model.
Figure 2. Basic model estimated. Source: Authors, from XLSTAT-PLSPM.
Table 1. Criteria for accepting the validity of the measurement model.
Validity Type Criterion Description Literature
Unidimensionality Factor Analysis Exploratory (EFA)
The number of selected factors is determined by the numbers of factors with an eigenvalue greater than 1.0.
Gerbing and Anderson
[60]
Internal Consistency
Reliability Cronbach Alpha
Should be greater than 0.70 to achieve the reliable of measure-ment model.
Nunnally [61]
Internal Consistency
Reliability
Composite Reliability
Alternative to Cronbach Alpha that attempt to measure the sum of an LV’s factor loadings relative to
the sum of the factor loadings plus error variances.
Nunnally and Bernstein
[62]
Indicator
Reliability Indicator Loadings
Measures how much of the indicators variance is explained by
the coresponding latent variables. Chin [63]
Convergent
Validity Average Variance Extracted (AVE) Proposed threshold value for AVE should be higher than 0.50. LarckerFornell and [64]
Discriminant
Validity Fornell-Larcker criterion
The AVE of each latent variable should be greater than the latent variable highest squared correla-tion with any other latent variable.
Fornell and Larcker [64]
Source: Extract from Afthonaran’s paper [65].
in our model with the latent variable “SWB”. For reliability indicators which re-fers to their ability to be explained by their latent variables, loadings indicators are higher than 0.7.
This implies communalities that are above 0.5 (Table 2A attached). Only the manifest variables “soutami” and “prcp_sitmen” have communalities that are less than 0.5:0.31 and 0.34 respectively. But they belong to other dimensions where components have communalities that are high. So in general, we can ac-cept the reliability of our indicators.
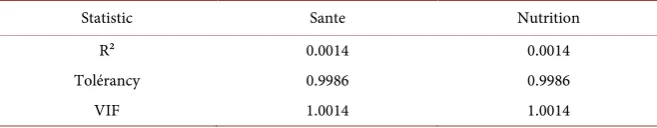
After testing the reliability of indicators and their latent constructs, the next step in the validation of the outer model includes a review of the validity of built. Within the HCM, [58] states that the validity of the measurement model is tested on two levels: the first order and second order. For models of first order must test the existence of a convergent validity and discriminant validity. Vali-dation of the second order must obey following [58] and [66], when it is Type-II, the same requirements as those required with a formative model. According to [59] and [67], built the second order must consist of sub dimensions that meet the criteria of validity of formative indicators given by calculating the collineari-ty test what the VIF (Variance Inflation Factor) which is the reverse tolerance and which measures the amount of variance explained by other influences. Ac-cording to the literature, the value of VIF must be greater than 0.2, but less than 5 [68] [69].
Table 2A in Annex shows that the AVE of all latent variables first order satis-fies the convergent validity and criterion Fornell and Larcker. The variable “Bi-en-etre_eco” is one that has the smallest AVE of the first order, i.e.: 0.5453. For the variable “Sant-corps” the AVE calculated is beyond consideration of this cri-terion validity, as being a latent variable of the second type-II order is a forma-tive built the two first-order variables. For discriminant validity, Table 3A (at-tached) shows that all variables meet the criterion of discriminant validity. In-deed, the squares of correlations of each of these variables and other variables are below their AVE.
Regarding construct validity of the second order, the VIF calculated for the two sub-dimensions are all less than 2 (Table 4A). Thereby, we accepted the va-lidity of the first order that is constructed the “Health” and “Nutrition” on the second order. In short, the external model that meets the tests of validity and re-liability, we can infer that the indicators chosen are well built. That said, we can present the results of the internal model and examine its validity in the light of the criteria defined in the literature of the PLS approach.
4.3.2. Inner Model
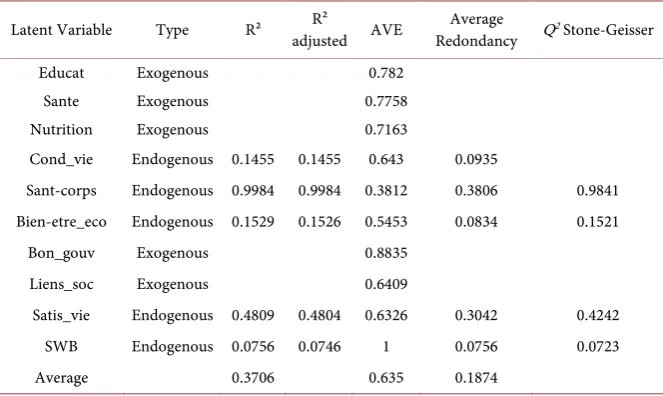
The result presentation of inner model is based on an analysis of the predictive quality of the model and the structural significance of path regression that can confirm or refute the assumptions of this model. The predictive quality is given by the analysis of 2
R or R2 adjusted. However, Q2 Stone-Geisser [60] [70] [71] [72] is presented as being better for the assessment of the predictive quality. The formula of 2
2
1 k jk j jk k E Q O = −
∑
∑
(3)with Ejk as the square of the predictor errors; Ojk squared predictor error
trivial given by the average of the remaining data of the procedure Blindfolding; j observed endogenous measures and k indices all indicators of the measure-ment model. If the value of Q2 Stone-Geisseris greater than 0, the model has good predictive validity. Otherwise, it will be irrelevant [60]-[72].
The structural regression coefficients are estimated and their significance test is obtained from the method of resampling bootstrap (or Jackknife), as the 2
R .
Therefore, we will analyze each structural equation of the inner model, which are five in number (the number of endogenous latent variables). All results are summarized in Table 2.
[image:11.595.208.539.373.710.2]The variable “Cond_vie” is explained in our model by the single latent varia-ble representing education. The regression coefficient is significantly positive, or 0, 3814. An average redundancy of 0.0935 indicates that the variable “Educat” predicts less than 10% of the variations in the average manifest variables of block ? “Cond_vie” (Table 3).
Table 2. Path coefficients of inner model.
Variables
dépendantes Independant Variables
Path Coeffi-cients Values Value (Bootstrap) Standard Error (Bootstrap) Critical Ratio (CR)
Con_vie Educat 0.3814*** 0.3805 0.0091 41.9599
Sant-corps
Educat 0.0011 0.0013 0.0009 1.3395
Sante 0.58818*** 0.5910 0.0154 38.2052
Nutrition 0.7855*** 0.7824 0.0132 59.3218
Cond_vie 0.0039* 0.0039 0.0009 4.2114
Bien-etre_eco
Educat 0.1732*** 0.1727 0.0083 20.7482
Cond_vie 0.2513*** 0.2519 0.0081 31.2058
Sant-corps 0.1339*** 0.1324 0.0083 16.1595
Satis_vie
Educat 0.0710** 0.0707 0.0132 5.3846
Cond_vie 0.1460*** 0.1467 0.0095 15.3619
Sant-corps 0.0079 0.0057 0.0098 0.8088
Bien-etre_eco 0.6066*** 0.6071 0.0083 73.0833
Bon_gouv 0.0511* 0.0500 0.0109 4.7103
Liens_soc −0.0293 −0.0288 0.0112 −2.6129
SWB
Educat 0.0307** 0.0308 0.0053 5.8201
Cond_vie 0.0778*** 0.0784 0.0048 16.0659
Sant-corps 0.0617** 0.0606 0.0078 7.9313
Bien-etre_eco 0.1237*** 0.1236 0.0052 23.5784
Bon_gouv −0.0196 −0.0195 0.0065 −3.0372
Liens_soc 0.0031 0.0047 0.0060 0.5188
Satis_vie 0.0969*** 0.0972 0.0041 23.9233
The variable “Sant-corps” is a construct of the second order formed by the first order latent variables that are “Sante” and “Nutrition” and caused by “Edu-cat” and “Cond_vie”. The path coefficients obtained from the PLS regression in-dicate the existence of a positive causal relationship of these variables on the “Sant-corps” but only causality of the living conditions on the body's health is significant, with a coefficient of 0.004 (Table 2). With regard to the predictabili-ty of this latent variable, it has a 0.3836 redundancy index. Reflecting the fact that the variables: Health, Nutrition, and Educat Cond_vie predict on average 38% of the variance in indicators of health of the body. In sum, the predictive quality of this variable is provided with a positive 2
Q 0.9841.
The variable “Bien-etre_eco” is determined by the variables: Cond_vie, Educat and Sant-corp. All three variables have coefficients that are all positive and sig-nificant. Regarding the prediction, redundancy is 0.0834. It reflects, in this sense, an ability to predict the manifest variables of economic well-being by the three built which is relatively low. However, with Q2 non-zero (0.1521), there has to be concluded in favor of predictive validity exogenous dimensions of economic well-being.
Life satisfaction is explained by all latent variables, except that relating to the subjective well-being. The coefficients are all positive, as we had assumed in the specification of the inner model, except the non-institutional support. The latter, as well as the health of the body are the only ones not to be significant at the 5% level. The independent variables predict on average 30% (0.3042) of the average variance of the indicators of life satisfaction; and the predictive quality of the model according to Statistics 2
Q Stone-Geisser is relevant to the extent that the value taken by this indicator is above zero, i.e.: 0.4242.
[image:12.595.208.540.525.723.2]Subjective well-being (SWB) is influenced by all dimensions. All path coeffi- cients, with the exception of those relating to good governance and non-institu- tional support, are significantly positive. Thus, all the basic capabilities
Table 3. Predictive quality of inner model.
Latent Variable Type R² adjusted AVE R² Redondancy QAverage 2 Stone-Geisser
Educat Exogenous 0.782
Sante Exogenous 0.7758
Nutrition Exogenous 0.7163
Cond_vie Endogenous 0.1455 0.1455 0.643 0.0935
Sant-corps Endogenous 0.9984 0.9984 0.3812 0.3806 0.9841
Bien-etre_eco Endogenous 0.1529 0.1526 0.5453 0.0834 0.1521
Bon_gouv Exogenous 0.8835
Liens_soc Exogenous 0.6409
Satis_vie Endogenous 0.4809 0.4804 0.6326 0.3042 0.4242
SWB Endogenous 0.0756 0.0746 1 0.0756 0.0723
Average 0.3706 0.635 0.1874
(education, living conditions and bodily health), economic well-being and life satisfaction positively cause the feeling of being happy. Furthermore, the predic-tive power of the model shows that independent variables provide, generally, a relevant predictive quality model with 2
Q Stone-Geisser which is significant, is not zero and is positive: 0.0723 (see Table 3). In sum, the predictive quality of the model, it is quite acceptable. Indeed, we have an average of 0.1874 redun-dancy model. Given the subjective nature of the data, we have an average fore-cast of manifest variables with the latent variables of 19%.
4.3.3. Global Model
The GoF implemented by [73] is retained in the literature as an indicator for as-sessing the fit quality of the model. It is the product of the AVE and R2. Our model has a GoF 0.4851. The value of the GoF is greater than 0.36, which is the threshold, used by [74] to assert for the good predictive quality. As for the rela-tive GoF, it is 0.8964 and rounded to the nearest tenth is equal to 0.900 is the threshold defined by [53] to judge the good quality of the model. The values of the internal and external GoF which are 0.9915 and 0.9041 respectively are also significant. From these results we can say that our model with good predictive quality overall.
5. Discussion and Conclusion
In the context of Senegal, our results do not show a large difference with those that we find in the theoretical and empirical literature of the CA. In this sense, the basic capabilities as education are significant for all other dimensions, except for the bodily health. This result shows the centrality of this capability as for Nussbaum and Sen Theory. The capability living conditions which bring togeth-er, in our definition, all basic functionings “be well housed” (sanitation, com-fort...) are the most stable determining of all well-being dimensions and the ca-pability: bodily health.
So even if our results show that bodily health, surprisingly, does not signifi-cantly determine life satisfaction, it is causal subjective and economic well-being. From this, our model gives results that are in line with [40] [42] [43] and [34] [44] or [45]. There is, in this sense, a confirmation of the thesis of [5] on “proof by happiness.” In addition, the importance of economic well-being (or the per-ception of the economic situation) in the explanation of life satisfaction and subjective well-being lead us to suspect a determining role of income in happi-ness. Subjective well-being depends more on the satisfaction for financial posi-tion and satisfacposi-tion of life. In order, the capability living condiposi-tions are the most important in the determination of subjective well-being; it is followed by the body’s health and education.
support can be seen as a situation of dependency and does not affect the well- being as is the case with life satisfaction (see Table 2). Also, good governance, as measured by the perception of the evolution of corruption and diversion, has a significant effect only on life satisfaction. She did not significantly influence the feeling of being happy. Ultimately, our objective was to propose a structural model to conceptualize well-being highlighting all relationships between these different dimensions. The use of latent variable model enabled us to quantify capabilities and examine the causal relationships which they had on each other. Our results argue in favor of CA and its relevance in a multidimensional mea-suring of well-being. However, our model suffers from a limit and that is the lack of consideration of cultural and individual social factors, like age, back-ground and gender. Thus, in a research perspective, we use multi-group analysis or the moderating effects of the PLS-PM to study the effect of these factors. The use of a MIMIC model in a confirmatory framework is also a relevant research track to achieve this purpose.
References
[1] Sen, A.K. (1983) Poor, Relatively Speaking. Oxford Economic Papers, 35, 153-169. [2] Nussbaum, M. (2012) Capabilités: Comment créer les conditions d’un monde plus
juste? Flammarion, Paris.
[3] Sen, A.K. (1980) Equality of What? In: McMurrin, S.M., Ed., Tanner Lectures on Human Values, Vol. 1, Cambridge University Press, Cambridge.
[4] Sen, A.K. (1992) Inequality Reexamined. Clarendon Press, Oxford. [5] Sen, A.K. (2012) L’idée de justice. 2nd Edition, Flammarion, Paris.
[6] Robeyns, I. (2005) The Capability Approach: A Theoretical Survey. Journal of Hu- man Development, 6, 93-117. https://doi.org/10.1080/146498805200034266
[7] Qizilbash, M. (2008) Amartya Sen’s Capability View Insightful Sketch or Distorted Picture? In: Alkire, S., Qizilbash, M. and Comim, F., Eds., The Capability Approa- ch: Concepts, Measures and Applications, Cambridge University Press, Cambridge and New York.
[8] Robeyns, I. (2006) The Capability Approach in Practice. Journal of Political Philo- sophy, 14, 351-376. https://doi.org/10.1111/j.1467-9760.2006.00263.x
[9] Alkire, S. (2005) Valuing Freedoms: Sen’s Capability Approach and Poverty Redu- ction. 1st Edition, Oxford University Press, Oxford.
[10] Sen, A.K. (2000) Repenser l’inégalité. Seuil, Paris.
[11] Sugden, R. (1993) Welfare, Resources, and Capabilities: A Review of Inequality Re- examined by Amartya Sen. Journal of Economic literature, 31, 1947-1962.
[12] Ysander, B.C. (1993) Comment to Erikson’s Work “Description of Inequality”: The Swedish Approach to Welfare Research. In: Nussbaum, M. and Sen, A., Eds., Quali-ty of Life, Clarendon Press, Oxford, 84-88.
[13] Srinivasan, T.N. (1994) Human Development: A New Paradigm or Reinvention of the Wheel? The American Economic Review, 84, 238-243.
[14] Roemer, J.E. (1996) Theories of Distributive Justice. Harvard University Press, Cambridge.
[16] Ndiaye, B. (2005) Les déterminants de la pauvreté rurale au Sénégal. IDEP, Bali. [17] Cisse, F. (1997) La pauvreté rurale au Sénégal: Profil et déterminants. Mémoire de
DEA, FASEG, UCAD, Dakar.
[18] Cisse, F. (2003) Le profil de Pauvreté au Sénégal: Une analyse de la robustesse des comparaisons de pauvreté. MIMAP, Rapport de recherche.
[19] Cisse, F. (2003) Le profil de la pauvreté au Sénégal: Une approche monétaire. MIMAP, Rapport de recherche.
[20] Badji, M.S. and Boccanfuso, D. (2006) La tendance d’évolution de la pauvreté fé- minine et de ses déterminants: Le cas des ménages conduits par des femmes au Sé- négal. Cahier de recherche/Working Paper, 6.
[21] Ki, J., Faye, B. and Faye, S. (2002) Pauvreté multidimensionnelle au Sénégal: Appro- ches non monétaires fondées sur les besoins fondamentaux. CREA-Sénégal. [22] Ki, J., Faye, S. and Faye, B. (2005) Multidimensional Poverty in Senegal : A Non-
Monetary Basic Needs Approach. Cahiers de recherche PMMA. No. 2005-05. [23] Boccanfuso, D., Esatche, A. and Savard, L. (2009) A Macro-Micro Analysis of the
Effects on Electricity Reform in Senegal on Poverty and Distribution. Journal of De- velopment Studies,45, 351-368. https://doi.org/10.1080/00220380802582361
[24] Mussard, S. and Pi Alperin, M.N. (2005) Théorie des ensembles flous et décom- position multidimensionnelle de la pauvreté: Le cas du Sénégal. GREDI, Groupe de Recherche en Economie et Développement International.
[25] Diallo, F.L. and Hamani, O. (2010) Tendance de la pauvreté au Sénégal entre 1994 et 2001: Une approche multidimensionnelle basée sur les ensembles flous. Consor- tium pour la recherche économique et sociale (CRES) MIMAP/ Sénégal, No. 2010/21.
[26] Diop, M. (2014) L’approche par les capabilités comme instrument d’analyse de la pauvreté: Une application sur des données du Sénégal. Innovations sociales, inno- vations économiques, Presses universitaires de Louvain, 179-201.
[27] Sen, A.K. (1987) On Ethics and Economics. Blackwell, Oxford.
[28] UNDP (1990) Human Development Report 1990. United Nations Development Programme (UNDP).
[29] Schokkaert, E. and Van Ootegem, L. (1990) Sen’s Concept of the Living Standard Applied to the Belgian Unemployed. Recherches Économiques de Louvain/Louvain Economic Review, 56, 429-450.
[30] Brandolini, A. and D’Alessio, G. (1998) Measuring Well-Being in the Functioning Space. General Conference of the International Association for Research in Income and Wealth, Cambridge, 23-29 August 1998.
[31] Chiappero, M.E. (2000) A Multidimensional Assessment of Well-Being Based on Sen’s Functioning Approach. Rivista Internazionale di Scienze Sociali, 108, 207-239. [32] Anand, P. and VanHees, M. (2006) Capabilities and Achievements: An Empirical
Study. The Journal of Socio-Economics, 35, 268-284.
https://doi.org/10.1016/j.socec.2005.11.003
[33] Krishnakumar, J. (2007) Going beyond Functionings to Capabilities: An Econo- metric Model to Explain and Estimate Capabilities. Journal of Human Develop- ment, 8, 39-63. https://doi.org/10.1080/14649880601101408
[34] Anand, P., Krishnakumar, J. and Tran, N.B. (2011) Measuring Welfare: Latent Va- riable Models for Happiness and Capabilities in the Presence of Unobservable He- terogeneity. Journal of Public Economics, 95, 205-215.
[35] Klasen, S. (2000) Measuring Poverty and Deprivation in South Africa. Review of Income and Wealth, 46, 33-58. https://doi.org/10.1111/j.1475-4991.2000.tb00390.x
[36] Qizilbash, M. (2002) A Note on the Measurement of Poverty and Vulnerability in the South African Context. Journal of International Development, 14, 757-772.
https://doi.org/10.1002/jid.922
[37] Qizilbash, M. and Clark, D.A. (2005) The Capability Approach and Fuzzy Poverty Measures: An Application to the South African Context. Social Indicators Research, 74, 103-139. https://doi.org/10.1007/s11205-005-6527-y
[38] Temitayo, A.A. and Omobowale, O.A. (2013) A Functioning Approach to Well Be-ing Analysis in Rural Nigeria. Sustainable Agriculture Research, 2, 149-163. [39] Kuklys, W. (2005) Amartya Sen’s Capability Approach: Theoretical Insights and
Empirical Applications. Springer Science & Business Media, Berlin.
[40] Wagle, U. (2005) Multidimensional Poverty Measurement with Economic Well- Being, Capability, and Social Inclusion: A Case from Kathmandu, Nepal. Journal of Human Development, 6, 301-328. https://doi.org/10.1080/14649880500287621
[41] Di Tommaso, M.L. (2007) Children Capabilities: A Structural Equation Model for India. The Journal of Socio-Economics, 36, 436-450.
https://doi.org/10.1016/j.socec.2006.12.006
[42] Krishnakumar, J. and Ballon, P. (2008) Estimating Basic Capabilities: A Structural Equation Model Applied to Bolivia. World Development, 36, 992-1010.
https://doi.org/10.1016/j.worlddev.2007.10.006
[43] Hassan, H. (2009) Capabilities Measurement: An Empirical Investigation. MPRA Paper, No. 16742.
[44] Hassan, H. (2013) Capabilities vis-à-vis Happiness: Evidence from Pakistan. MPRA Paper, No. 44892.
[45] Mabsout, R. (2011) The Capability Approach: From Ethical Foundations to Empi- rical Operationalization. PhD Thesis, Erasmus University, Rotterdam.
[46] Krishnakumar, J. (2014) Quantitative Methods for the Capability Approach. In: Encyclopedia of Life Support Systems (EOLSS) Developed under the Auspices of the UNESCO, Ed., Social and Cultural Development of Human Resources, Eolss, Publishers, Paris, 1-30.
[47] Nussbaum, M.C. (2000) Women and Human Development: The Capabilities Ap-proach. Cambridge University Press, Cambridge.
https://doi.org/10.1017/CBO9780511841286
[48] Sen, A.K. (2004) Capabilities, Lists, and Public Reason: Continuing the Conversa-tion. Feminist Economics, 10, 77-80.
https://doi.org/10.1080/1354570042000315163
[49] Alkire, S. (2007) Choosing Dimensions: The Capability Approach and Multidi- mensional Poverty. In: Kakwani, N. and Silber, J., Eds., The Many Dimensions of Poverty, Palgrave Macmillan, New York, 89-119.
https://doi.org/10.1057/9780230592407_6
[50] Sen, A.K. (1985) Commodities and Capabilities. North-Holland, Amsterdam. [51] Direction Générale du Plan (DGP) (2013) Enquete My World 2015 au Sénégal: Les
priorités de développement des Sénégalais. Ministère du plan Sénégal.
[52] Krishnakumar, J. and Chávez-Juárez, F. (2014) Estimating Capabilities with Struc- tural Equation Models: How Well Are We Doing in a “Real” World? Social Indica- tors Research, 129, 717-737.
tions to Recent Developments and Open Issues for Model Assessment and Impro- vement. In: Vinzi, E., Chin, W.W., Henseler, J. and Wang, H., Eds., Handbook of Partial Least Squares, Springer, Berlin Heidelberg, 47-82.
https://doi.org/10.1007/978-3-540-32827-8_3
[54] Wold, H. (1982) Model Construction and Evaluation When Theoretical Knowledge Is Scarce: An Example of the Use of Partial Least Squares. Cahier du Département d’économétrie, Faculté des Sciences Economiques et Sociales, 06, 79, 1982.
[55] Wold, H. (1985) Partial Least Squares. In: Kotz, S. and Johnson, N.L., Eds., Ency- clopedia of Statistical Sciences, Vol. 6, John Wiley, New York, 581-591.
[56] ANSD (2013) Rapport définitif de la deuxième Enquête de Suivi de la Pauvreté au Sénégal (ESPS II). Agence Nationale de la Statistique et de la Démographie (ANSD), Dakar.
[57] Tenenhaus, M., Vinzi, V.E., Chatelin, Y.M. and Lauro, C. (2005) PLS Path Mode- ling. Computational Statistics & Data Analysis, 48, 159-205.
https://doi.org/10.1016/j.csda.2004.03.005
[58] MacKenzie, S.B., Podsakoff, P.M. and Podsakoff, N.P. (2011) Construct Measure- ment and Validation Procedures in MIS and Behavioral Research: Integrating New and Existing Techniques. MIS Quarterly, 35, 293-334.
[59] Bollen, K.A. (1983) Structural Equations with Latent Variables. John Wiley & Sons, New York.
[60] Anderson, J.C. and Gerbing, D.W. (1988) Structural Equation Modeling in Practice: A Review and Recommended Two-Step Approach. Psychological Bulletin, 103, 411- 423. https://doi.org/10.1037/0033-2909.103.3.411
[61] Nunnally, J.C. (1978) Psychometric Theory. McGraw-Hill, New York.
[62] Nunnally, J.C. and Bernstein, I.H. (1994) The Assessment of Reliability. Psycho- metric Theory, 3, 248-292.
[63] Chin, W.W. (1998) The Partial Least Squares Approach to Structural Equation Mo- deling. Modern Methods for Business Research, 2, 295-336.
[64] Fornell, C. and Larcker, D.F. (1981) Evaluating Structural Equation Models with Unobservable Variables and Measurement Error. Journal of Marketing Research, 18, 39-50. https://doi.org/10.2307/3151312
[65] Afthanorhan, W. (2014) Hierarchical Component Using Reflective-Formative Mea- surement Model in Partial Least Square Structural Equation Modeling (Pls-Sem).
International Journal of Mathematics, 2, 33-49.
[66] MacKenzie, S.B., Podsakoff, P.M. and Jarvis, C.B. (2005) The Problem of Measure- ment Model Misspecification in Behavioral and Organizational Research and Some Recommended Solutions. Journal of Applied Psychology, 90, 710-730.
https://doi.org/10.1037/0021-9010.90.4.710
[67] Bollen, K. and Lennox, R. (1991) Conventional Wisdom on Measurement: A Struc- tural Equation Perspective. Psychological Bulletin, 110, 305-314.
https://doi.org/10.1037/0033-2909.110.2.305
[68] Fornell, C. and Bookstein, F.L. (1982) Two Structural Equation Models: LISREL and PLS Applied to Consumer Exit-Voice Theory. Journal of Marketing Research, 19, 440-452. https://doi.org/10.2307/3151718
[69] Ringle, C.M., Sarstedt, M. and Straub, D. (2012) A Critical Look at the Use of PLS- SEM in MIS Quarterly. MIS Quarterly (MISQ), 36, 3-14.
[70] Geisser, S. (1974) A Predictive Approach to the Random Effect Model. Biometrika, 61, 101-107. https://doi.org/10.1093/biomet/61.1.101
Journal of the Royal Statistical Society: Series B (Methodological), 36, 111-147. [72] Fornell, C. and Cha, J. (1994) Partial Least Squares. Advanced Methods of Marke-
ting Research, 407, 52-78.
[73] Tenenhaus, M., Amato, S. and Vinzi, V.E. (2004) A Global Goodness-of-Fit Index for PLS Structural Equation Modelling. Proceedings of the XLII SIS Scientific Mee- ting, 1, 739-742.
Appendix
Table 1A. Indicators of each dimension or latent variables from ESPS-II dataset.
Capabilities/Well-being Functionings
Dimensions variables Latent Indicators Manifest variables
Education Educat Level of studies nived_cm
The highest diploma obtained diplo_cm
Health Health Sick or injured in the past four weeks Consultation with a medical staff or eta_sant
healer Consul
Nutrition Nutrition
Number of meals per day in normal
times alim_1
Number of meals per day during learn
period alim_2
Housing conditions
Cond_vie
Type of housing typ_log
Roof materials mat_toît
Wall materials mat-mur
Type of toilet typ_toil
Source of electricity source_el
Index quintile of asset equipment quintile_a Good
governance Bon_gouv
Appreciation of corruption aprec_cor
Appreciation of public embezzlement aprec_det Non
institutional support
Liens_soc Support friends Soutami
Support of neighbors Soutvoiz
Economic subjective well-being
Bien-etre_eco Perception of the economic situation Satisfaction by rapport in income prcp_site satis_rev
Perception of the membership category prcp_men
Life satisfaction
Satis_vie
Satisfaction with consumption satis_con
Satisfaction with housing satis_log
Satisfaction with clothing satis_hab
Satisfaction with health satis_san
Satisfaction with education satis_edu
Subjective
Table 2A. Outer model result.
Latent
Variables Variables Manifest Cronbach Alpha D.G. (ACP) Rho de Eigenvalues Loadings Communalities
Average Communalities
(AVE)
Educat nived_cm 0.7251 0.8791 1.5687 0.9135 0.8345 0.7820
diplo_cm 0.4313 0.8541 0.7295
Sante eta_sant 0.7135 0.8747 1.5546 0.9047 0.8184 0.7758
consul 0.4454 0.8563 0.7332
Nutrition alim_1 0.6041 0.8347 1.4327 0.8387 0.7035 0.7163
alim_2 0.5673 0.8539 0.7291
Cond_vie
typ_log
0.8893 0.9158
3.8711 0.7813 0.6105
0.6430
mat_toit 0.6417 0.8507 0.7237
mat_mur 0.4931 0.7604 0.5783
typ_toil 0.4268 0.7692 0.5917
source_elec 0.3102 0.7697 0.5924
quintile_asset 0.2572 0.8727 0.7615
Bien-etre_eco
satis_rev
0.5976 0.7886
1.6639 0.7750 0.6007
0.5453
prcp_sitemen 0.7294 0.5836 0.3406
prcp_menap 0.6066 0.8335 0.6948
Bon_gouv aprec_cor 0.8728 0.9402 1.7742 0.9626 0.9265 0.8835
aprec_det 0.2258 0.9168 0.8405
Liens_soc soutami 0.5796 0.8263 1.4081 0.5575 0.3108 0.6409
soutvoiz 0.5919 0.9854 0.9710
Satis_vie
satis_consal
0.8546 0.8960
3.1645 0.8034 0.6455
0.6326
satis_log 0.5579 0.7794 0.6074
satis_hab 0.4541 0.8320 0.6922
satis_sant 0.4345 0.8175 0.6684
satis_educ 0.3890 0.7412 0.5494
SWB Swb 1.0000
Sant-corps
eta_sant 1.5743 0.5934 0.3521
0.3812
Consul 1.4153 0.4895 0.2396
alim_1 0.5668 0.6674 0.4454
alim_2 0.4437 0.6982 0.4875
Table 3A. Test for discriminant validity.
Educat Sante Nutrition Cond_vie Sant-corps Bien-etre_eco Bon_gouv Liens_soc Satis_vie SWB AVE
Educat 1 0.00 0.00 0.15 0.00 0.06 0.00 0.02 0.07 0.00 0.7820
Sante 0.00 1 0.00 0.00 0.38 0.00 0.00 0.00 0.00 0.00 0.7758
Nutrition 0.00 0.00 1 0.01 0.65 0.04 0.00 0.00 0.02 0.02 0.7163
Cond_vie 0.15 0.00 0.01 1 0.01 0.12 0.03 0.05 0.13 0.03 0.6430
Sant-corps 0.00 0.38 0.65 0.01 1 0.03 0.00 0.00 0.01 0.02 0.3812
Bien-etre_eco 0.06 0.00 0.04 0.12 0.03 1 0.00 0.01 0.46 0.07 0.5453
Bon_gouv 0.00 0.00 0.00 0.03 0.00 0.00 1 0.00 0.00 0.00 0.8835
Liens_soc 0.02 0.00 0.00 0.05 0.00 0.01 0.00 1 0.01 0.00 0.6409
Satis_vie 0.07 0.00 0.02 0.13 0.01 0.46 0.00 0.01 1 0.04 0.6326
SWB 0.00 0.00 0.02 0.03 0.02 0.07 0.00 0.00 0.04 1
Source: authors, from XLSTAT-PLSPM.
Table 4A. Test of validity for second order variable: “Sant-corps”.
Statistic Sante Nutrition
R² 0.0014 0.0014
Tolérancy 0.9986 0.9986
VIF 1.0014 1.0014
Source: authors, from XLSTAT-PLSPM.
Submit or recommend next manuscript to SCIRP and we will provide best service for you:
Accepting pre-submission inquiries through Email, Facebook, LinkedIn, Twitter, etc. A wide selection of journals (inclusive of 9 subjects, more than 200 journals)
Providing 24-hour high-quality service User-friendly online submission system Fair and swift peer-review system
Efficient typesetting and proofreading procedure
Display of the result of downloads and visits, as well as the number of cited articles Maximum dissemination of your research work
Submit your manuscript at: http://papersubmission.scirp.org/
[image:21.595.209.538.351.415.2]