ISSN Online: 2164-3199 ISSN Print: 2164-3180
The Effect of Time and Temperature Variables
on Some Routine Coagulation Tests among
Subjects of African Descent in Sokoto,
North Western Nigeria
D. Ikhuenbor
1, F. Aghedo
1, I. Z. Isah
2, I. Iwueke
2, R. A. Oladigbolu
3, N. B. Egenti
4, O. Erhabor
2*1Department of Haematology and Blood Transfusion Science, Usmanu Danfodiyo University Teaching Hospital, Sokoto, Nigeria 2Department of Haematology and Blood Transfusion Science, Faculty of Medical Laboratory Science, Usmanu Danfodiyo University,
Sokoto, Nigeria
3Department of Community Medicine, Usmanu Danfodiyo University Teaching Hospital, Sokoto, Nigeria 4Department of Community Medicine, Usmanu Danfodiyo University, Abuja, Nigeria
Abstract
This study evaluated the effects of time and temperature variables on routine Proth-rombin Time test and Activated Partial Thromboplastin Time (APTT) test among subjects of African descent in Sokoto, North Western Nigeria. Samples of 99 subjects made up of 49 male and 50 female subjects with mean age 38.3 ± 22.3 years. Coagu-lation tests were performed immediately specified times after phlebotomy up to 24 hours (0, 1, 2, 3, 4 and 24 hours at room temperature of 40 degrees C. Our data demonstrate that prothrombin time and APTT results are stable for up to 2 hours, remaining constant regardless of storage conditions. Post hoc tests using Bonferroni correction revealed that there were increases in PT time from 0 hour to 4 hours (17.82 ± 0.61 seconds vs 18.30 ± 0.59 seconds, respectively), from 0 hour to 24 hours (17.82 ± 0.61 seconds vs 18.48 ± 0.59 seconds, respectively), from 2 hours to 4 hours (17.89 ± 0.58 seconds vs 18.30 ± 0.59 seconds), from 2 hours to 24 hours (17.89 ± 0.58 seconds vs 18.48 ± 0.58 seconds), which were all statistically significant (p = 0.002 and p < 0.000, p < 0.000, p < 0.000, respectively). However, the increase in PT time from 0 hour to 2 hours (17.82 ± 0.61 seconds vs 17.89 ± 0.59 seconds, respectively) and from 4 hours to 24 hours (18.30 ± 0.59 vs 18.48 ± 0.59 seconds, respectively) were not statistically significant (p = 1, p = 0.428). A repeated measure ANOVA de-termined that mean PTTK time differed statistically significantly between time points F (3, 291) = 119.22, p < 0.001. Post hoc tests using Bonferroni correction revealed that there were increase in PTTK time from 0 hour to 2 hours (37.86 ± 1.04 seconds vs 39.94 ± 1.07 seconds, respectively), from 0 hour to 4 hours (37.86 ± 1.04 seconds How to cite this paper: Ikhuenbor, D.,
Aghedo, F., Isah, I.Z., Iwueke, I., Oladigbo-lu, R.A., Egenti, N.B. and Erhabor, O. (2016) The Effect of Time and Temperature Va-riables on Some Routine Coagulation Tests among Subjects of African Descent in So-koto, North Western Nigeria. Open Journa of Blood Diseases, 6, 79-88.
http://dx.doi.org/10.4236/ojbd.2016.64011
Received: October 20, 2016 Accepted: December 23, 2016 Published: December 26, 2016
Copyright © 2016 by authors and Scientific Research Publishing Inc. This work is licensed under the Creative Commons Attribution International License (CC BY 4.0).
vs 42.34 ± 1.11 seconds, respectively), from 0 hours to 24 hours (37.86 ± 1.04 seconds vs 44.93 ± 1.20 seconds), from 2 hours to 4 hours (39.94 ± 1.07 seconds vs 42.34 ± 1.11 seconds), from 2 hours to 24 hours (39.94 ± 1.07 seconds vs 44.93 ± 1.20 sec-onds) and from 4 hours to 24 hours (42.43 ± 1.11 vs 44.93 ± 1.20 secsec-onds), which were all statistically significant at p < 0.001). Therefore, we conclude that there are no statistically significant differences in the PT and APTT between 0 and 2 hours. A longer timing (after 2 hours) from phlebotomy collection of blood from respondents elicited a statistically significant increase in the PT and APTT result. There were no statistically significant differences in the PT and APTT result determined 4 hours and 24 hours after phlebotomy. Longer timing from collection of blood from re-spondents elicited a statistically significant increment/increase in the clotting time using PTTK. Our data demonstrate that PT and APTT results are stable for 2 hours remaining constant regardless of storage conditions.
Keywords
Effect, Time, Temperature, Coagulation, African, Sokoto, Nigeria
1. Introduction
prevail-ing temperature has on PT and APTT results. The aim of this present study is of inves-tigating the effect of storage temperature and time of testing on PT and APTT results. It is not known whether changes caused by delayed analyses and temperature have a clin-ically significant difference in the results obtained.
2. Materials and Methods
2.1. Study Area
The study was carried out in Usmanu Danfodiyo University Teaching Hospital (UDUTH), Sokoto, Nigeria. Sokoto State is located in the extreme North Western corner of Nige-ria, it occupies 25,973 square kilometres and is situated along latitude 13˚3'39"N and longitude 5˚14'2"E. As of 2005, it had an estimated population of more than 4.2 million [8]. It shares its borders with Niger Republic to the North, Zamfara State to the East, Kebbi State to the South-East and Benin Republic to the West. With an annual average temperature of 28.3˚C (82.9˚F). Sokoto is in the dry Sahel, surrounded by Sandy Sa-vannah and isolated Hills. Sokoto is on the whole, a very hot area.
2.2. Study Subjects and Design
The study included consecutively recruited patients referred for PT and APTT test in the Department of Haematology of Usmanu Danfodiyo University Teaching Hospital (UDUTH), Sokoto. Verbal informed consent was obtained from the subjects.
2.3. Statistical Analysis
Statistical analysis was performed using statistical package for social sciences (SPSS) version 20. Frequencies and percentages were calculated. Student t-test (independent t test and paired sample t-test) and ANOVA were used for comparison of data. The re-sults were presented as mean ± standard error of mean. A p-value of ≤0.05 was consi-dered as significant in all statistical comparisons.
2.4. Inclusion Criteria
Inclusion criteria included Clinical Indication and request for PT and APTT by a clini-cian and willingness of subject to offer verbal informed consent to participate as subject in this study.
2.5. Exclusion Criteria
The following were excluded from the study; patients in whom PT and APTT were not clinically indicated and patients who refused to offer a verbal informed consent to par-ticipate as subject in this study.
2.6. Study Design
demographic data.
2.7. Study Site and Participating Hospital
Study was conducted in the Haematology Laboratory of the Faculty of Medical Labora-tory Sciences, Usmanu Danfodiyo University, Sokoto, Nigeria.
2.8. Sample Collection
About 2.7 millilitres of blood sample was collected from each subject aseptically using the venepuncture technique. The blood was collected into tubes containing sodium cit-rate anticoagulant. The citcit-rated samples were centrifuged at 3000 rpm for 5 minutes to obtain clear non-haemolysed citrated plasma. The plasma was transferred into sterile labelled test tubes and assayed (in batches) for PT and APTT using the Diagen (UK) PT and APTT kits.
3. Result
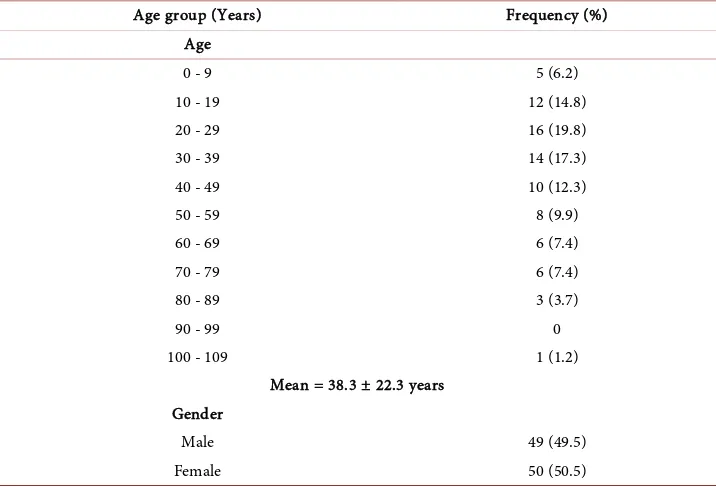
[image:4.595.194.552.463.709.2]This study evaluated the effects of time and temperature variables on routine Proth-rombin Time test and Activated Partial Thromboplastin Time (APTT) test among sub-jects of African descent in Sokoto, North Western Nigeria. Samples 99 subsub-jects made up of 49 (49.5%) male and 50 (50.5%) female subjects with mean age 38.3 ± 22.3 years. Table 1 show the age and gender distribution of subjects. Coagulation tests were per-formed immediately specified times after phlebotomy up to 24 hours (0, 1, 2, 3, 4 and 24 hours at room temperature of 40 degrees C. Our data demonstrate that prothrombin time and APTT results are stable for up to 2 hours, remaining constant regardless of sto-rage conditions. Table 2 and Table 3 show the mean PT and APTT results respectively
Table 1. Age and gender distribution of subjects.
Age group (Years) Frequency (%)
Age
0 - 9 5 (6.2)
10 - 19 12 (14.8)
20 - 29 16 (19.8)
30 - 39 14 (17.3)
40 - 49 10 (12.3)
50 - 59 8 (9.9)
60 - 69 6 (7.4)
70 - 79 6 (7.4)
80 - 89 3 (3.7)
90 - 99 0
100 - 109 1 (1.2)
Mean = 38.3 ± 22.3 years Gender
Male 49 (49.5)
Table 2. Mean PT results of subjects done hourly over a 4 hours period.
Time (Hours) PT (95% Confidence Interval)
Mean Std. Error Lower Bound Upper Bound
1 17.818 0.605 16.617 19.020
2 17.889 0.579 16.739 19.039
3 18.303 0.596 17.121 19.486
4 18.475 0.589 17.306 19.644
Table 3. Differences between the mean time for PTTK when done over time.
Time (Hours) PTTK (95% Confidence Interval)
Mean Std. Error Lower Bound Upper Bound
1 37.857 1.040 35.792 39.922
2 39.939 1.070 37.815 42.063
3 42.337 1.112 40.130 44.543
4 44.929 1.201 42.545 47.312
of subjects done hourly over a 4 hours period. A repeated measure ANOVA with sphericity assumed determined that mean PT time differed statistically significantly between time points F (3, 294) = 16.294, p < 0.001. Post hoc tests using Bonferroni cor-rection revealed that there were increase in PT time from 0hour to 4 hours (17.82 ± 0.61 seconds vs 18.30 ± 0.59 seconds, respectively), from 0 hour to 24 hours (17.82 ± 0.61 seconds vs 18.48 ± 0.59 seconds, respectively), from 2 hours to 4 hours (17.89 ± 0.58 seconds vs 18.30 ± 0.59 seconds), from 2 hours to 24 hours (17.89 ± 0.58 seconds vs 18.48 ± 0.58 seconds), which were all statistically significant (p = 0.002 and p < 0.000, p < 0.000, p < 0.000, respectively). However, the increase in PT time from 0 hour to 2 hours (17.82 ± 0.61 seconds vs 17.89 ± 0.59 seconds, respectively) and from 4 hours to 24 hours (18.30 ± 0.59 vs 18.48 ± 0.59 seconds, respectively) were not statistically sig-nificant (p = 1, p = 0.428). Table 3 shows the Bonferroni comparison between the Mean Time for PT when done over Time.
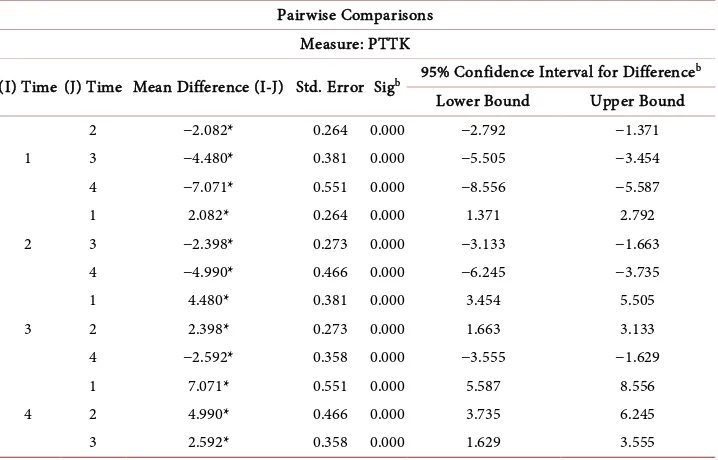
A repeated measure ANOVA determined that mean PTTK time differed statistically significantly between time points F (3, 291) = 119.22, p < 0.001. Post hoc tests using Bonferroni correction revealed that there were increase in PTTK time from 0 hour to 2 hours (37.86 ± 1.04 seconds vs 39.94 ± 1.07 seconds, respectively), from 0 hour to 4 hours (37.86 ± 1.04 seconds vs 42.34 ± 1.11 seconds, respectively), from 0 hours to 24 hours (37.86 ± 1.04 seconds vs 44.93 ± 1.20 seconds), from 2 hours to 4 hours (39.94 ± 1.07 seconds vs 42.34 ± 1.11 seconds), from 2 hours to 24 hours (39.94 ± 1.07 seconds vs 44.93 ± 1.20 seconds) and from 4 hours to 24 hours (42.43 ± 1.11 vs 44.93 ± 1.20 seconds), which were all statistically significant at p < 0.001). Table 4 shows the Bon-ferroni comparison between the mean time for APPT when done over time. Table 5 shows the differences between the Mean Time for PTTK when done over Time.
4. Discussion
[image:5.595.193.554.207.291.2]Table 4. Differences between the mean time for PT when done over time.
Pairwise Comparisons Measure: PT
(I) Time (J) Time Mean Difference (I-J) Std. Error p-valueb 95% Confidence Interval for Difference b
Lower Bound Upper Bound
1
2 −0.071 0.082 1.000 −0.290 0.149
3 −0.485* 0.128 0.002* −0.829 −0.140
4 −0.657* 0.144 0.000* −1.045 −0.268
2
1 0.071 0.082 1.000 −0.149 0.290
3 −0.414* 0.094 0.000* −0.668 −0.161
4 −0.586* 0.114 0.000* −0.893 −0.279
3
1 0.485* 0.128 0.002* 0.140 0.829
2 0.414* 0.094 0.000* 0.161 0.668
4 −0.172 0.094 0.428 −0.425 0.082
4
1 0.657* 0.144 0.000* 0.268 1.045
2 0.586* 0.114 0.000* 0.279 0.893
3 0.172 0.094 0.428 −0.082 0.425
Based on estimated marginal means. *The mean difference is significant at the 0.05 level; bAdjustment for multiple comparisons: Bonferroni.
Table 5. Differences between the mean time for PTTK when done over time.
Pairwise Comparisons Measure: PTTK
(I) Time (J) Time Mean Difference (I-J) Std. Error Sigb 95% Confidence Interval for Difference b
Lower Bound Upper Bound
1
2 −2.082* 0.264 0.000 −2.792 −1.371
3 −4.480* 0.381 0.000 −5.505 −3.454
4 −7.071* 0.551 0.000 −8.556 −5.587
2
1 2.082* 0.264 0.000 1.371 2.792
3 −2.398* 0.273 0.000 −3.133 −1.663
4 −4.990* 0.466 0.000 −6.245 −3.735
3
1 4.480* 0.381 0.000 3.454 5.505
2 2.398* 0.273 0.000 1.663 3.133
4 −2.592* 0.358 0.000 −3.555 −1.629
4
1 7.071* 0.551 0.000 5.587 8.556
2 4.990* 0.466 0.000 3.735 6.245
3 2.592* 0.358 0.000 1.629 3.555
Based on estimated marginal means. *The mean difference is significant at the 0.05 level. bAdjustment for multiple comparisons: Bonferroni.
[image:6.595.195.554.375.605.2]finding is at variance with observation in a previous report [9] which indicated that PT/INR result is clinically relevant after storage for up to 24 h at 4˚C and 25˚C; while APTT could be stored for up to 12 h at 4˚C and 8 h at 25˚C. Our finding is also at va-riance with a previous report which indicated that prothrombin time and APTT results are stable for up to 24 h and 8 h respectively, remaining constant regardless of storage conditions [10]. Also, Goyal and colleagues [11] evaluated coagulation parameters (PT and APTT) at 0, 6, 24 and 48 h from the plasma stored at room temperature, as well as plasma stored under refrigerated and freezing conditions and observed that PT can be stored and analysed without any significant changes for up to 6 h from the actual blood collection, while for APTT results, plasma samples should be run immediately after collection. Our finding is consistent with previous report [12] which indicated that APTT samples can be accepted up to 2 h only at RT or Refrigerator. Our acceptable time intervals for PT and APTT determination are shorter than those recommended in the CLSI H21-A5 guidelines [5] which recommend that specimens should be analyzed within 24 h for PT and 4 h for APTT and other assays if stored at room temperature (25˚C). Our finding is also at variance with previous reports [13] [14] [15] [16] [17] which reported that PT and APTT can be reliably tested after storage for 8 h at room temperature and that the acceptable time interval can easily be extended to 24 h for PT determination.
In variance to our findings, van Geest-Daalderop and colleagues [18] reported that the acceptable time interval for PT/INR determination is 6 h at 4˚C - 6˚C, 25˚C, and 37˚C. Moreover, Oddoze and colleagues [15] reported that the acceptable time interval for APTT determination is 6 h at 4˚C and 25˚C. Our finding is partly in agreement with a previous report by Mohammed Saghir and colleagues [12] who reported that samples for PT testing can be accepted only up to 4 h when kept at RT while samples for APTT can be accepted up to 2 h only at RT or refrigerator. Our finding is also slightly at vari-ance with a previous report [19] which indicated that prothrombin time (PT) and acti-vated partial thromboplastin time (APTT) should be completed within one hour of sample collection and the storage temperature should be at room temperature. The reason for our distinct finding compared to other authors is that unlike others, the pre-vailing room temperature under which our testing was carried out was at 40˚C.
We observed that there were no statistically significant differences in the PT and APTT result determined 4 hours and 24 hours after phlebotomy. Longer timing from collection of blood from respondents seems to elicit a statistically significant incre-ment/increase in the clotting time using PT and PTTK. Our finding is also at variance with findings by previous authors [20][21] who concluded that no changes were noted in PT and APTT up to 6 h and 8 h respectively. Similarly, a previous study carried out by Salvagno and colleagues [22] indicated that a 6-h storage of uncentrifuged specimens at either RT or 4 degrees C may still be suitable to achieve results of routine coagulation testing comprised within the analytical quality specifications for desirable bias.
report indicated that APTT measurements were increased at 4˚C while PT measure-ments were decreased at 4˚C [23]. Similarly, Heil and colleagues [24] demonstrated that APTT samples were stable up to 8 h at either RT or 4˚C, except for those which were on unfractionated heparin therapy. Several studies recommended that PT and APTT de-terminations may be constant for periods more than currently suggested in NCCLS guidelines [25] [26]. PT, and APTT are part of the conventional routine coagulation panel. This study has shown that accurate standardization of both the preanalytical and analytical phases is pivotal to achieving accuracy and precision of results. There may be need for timely and accurate coagulation testing of plasma samples in environment where prevailing room temperature is higher than the CLSI H21-A5 guidelines pre-scribed threshold room temperature of 25˚C. Coagulation testing is very important to diagnose and treat haemophilia, in management of haemorrhage, to monitor oral anti-coagulant therapy, chronic liver disease, in thrombotic disease and in the determination of patients in which FFP is clinically indicated.
5. Conclusion and Recommendations
This study has shown that there are no statistically significant differences in the PT and APTT between 0 and 2 hours. A longer timing (after 2 hours) from phlebotomy collec-tion of blood from respondents elicited a statistically significant increase in the PT and APTT result. There may be need for timely and accurate coagulation testing of plasma samples in environment where prevailing room temperature is higher that the CLSI H21-A5 guidelines prescribed threshold room temperature of 25˚C.
References
[1] Lippi, G., Guidi, G.C., Mattiuzzi, C. and Plebani, M. (2006) Preanalytical Variability: The Dark Side of the Moon in Laboratory Testing. Clinical Chemistry and Laboratory Medicine, 44, 358-365. https://doi.org/10.1515/cclm.2006.073
[2] Zhao, Y. and Lv, G. (2013) Influence of Temperature and Storage Duration on Measure-ment of Activated Partial Thromboplastin Time, D-Dimers, Fibrinogen, Prothrombin Time and Thrombin Time, in Citrate-Anticoagulated Whole Blood Specimens. International Journal of Laboratory Hematology, 35, 566-570. https://doi.org/10.1111/ijlh.12113
[3] Prelipcean, C.C., Fierbinteanu-Braticevici, C., Drug, V.L., Lăcătuşu, C., Mihai, B. and Mi-hai. C. (2011)Liver Cirrhosis-Procoagulant Stasis. Revista Medico-Chirurgicala a Societatii De Medici Si Naturalisti Din Iasi, 115, 678-685.
[4] Omidkhoda, A., Tabatabaei, M.R., Atarodi, K., Karimi, K., Froushani, A.R. and Pourfathol-lah, A.A. (2011) A Comparative Study of the Effects of Temperature, Time and Factor VIII Assay Type on Factor VIII Activity in Cryoprecipitate in Iran. Blood Transfusion, 9, 394- 399.
[5] Clinical and Laboratory Standards Institute (2008) Approved Guideline: Fifth Edition (H21-A5). Clinical and Laboratory Standards Institute, 28, 1-33.
[6] Zürcher, M., Sulzer, I., Barizzi, G., Lammle, B. and Alberio, L. (2008) Stability of Coagula-tion Assays Performed in Plasma from Citrated Whole Blood Transported at Ambient Temperature. Thrombosis and Haemostasis, 99, 416-426.
[7] van Geest-Daalderop, J.H., Mulder, A.B., Boonman-de Winter, L.J., Hoekstra, M.M. and van den Besselaar, A.M. (2005) Preanalytical Variables and Off-Site Blood Collection: In-fluences on the Results of the Prothrombin Time/International Normalized Ratio Test and Implications for Monitoring of Oral Anticoagulant Therapy. Clinical Chemistry, 51, 561- 568. https://doi.org/10.1373/clinchem.2004.043174
[8] National Population Commission (NPC) (2007) National Census Figures, Abuja, Nigeria.
http://www.population.gov.ng/
[9] Feng, L., Zhao, Y., Zhao, H. and Shao, Z. (2014) Effects of Storage Time and Temperature on Coagulation Tests and Factors in Fresh Plasma. Science Report, 4, 3868.
https://doi.org/10.1038/srep03868
[10] Adcock, D., Kressin, D. and Marlar, R.A. (1998) The Effect of Time and Temperature Variables on Routine Coagulation Tests. Blood Coagul Fibrinolysis, 9, 463-470.
https://doi.org/10.1097/00001721-199809000-00002
[11] Goyal, V.K., Kakade, S., Pandey, S.K., Gothi, A.K. and Nirogi, R. (2015) Determining the Effect of Storage Conditions on Prothrombin Time, Activated Partial Thromboplastin Time and Fibrinogen Concentration in Rat Plasma Samples. Laboratory Animal, 49, 311-318.
https://doi.org/10.1177/0023677215597137
[12] Mohammed Saghir, S.A., Al-Hassan, F.M., Alsalahi, O.S., Abdul Manaf, F.S. and Baqir, H.S. (2012) Optimization of the Storage Conditions for Coagulation Screening Tests. Journal of College of Physicians and Surgery of Pakistan, 22, 294-297.
[13] Wang, X., Ma, J. and Hao, Z.L. (2002) Influence of Storage Time of PT and APTT at Dif-ferent Temperature. Journal of Hebei Medical University, 23, 108-109.
[14] Wang, B.L., Guo, W.L. and Pan, B.S.H. (2011) Influence of Storage Time at Room Temper-ature on Routine Coagulation Tests. Chinese Journal of Laboratory Medicine, 34, 595-597. [15] Oddoze, C., Lombard, E. and Portugal, H. (2012) Stability Study of 81 Analytes in Human
Whole Blood, in Serum and in Plasma. Clinical Biochemistry, 45, 464-469.
https://doi.org/10.1016/j.clinbiochem.2012.01.012
[16] Rao, L.V., Okorodudu, A.O., Petersen, J.R. and Elghetany, M.T. (2000) Stability of Proth-rombin Time and Activated Partial Thromboplastin Time Tests under Different Storage Conditions. Clinical Chemical Acta, 300, 13-21.
https://doi.org/10.1016/S0009-8981(00)00288-6
[17] Kemkes-Matthes, B., Fischer. R. and Peetz, D. (2011) Influence of 8 and 24-h Storage of Whole Blood at Ambient Temperature on Prothrombin Time, Activated Partial Throm-boplastin Time, Fibrinogen, Thrombin Time, Antithrombin and D-Dimer. Blood Coagula-tion and Fibrinolysis, 22, 215-220. https://doi.org/10.1097/MBC.0b013e328343f8bf
[18] Van Geest-Daalderop, J.H., Mulder, A.B., de Winter, L.J., Hoekstra, M.M. and van den Besselaar, A.M. (2005) Preanalytical Variables and Off-Site Blood Collection: Influences on the Results of the Prothrombin Time/International Normalized Ratio Test and Implications for Monitoring of Oral Anticoagulant Therapy. Clinical Chemical Acta, 51, 561-568.
https://doi.org/10.1373/clinchem.2004.043174
[19] Komiyama, Y. (2015) Samples in Coagulation Test. Rinsho Byori, 63, 1397-1404.
[20] Koepke, J.A., Rodgers, J.L. and Ollivier, M.J. (1975) Pre-Instrumental Variables in Coagula-tion Testing. American Journal Clinical Pathology, 64, 591-596.
https://doi.org/10.1093/ajcp/64.5.591
[21] Neofotistos, D., Oropeza, M. and Ts’ao, C.H. (1998) Stability of Plasma for Add on PT and APTT Tests. American Journal Clinical Pathology, 109, 758-763.
[22] Salvagno, G.L., Lippi, G., Montagnana, M., Franchini, M., Poli, G. and Guidi, G.C. (2009) Influence of Temperature and Time before Centrifugation of Specimens for Routine Co-agulation Testing. International Journal of Laboratory Hematolology, 31,462-467.
https://doi.org/10.1111/j.1751-553X.2008.01058.x
[23] Tabata, H., Nakamura, S. and Matszawa, T. (1995) Some Species Differences in the False Prolongation of Prothrombin Times and Activated Partial Thromboblastin Times in Toxi-cology. Comparative Haematology International, 5, 140-144.
https://doi.org/10.1007/BF00638933
[24] Heil, W., Grunewald, R., Amend, M. and Heins, M. (1998) Influence of Time and Tem-perature on Coagulation Analyses in Stored Plasma. Clinical Chemistry Laboratory Medi-cine, 36, 459-462. https://doi.org/10.1515/CCLM.1998.077
[25] Fiore, L.D., Brophy, M.T. and Hankins, M. (1993) The Effect of Blood Sample Storage and Transport on the PT in Anticoagulated Patients. Thrombosis and Haemostasis, 69, 676-679. [26] Clinical and Laboratory Standards Institute (2003) Collection, Transport, and Processing of
Blood Specimens for Testing Plasma-Based Coagulation Assays. CLSI, Wayne.
Submit or recommend next manuscript to SCIRP and we will provide best service for you:
Accepting pre-submission inquiries through Email, Facebook, LinkedIn, Twitter, etc. A wide selection of journals (inclusive of 9 subjects, more than 200 journals)
Providing 24-hour high-quality service User-friendly online submission system Fair and swift peer-review system
Efficient typesetting and proofreading procedure
Display of the result of downloads and visits, as well as the number of cited articles Maximum dissemination of your research work