Skewness in stock returns: evidence from
the Bucharest Stock Exchange during
2000 – 2011
Panait, Iulian and Slavescu, Ecaterina Oana
Academia de Studii Economice (Academy of Economic Studies)
11 May 2012
Online at
https://mpra.ub.uni-muenchen.de/38751/
SKEWNESS IN STOCK RETURNS: EVIDENCE FROM THE
BUCHAREST STOCK EXCHANGE DURING 2000 – 2011
IULIAN PANAIT ECATERINA SLAVESCU**
Abstract
Our paper investigates the symmetry in stock returns of the 30 most liquid companies traded on Bucharest Stock Exchange during 2000 – 2011 and also the most representative 5 market indices. Our daily data shows that skewness estimates are slightly negative for most indices and individual stocks, but only a few present values significantly different from the characteristics of a normal distribution. We compare our results with skewness estimates for 21 major and emerging stock market indices around the world and find that such results are similar to other low capitalization and trading volume markets. For all the Romanian and international assets studied, the Studentized-Range (St-R) and Jarque-Bera (J-B) tests reject the hypothesis of normal distribution of daily returns.
Keywords: Skewness, stock returns, asymmetric returns, frontier and emerging markets.
JEL Classification: G01, G12, G14, G15
Introduction
This paper is dedicated to the study of the normality of distributions and especially the symmetry (or asymmetry) of the financial assets returns. Our focus is on the Romanian capital market and especially on the indices and individual stocks traded on the Bucharest Stock Exchange but for comparison reasons we also include in our analysis a good number of international developed and emerging stock market indices.
Maximization of utility is the principle behind investment choice. The conventionalmean-variance equilibrium method (a two-parametermodel) requires either that return distributions are normal (Gaussian) or quadraticutility functions. Although over time esearchers have proposed different statistical distributionsfor pricing financial assets, the pertinence of symmetry analysisexceeds the pure determination of the statistical distributions.
The well known Capital Asset Pricing Model(CAPM) assumes that investors are only interested about the mean andvariance of returns, and thus implying that upside and downside risks are viewedwith equal dislike.
Some other authors have found that CAPM-based valuationmeasures are not so appropriate when market timing strategies and their subsequentnon-normal returns are taken into account. Also, investors typically take into consideration the difference between upside and downside risk. As a result, the basic hypothesis of the CAPM are disputed, and its emblematic risk measure beta is equally doubted.
There are models that allow for some asymmetry of the returns (two or three-parametermodels) and require logarithmic or cubic utility functions.Alternatively, some financial models were created to allow skewness to affect the requiredreturn of financial assets. Kraus and Litzenberger (1976),(1983) constructed a three-moment capital asset pricing model that includesthe effect of skewness on valuation.
Ph. D. candidate, The Bucharest Academy of Economic Studies, Piata Romana 6, District 1, Bucharest, Romania, (email: iulian.panait@gmail.com).
**
If we take into consideration arguments that higher moments of returndistributions are not negligible, at least not in major international financialmarkets like USA, UK and Japan, it is not reasonable to assume thatinvestors will ignore them.
Consequently, the objective of ourinvestigation is to extend the previous work and to find whether such results are true for the Romanian capital market. In order to achive this, we will compute skewness according to its most widely used defition and will employ statistical tests for the significance of mean, skewness and for the normaly of the distributions of the sample daily log-returns.
A number of authors have proposed analysing portfolioson the basis of the first three moments of return distributions, rather thanthe traditional two moments (mean and variance introduced by Markowitz in 1952). The positive sign of the third derivative ofthe utility function ((Arrow, 1964), (Pratt, 1964)) gives tells us that investors’ risk aversion decreases as wealth increasesand, therefore, has cubic utility functions.
Arrow (1971) suggests that the most desirable properties for an investor’sutility function are (a) positive marginal utility for wealth, (b) decreasingmarginal utility for wealth and (c) decreasing absolute risk aversion.The first two conditions are consistent with mean-variance preference.Arditti(1967) has argued that condition (c) implies preference for positive skewness.
Important work about the type of empirical returns wasperformed byFama and Roll (1968) and Fama (1971). Also, a theoretical refference on thirdmoments was developed by Jean (1971), by addressing the question of skewnesspreference in a portfolio context.
Recently, Kearney and Lynch (2007) used daily returns on 6 international stock market indices from 1978 to 2002 in order to search for skewness in the tails, in different intervals and in the entire distribution and found very limited evidence of statistically significant skewness.
Tudor (2008) explored the power of the skewness coefficient in explaining stock returns on the Romanian equity market employing weekly observations for 31 common stocks traded on Bucharest Stock Exchange during 2000-2006 and found positive results.
Lucey et all (2006) showed that the incorporation of skewness as an objective in portfolio selection causes the optimal portfolio to change significantly from one formed only under conditions of meanvarianceanalysis.
Peiro (1999) addressed the symmetry of daily returns in eight international stockmarkets and three spot exchange rates. He showed that for his data the tests of symmetry with the sample skewnessseem of little value, due to the non-normality of the returns, butunder alternative nonnormaldistributions, the symmetry of the returns cannot be rejected for most markets.
Again Peiro (2001) examined the symmetry of twenty-four individual stock returns at different frequencies: daily, weekly and monthly. He found that while some asymmetries are observed indaily returns, they disappear almost completely at lower frequencies.
Machado-Santos and Fernandes (2005) used binomial and distribution free tests and found significant evidence of negative skewness in the Portuguese market during 1997-2002 period.
Brunner et all (2009) experimentally tested skewness preferences at the individual level. And found that the skewness of a distribution has a significant impact on the investment decisions.
Data and methodology
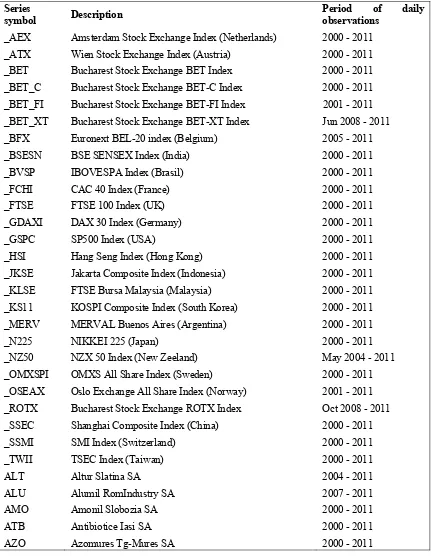
In our study we used daily prices from 21 international indices, 5 indices of the Bucharest Stock Exchange and 30 individual stocks traded on the Bucharest Stock Exchange. For the international indices the source of data was Yahoo Finance (www.finance.yahoo.com), while the date for the Romanian stocks and indices were obtained directly from the Bucharest Stock Exchange, courtesy of the Data Dissemination Department.
These exceptions are mentioned in the Table 1 presented below. We consider that this compromise is not significant and didn’t influence our conclusions.
Table 1: The financial time series used Series
symbol Description
Period of daily observations
BCC Banca Comerciala Carpatica SA 2004 - 2011
BIO Biofarm SA 2000 - 2011
BRD BRD - GSG 2001 - 2011
BRK SSIF Broker Cluj SA 2004 - 2011 CMP Compa Sibiu SA 2000 - 2011
COMI Condmag SA 2000 - 2011
DAFR Dafora SA 2000 - 2011
IMP Impact SA 2000 - 2011
ELMA Electromagnetica SA 2000 - 2011 OLT Oltchim Rm-Valcea SA 2000 - 2011 PTR Rompetrol Well Services SA 2000 - 2011 RRC Rompetrol Rafinare Constanta SA 2004 - 2011
SCD Sicomed SA 2000 - 2011
SIF1 SIF1 Banat-Crisana SA 2000 - 2011 SIF2 SIF2 Moldova SA 2000 - 2011 SIF3 SIF3 Transilvania SA 2000 - 2011 SIF4 SIF4 Muntenia SA 2000 - 2011 SIF5 SIF5 Oltenia SA 2000 - 2011 SNO Santierul Naval Orsova SA 2000 - 2011 TBM Turbomecanica SA 2000 - 2011 TEL Transelectrica SA 2006 - 2011
TGN Transgaz SA 2008 - 2011
VNC Vrancart SA 2004 - 2011
TLV Banca Transilvania SA 2000 - 2011 SNP OMV - Petrom SA 2001 - 2011
Regarding the returns estimation, as Strong (1992, p.353) pointed out “there are both theoretical and empirical reasons for preferring logarithmic returns. Theoretically, logarithmic returns are analytically more tractable when linking together sub-period returns to form returns over long intervals. Empirically, logarithmic returns are more likely to be normally distributed and so conform to the assumptions of the standard statistical techniques.” Precisely for this reason we decided to use logarithmic returns in our study since our objective is to test of whether the returns of the Romanian stock and indices during 2000 – 2011 were normally distributed or, instead, showed signs of asymmetry (skewness). The computation formula of the daily returns is as follows:
where Ri,t is the return of asset i in period t; Pi,t is the price of asset i in period t and Pi,t-1 is the
the assets must be adjusted for corporate events such as dividends, splits, consolidations and share capital increases (mainly in case of individual stocks because indices are already adjusted).
As a result of this initial data gathering we obtained 56 time series of log-returns, each with approx. 3000 daily observations.
Concerning the estimation of skewness, according to most authors a time series of financial asset returns is symmetric around it’s mean (noted here with µ) if:
where f is the density function of the returns. If this property is valid then the mean of the returns series coincides with its median.
The skewness of a data population is defined as the third central moment. To be more precise, skewness is computed as the average cubic deviation of the individual observations from the sample mean, divided by the standard deviation raised to the third power. As a consequence of these considerations, we have calculated the sample skewness as follows:
where is the sample skewness; N is the total number of individual observations within the sample, Rt is the return of period t, is the sample arithmetic mean and is an estimator for the
standard deviation that is based on the biased estimator for variance ( ), where the standard deviation is given by:
The skewness of a symmetric distribution, such as the normal distribution, is zero. Positive skewness means that thedistribution has a long right tail and negative skewness implies that the distributionhas a long left tail.
According to Peiro (1999), under normality hypothesis, the asymptotic distribution of is given by .
Results and interpretations
The first thing that we observe analyzing the data is that for 45 out of 56 of assets investigated we cannot reject the null hypothesis of zero mean of the sample daily returns over the 2000-2011 period. Still, it is very interesting that from the 5 Romanian indices investigated, three present mean sample returns that are significantly positive (at the 5% level). Also, 2 out of the 30 individual Romanian stocks studied present significant negative daily mean returns and 4 out of 30 present significant positive daily returns. From 21 the international indices studied for the period 2000-2011 only 2 present significant positive daily returns, while for all the other 19 indices we were not able to reject the hypothesis of zero mean returns.
distribution). All these 11 assets are Romanian assets: one index (ROTX) and 10 individual stocks. None of the 21 international indices appear to present significant skewness although most values are slightly negative.
[image:7.595.90.492.259.731.2]As shown below in Table 2, both tests of the normality of the distribution of sample returns during 2000-2011 that we have conducted (the Studentized-Range test and the Jarque-Bera test) indicate that none of the 56 assets studied present a normal (Gaussian) distribution. In such a context, where the sample returns don’t seem to conform to a normal distribution, a more complex analysis is needed in order to verify whether there is asymmetry in the data.
Table 2: Return statistics
Series N Mean
(in %) t-stat
Std. Dev. (in %)
Skewness Sk S.E. St-R Jarque-Bera
_AEX 2989 -0.0092% -0.7246 0.0069 0.0245 0.0448 12.30 3802.74
_ATX 2892 0.0089% 0.7122 0.0067 -0.2902 0.0455 14.44 6601.98
_BET 2898 0.0360% 2.4616 0.0079 -0.5053 0.0455 13.06 6110.21
_BET_C 2891 0.0256% 1.8644 0.0074 -0.5350 0.0456 20.40 24260.21
_BET_FI 2684 0.0501% 2.2116 0.0117 -0.1251 0.0473 11.07 2977.05
_BET_XT 855 -0.0257% -0.6991 0.0107 -0.5089 0.0838 9.58 857.99
_BFX 1552 -0.0098% -0.6048 0.0064 0.1600 0.0622 12.92 3456.70
_BSESN 2891 0.0164% 1.1878 0.0074 -0.1155 0.0456 16.26 4315.93
_BVSP 2891 0.0213% 1.3544 0.0085 -0.0643 0.0456 13.24 1522.98
_FCHI 2988 -0.0066% -0.5255 0.0069 0.1190 0.0448 12.66 2490.25
_FTSE 2963 -0.0019% -0.1790 0.0057 -0.0806 0.0450 14.09 3848.92
_GDAXI 2983 -0.0009% -0.0703 0.0071 0.1243 0.0448 11.03 1766.27
_GSPC 3019 -0.0022% -0.2044 0.0060 -0.1525 0.0446 14.73 6242.37
_HSI 2915 0.0016% 0.1162 0.0072 0.0110 0.0454 16.27 6286.14
_JKSE 2828 0.0240% 1.9207 0.0066 -0.6811 0.0461 12.14 4277.19
_KLSE 2874 0.0086% 0.8998 0.0051 -0.2201 0.0457 33.03 869185.20
_KS11 2868 0.0091% 0.6299 0.0078 -0.4093 0.0457 13.23 2055.04
_MERV 2880 0.0182% 1.0348 0.0094 -0.1602 0.0456 13.37 2682.09
_N225 2847 -0.0116% -0.8870 0.0070 -0.3707 0.0459 15.77 5200.25
_NZ50 1863 0.0042% 0.5384 0.0033 -0.3789 0.0568 14.00 1983.22
_OMXSPI 2733 0.0002% 0.0123 0.0065 0.0684 0.0469 10.70 1331.09
_OSEAX 2661 0.0141% 1.0654 0.0068 -0.5903 0.0475 12.02 3430.63
_ROTX 789 -0.0093% -0.2526 0.0103 -1.1287 0.0872 12.68 3087.56
_SSEC 2958 0.0067% 0.5190 0.0071 -0.0933 0.0450 11.49 2488.70
_SSMI 2961 -0.0013% -0.1243 0.0056 0.0911 0.0450 14.76 4119.56
_TWII 2867 -0.0026% -0.1999 0.0069 -0.2359 0.0457 10.42 714.01
ALT 1503 -0.0619% -1.3276 0.0181 0.1104 0.0632 11.27 797.87
ATB 2795 0.0196% 0.7499 0.0138 -0.3673 0.0463 9.92 6411.76
AMO 2594 -0.0159% -0.4027 0.0201 0.1103 0.0481 6.53 763.88
AZO 2748 0.0481% 1.4460 0.0174 -1.3681 0.0467 25.04 131989.50
BCC 1758 -0.0515% -1.8918 0.0114 -0.3367 0.0584 11.50 4912.83
BIO 2363 0.0084% 0.1009 0.0406 0.2151 0.0504 45.76 8278150.00
BRD 2533 0.0209% 0.6903 0.0152 6.3559 0.0487 42.04 7089361.00
BRK 1591 -0.0906% -1.9790 0.0183 -2.1014 0.0614 15.50 33666.87
CMP 2730 0.0272% 0.8999 0.0158 -0.4526 0.0469 14.22 6607.11
COMI 1248 0.1208% 0.7553 0.0565 0.0381 0.0693 18.81 46759.67
DAFR 1780 0.0255% 0.1466 0.0734 0.4441 0.0581 32.43 1905812.00
ELMA 2296 0.0167% 0.3408 0.0235 -6.5459 0.0511 25.30 1340663.00
IMP 2554 -0.0470% -1.2981 0.0183 -2.4815 0.0485 18.33 94268.74
OLT 2658 0.0492% 1.2440 0.0204 1.3308 0.0475 18.45 48503.15
PTR 2492 0.0168% 0.2578 0.0325 -30.3469 0.0491 44.16 171000000.00
RRC 1773 0.0066% 0.1945 0.0142 0.4581 0.0582 9.91 1265.69
SCD 2780 0.0288% 1.1098 0.0137 -8.0406 0.0465 32.88 6646394.00
SIF1 2848 0.0516% 2.0217 0.0136 -0.2789 0.0459 9.64 2873.11
SIF3 2836 0.0439% 1.6136 0.0145 -3.2254 0.0460 24.88 546528.10
SIF2 2849 0.0564% 2.1254 0.0142 -0.2634 0.0459 9.26 2639.46
SIF4 2832 0.0351% 1.4139 0.0132 -0.2075 0.0460 9.94 2965.16
SIF5 2836 0.0503% 1.9384 0.0138 -0.1601 0.0460 9.50 2547.85
SNO 1976 0.0384% 0.9071 0.0188 0.0594 0.0551 6.98 543.21
SNP 2374 0.0239% 0.9764 0.0119 -0.2607 0.0503 11.01 3512.21
TBM 2461 -0.0030% -0.0959 0.0155 -0.0934 0.0494 8.46 3096.99
TEL 1270 -0.0132% -0.4068 0.0116 0.0440 0.0687 11.00 1302.75
TGN 956 -0.0084% -0.2436 0.0106 -0.2264 0.0792 12.15 3620.56
TLV 2718 -0.0159% -0.5301 0.0156 -9.1025 0.0470 27.78 3489067.00
VNC 1473 -0.0159% -0.4251 0.0144 0.0599 0.0638 9.07 875.80
Conclusions
This study was dedicated to the issue of symmetry in financial assets returns on the Romanian capital market during the period 2000-2011.
In early financial studies, many authors and traditional methodologies used only the first two moments of the distributions (mean and variance) for pricing of the financial assets, assuming implicitly the normality of those distributions. Latter,a vast literature appeared suggesting that the inclusion of skewness and kurtosis in such valuation methods is useful since the third and fourth moments of the distribution are not negligible and therefore they are not ignored by investors and speculators.
international indices (both from developed and emerging markets) during the same period and confirm the recent studies of other authors for other markets, periods and asset groups.
Calculating the skewness of the distributions of the daily log-normal returns we found very few evidence of significant asymmetry, with only 10 individual Romanian stocks and 1 Romanian index presenting clearly negative skewness out of the 56 total assets studied. None of the 21 international indices presented clear evidence of skewness significantly different from zero. Still, we think that further analysis is required to clarify the issue of asymmetry because according to literature, the rejection of normality does not necessary imply the rejection of symmetry (Machado-Santosand FERNANDES, 2005). In this context a binomial distribution test and a distribution-free test such as Kruskal-Wallis test could be more suited.
Also, it would be interesting, as a piece of further research, to extend this study of skewness to a low frequency sample data such as the weekly and monthly returns for the same period.
References
AGGARWAL, R. – RAO, R. – HIRAKI, T. (1989): Skewness and Kurtosis in Japanese Equity Returns: Empirical Evidence. The Journal of Financial Research, vol. 12, 1989, no. 3, pp. 253–260.
ARDITTI, F. (1967): Risk and the Required Return on Equity. Journal of Finance, vol. 22, 1967, no. 1, pp. 19–36.
ARDITTI, F. – LEVY, H. (1975): Portfolio Efficiency and Analysis in Three Moments: The Multiperiod Case. Journal of Finance, vol. 30, 1975, no. 3, pp. 797–809.
ARROW, K. (1964): The Role of Securities in the Optimal Allocation of Risk-Bearing. Review of Economic Studies, vol. 31, 1964, pp. 91–96.
ARROW, K. (1971): Essays in the Theory of Risk Bearing. Markham Publishing Company, Chicago, 1971.
BASCI, S. – ZAMAN, A. (1998): Effects of Skewness and Kurtosis on Model Selection Criteria. Economic Letters, vol. 59, 1998, no. 1, pp. 17–22.
BEKAERT, G. – ERB, C. – HARVEY, C. – VISKANTA, T. (1998): Distributional Characteristics of Emerging Market Returns and Asset Allocation. Journal of Portfolio Management, vol. 24, 1998, no. 2, pp. 102–116.
BRUNNER, T., LEVINSKI, R. and QIU, J. (2009): Skewness preferences and asset selection: An experimental study. Working Papers in Economics and Statistics, University of Innsbruck, vol. 2009-13, 2009.
CHUNHACHINDA, P. – DANDAPANI, K. – HAMID, S. – PRAKASH, A. (1997): Portfolio Selection and Skewness: Evidence from International Stock Markets. Journal of Banking and Finance, vol. 21, 1997, pp. 143–167.
FAMA, E. (1971). Risk, Return, and Equilibrium. Journal of Political Economy, vol. 79, 1971, no. 1, pp. 30–55.
FAMA, E. – ROLL, R. (1968): Some Properties of Symmetric Stable Distributions. Journal of the American Statistical Association, vol. 63, 1968, pp. 817–836.
FERNANDES, A. – MACHADO-SANTOS, C. (2002): Evaluation of Investment Strategies with Options.
International Journal of Business and Economics, vol. 2, 2002, no. 1, pp. 282–293.
FERNANDES, A. – MACHADO-SANTOS, C. (2005): Skewness in Financial Returns: Evidence from the Portuguese Stock Market. Finance a úvĦr – Czech Journal of Economics and Finance, vol.55, 2005, no. 9-10, pp. 460–469.
GUJARATI, D. (1995): Basic Econometrics. 3rd Edition. McGraw-Hill International Editions, New York, 1995.
JEAN, W. (1971): The Extension of Portfolio Analysis to Three or More Parameters. Journal of Financial and Quantitative Analysis, vol. 6, 1971, no. 1, pp. 505–515.
KANJI, G. (1995): 100 Statistical Tests. 1st Edition. SAGE Publications, London, 1995.
KEARNEY, C., LYNCH, M. (2007): Are International Equity Markets Really Asymmetric? Applied Financial Economics, vol. 17, 2007, no. 5, pp. 399-411.
KRAUS, A. – LITZENBERGER, R. (1976): Skewness Preference and the Valuation of Risky Assets.
KRAUS, A. – LITZENBERGER, R. (1983): On the Distributional Conditions for a Consumption-Oriented Three Moment CAPM. Journal of Finance, vol. 38, 1983, no. 5, pp. 1381–1391.
LELAND, H. (1999): Beyond Mean-Variance: Performance Measurement in a Nonsymmetrical World. Financial Analyst Journal, vol. 55, 1999, no. 1, pp. 27–36.
LEVY, H. – SARNAT, M. (1972): Investment and Portfolio Analysis. John Wiley & Sons Inc., New York, 1972.
LINTNER, J. (1965): The Valuation of Risky Assets and the Selection of Risky Investments in Stock Portfolios and Capital Budgets. Review of Economics and Statistics, vol. 47, 1965, no. 1,pp. l3–37.
LUCEY, B., TULLY, E., POTI, V. (2006): International Portfolio Formation, Skewness and the Role of Gold. Frontiers in Finance and Economics, vol. 3, 2006, no. 1, pp. 49-68.
MARKOWITZ, H. (1952): Portfolio Selection. Journal of Finance, vol. 8, 1952, no. 1, pp. 77–91.
MARKOWITZ, H. (1959): Portfolio Selection Efficient Diversification of Investments. John Wiley & Sons Inc., New York, 1959.
MARKOWITZ, H. (1991): Foundations of Portfolio Theory. Journal of Finance, vol. 46, 1991, no. 2, pp. 469–477.
PADUREANU A. (2011): Rational Option Pricing Theory's Feasibility Testing During the Current Financial Markets's Conditions. Case Study: American Index Options, Studii si Cercetari de Calcul Economic si Cibernetica Economica, vol. 45, 2011, nr. 1-2, pp.153-173.
PEIRÓ, A. (1999): Skewness in Financial Returns. Journal of Banking and Finance, vol. 23, 1999, pp. 847– 862.
PEIRÓ, A. (2001): Skewness in Individual Stocks at Different Frequencies. IVIE working papers, 2001,
Instituto Valenciano de Investigaciones Economicas, WP-EC 2001-07: V-1486-2001
PRATT, J. (1964). Risk Aversion in the Small and in the Large. Econometrica, vol. 32, 1964, no. 1-2, pp. 122–136.
RUBINSTEIN, M. (1973): The Fundamental Theorem of Parameter Preference Security Valuation. Journal of Financial and Quantitative Analysis, vol. 8, 1973, pp. 61–69.
RUBINSTEIN, M. (1976): The Valuation of Uncertain Income Streams and the Pricing of Options. Bell Journal of Economics and Management Science, vol. 7, 1976, no. 2, pp. 407–425.
SAMUELSON, P. (1970): The Fundamental Approximation of Theorem in Portfolio Analysis in Terms of Means, Variances and Higher Moments. Review of Economic Studies, vol. 37, 1970,pp. 537–542.
SHARPE, W. (1966): Mutual Fund Performance. Journal of Business, vol. 39, 1966, no. 1, pp. 119–138.
STRONG, N. (1992): Modelling Abnormal Returns: A Review Article. Journal of Business Finance and Accounting, vol. 19, 1992, no. 4, pp. 533–553.
TSIANG, S. (1972): The Rationale of the Mean-Standard Deviation Analysis, Skewness Preference and the Demand for Money. American Economic Review, vol. 62, 1972, no. 3, pp. 341–360.
TUDOR, C. (2004): Testarea puterii coeficientului de asimetrie ca sursa de risc la Bursa de Valori Bucuresti.