Munich Personal RePEc Archive
Fiscal Scenario of South Asian Countries:
Implications for Economic Growth and
Poverty Alleviation
Akram, Naeem
Research Officer at Centre for Poverty Reduction and Social Policy
Development, Islamabad
23 November 2010
Online at
https://mpra.ub.uni-muenchen.de/29103/
Fiscal Scenario of South Asian Countries:
Implications for Economic Growth and Poverty
Alleviation
Naeem Akram
1Sustainable economic growth and Poverty alleviation is a principal objective of the
developing countries. The present study aims to historically review of fiscal policy and its
consequences for the economic development of the four South Asian economies i.e. Pakistan,
India, Sri Lanka and Bangladesh. Confined revenues and savings coupled with rising
expenditures have caused situation of persistent fiscal deficit over the years. Coupled with that
countries are also facing current account deficit. Resultantly, ‘Twin Deficit problem’ emerged, and it is filled by public deb. Consequently countries have to spend considerable portion of their
GDP on interest payments of the loans. The need to service debt obligation is undermining
economic performance and resulting in collapse of development planning. Because debt
obligations and expenditure on debt servicing become a resource drain for already limited
revenues and is halting economic growth and poverty reduction efforts.
Key words: Fiscal Policy, Poverty, Economic growth
JEL Classification: H63, I32, O43
1
Research Officer at Centre for Poverty Reduction and Social Policy Development, Islamabad Email: naeem378@yahoo.com, Tel: +92-333-5343163
A sound fiscal position is a critical ingredient of sustainable economic growth and poverty
reduction and is an essential pre-requisite for achieving macroeconomic stability. Better fiscal
management helps to mobilize domestic savings, increase efficiency of resource allocation and
achieve other worthwhile development goals. On the other hand, lax fiscal policy limits options
open to the government for economic recovery, sustainable growth and poverty alleviation. It
may lead to higher rates of interest and inflation and crowding out of private investment.
Most of the Asian economies have relied on debt and other foreign resources to stimulate
economic growth, lower poverty and reduce income inequality. Malaysia and Thailand are
considerable success stories, whereas in Pakistan and Bangladesh unacceptable size of domestic
and foreign debt has pre-empted such opportunities. This paper pinpoints the role of fiscal policy
in general and public debt in particular for economic growth and poverty reduction. It is worth
mentioning that public debt and other components of fiscal policy are interrelated; therefore, it is
very important to keep the overall fiscal situation in view while analyzing the consequences of
public debt situation. The objective of the study is to highlight major issues regarding the public
debt and fiscal scenario in selected developing countries.
This paper is divided into six different sections: first section gives a brief introduction of
the South Asian countries; the second one deal with the issue of public expenditure and its
composition. The third section offers a brief description of the resource availability in these
countries, while section four highlights issues related to large public deficits. The fifth section
relates to the problems of public debt, its structure and implication for overall economic
1.
A Bird’s Eye View of Selected Developing Countries
It will be useful to begin this section by giving a synoptic view in a tabular form of state
of the four South Asian economies, economic performance to compare the state of their
economies in years 1990 and 2006. Each of the entries below is then explained in detail.
However, let us note in Table- 1 a few striking facts about the relative performance of these
countries over these periods. Firstly, per capita GDP growth has been the highest in India and
lowest in Sri Lanka. Secondly, population growth rate has fallen the most in India and least in Sri
Lanka. Thirdly, export/ GDP ratio has risen the most in the Bangladesh but has actually fallen in
Pakistan. Fourthly, surprisingly GINI Coefficient is the highest in Sri Lanka and the least in
Pakistan the least in Pakistan, revealing that Pakistan is the least unequal countries in the region
and the Sri Lanka the most. Fifthly, life expectancy has raised the most in Sri Lanka and the least
in Bangladesh. Sixthly, infant mortality rate is the lowest in Sri Lanka but the highest in
Pakistan, although it has fallen over the years.
Lastly, secondary school enrolment is the highest in Sri Lanka and the lowest in Pakistan,
even lower than Bangladesh. Taken together, it can be surmised that India has gone the farthest
in terms of GDP growth and the Sri Lanka the most in Human Development terms. On the other
hand, Pakistan and Bangladesh compete for the least- well position in Human Development
terms. Macroeconomic stability-wise (in terms of inflation rate) Sri Lanka is the most vulnerable
and India the least. We may now proceed with a country wise explanation of the absolute
Table 1
Main Indicators of selected countries
Indicators Years Pakistan Bangladesh India Sri Lanka
Per capita GDP growth rate 1990 1.84 3.53 3.42 5.20
2006 4.75 4.78 7.70 6.18
%
Change 157.88 35.27 125.07 18.78
Population growth rate 1990 2.54 2.30 2.02 1.13
2006 2.05 1.75 1.38 1.10
%
Change -19.29 -23.91 -31.68 -2.65
Inflation 1990 9.05 6.13 8.97 21.50
2006 7.92 6.77 5.80 13.69
%
Change -12.49 10.44 -35.34 -36.33
Exports as % of GDP 1990 15.54 6.12 7.13 30.18
2006 15.29 18.97 22.97 31.62
%
Change -1.58 222.06 209.92 4.77
GINI Coefficient (in percentage)
1990 40.70 28.66 29.69 30.10
2006 31.44 33.31 37.12 36.27
%
Change -22.74 16.22 25.03 20.51
Life expectancy 1990 59.10 54.79 59.13 71.17
2006 65.21 63.66 64.47 74.97
%
Change 10.34 16.18 9.04 5.34
Infant Mortality rate (per 1,000 live births)
1990 100.00 100.00 80.00 25.60
2006 77.80 51.60 57.40 11.18
%
Change -22.20 -48.40 -28.25 -56.33
Secondary school enrolment 1990 25.14 20.18 44.48 76.83
2006 30.01 43.77 54.63 87.18
%
Change 19.38 116.91 22.82 13.47
Source: World Development Indicators; Poverty Network database; World Development Bank
(a) Bangladesh
As per the gradation of the IMF, Bangladesh had a GDP of only USD 225 billion in 2008,
ranking 48th among the countries of the world. The colonial economic system was disturbed by
the partition of British India in 1947. In the colonial economic system East Bengal (presently
Pakistan has had to build from a scratch, regarding the development of industrial infrastructure
and to modernize the agriculture in view of the population explosion. Although the cultivated
area and irrigation facilities were extended by the central government of Pakistan: but the
incidence of rural poverty increased during 1947-71 because of the increasing rural population,
the improvements did not able to keep pace. Bangladesh emerged as an independent state in
1971, and it slowly resumed process of economic growth, though badly shattered by a famine in
early 1970s; which incidentally was the first such event after the Bengal Famine that occurred in
British India. Bangladesh showed a steady economic growth over the years, recovering only
gradually from the dismal growth performance during 1970s and 1980s, when per capita GDP
growth rate was on average only 0.8%. The slow economic growth in comparison with
population growth resulted in accelerating poverty in Bangladesh. However, since the mid 1980s
there have been encouraging signs of growth. But it was only during 1990‘s that economic
fundamentals were based on surer foundations. Economic policies aimed on reinstating
budgetary discipline, liberalizing the trade policies, privatizing public enterprises, and
encouraging the private enterprises and investment to some extent paid dividends. However,
public corruption has severely hurt the efforts to achieve macroeconomic goals. Over the years,
accelerated poverty is the single most important challenge facing Bangladesh, notwithstanding
the isolated but heroic efforts of the civil society, led by the Grameen Bank to put paid to this
dangerous process. It is estimated that approximately half of the population lives in absolute
poverty. Similarly, according to World Bank‘s estimates approximately 10-15 percent of the
population is facing serious nutritional threat, similarly it is also estimated the food security for
45 percent of the Bangladesh‘s population is at stake. The economic and social challenges facing
(b)India
With a GDP of approximately USD 1 trillion in 2008, in the South Asian region, at least, it is
the most diverse economy, better able to absorb internal as well external shocks. Since
independence in 1947, the Indian economic policies have tended towards state intervention in
financial and labour markets, protectionism, import-substituted industrialization, huge public
sector, central planning and business regulations. During the period of 1947-90, the India's low
average growth rate---referred to derisively as the ‗Hindu rate of growth‘ held up India‘s
emergence as an economic powerhouse. The collapse of Soviet Union (India's major trading
partner) coupled with sharp spike in oil prices in the aftermath of first Gulf War caused a severe
balance-of-payments crisis in India. In 1990, it forced India to obtain a bailout loan from the IMF
amounting to USD1.8 billion: which demanded reforms in various sectors. In response, during
1990s economic reforms were initiated by the Indian government. Success of these reforms has
motivated Indian government to introduce another cycle of reforms. Consequently, in 2005
various other reforms were introduced in industry, trade, investment, capital and financial
sectors. This has opened up almost all areas of economy to domestic as well as foreign private
investment. Apparently, at least, these reforms have had a remarkable uplifting effect on the
economy. Whatever the causative factors and there is a sharp divergence of opinion about them,
the fact is that India has emerged as one of the fastest-growing economies of the developing
world. Economic growth in India has been accompanied by increases in literacy rates and life
expectancy and food security; however, poverty remains a major concern. Although during
1970-97, the proportion of population living below the poverty line has declined from 50 percent
to 35 percent. Still in the terms of absolute number of poor, these efforts are not sufficient, due to
In 2004 by using USD 1.25 per day approximately 36% of the urban population and 44% of rural
population, is living below the poverty line.
(c)Pakistan
Pakistan has a per capita income of USD 1,085 per annum in purchasing power terms; but it
also has a population of 160.9 million, which is relatively young. This is both an opportunity to
progress if the manpower is harnessed with scientific knowledge and skills, but it would be a net
burden if this is not done. Unfortunately, the latter seems to have been the case over the years,
which has resulted in a less than optimal human capital formation. Partly due to this and also
because of the external shocks, and internal lack of political stability over the years, the economy
has suffered economic setbacks. A lack of fiscal discipline has been among the causes of its
economic social and political discontent. In 2000, substantial macroeconomic reforms were
launched that resulted in improving GDP growth, enabling Pakistan to grow at 6-8% range
during 2004-06; and in reducing the burden of public debt. In 2005, by the World Bank Pakistan
was named ‗top reformer‘ in the region and firmly placed it in the league of the world‘s top ten
reformers. However, since 2007 Pakistan‘s role in the war on terror has resulted in great
political, economic and social instability. Concurrently, a massive capital flight from Pakistan to
Gulf has occurred, and the flow of FDI has sharply declined. In addition, different agencies have
lowered Pakistan‘s rating for foreign currency debt substantially (just above the level of default).
In Pakistan Poverty in urban areas has declined until 1970, but thereafter it increased in rural
areas: leading to a rise in overall poverty in Pakistan. However, during 1970-88 poverty
declined in both in urban and rural areas. During 1990s, Pakistan faced sluggish economic
growth, macroeconomic instability and debt crisis. Consequently, the incidence of poverty is
in 2001, thereafter it started to decline and in 2005, it reduced to 23.9 % and in next years to 22.3
%. However, reduction in poverty in that rapid fashion is rather controversial, lot of questions
have been raised on authenticity of the data of Pakistan Social and Living Standards
Measurement (PSLM 2004-05).
(d) Sri Lanka
With a GDP of approximately USD 27.4 billion in 2006, Sri Lanka is also one of the major
economies of South Asia. Since becoming independent from Britain in 1948, Sri Lankan
economy has been affected by political unrest and natural disasters e.g., insurrections of 1971,
1987-89, the civil war of 1983-2009 and Indian Ocean earthquake of 2004. Civil conflict in
north and east of Sri Lanka has severely affected the pace of Sri Lankan economic growth. It can
be seen that during 1970s its per capita GDP growth was on average 5.6% and due to civil war in
1980s it fell down to only 1.6%. However, in spite of the impacts of civil war, economic growth
has improved during 1990s and per capita GDP at an average rate of 4% in 1990s and 4.9% in
2005. Moreover, most strikingly, notwithstanding all obstacles, its record in human development
is world class. But what casts doubt on its long-run growth rate and even human development,
are the ruling political parties‘ failure to implement a consistent national policy, constantly
veering between right and left wing economic practices. All this has badly affected the country‘s
efforts for economic growth and poverty alleviation. Indeed, in 2001 pubic debt reached at 101%
of GDP and GDP growth rate slipping down to -1.4% and Sri Lanka faced bankruptcy. The crisis
has exposed fundamental structural imbalances and policy failures and need for bold reforms.
Hence, country economic managers initiated the policies of social and economic reforms,
deregulation and private sector development. As a result, after 2002, Sri Lanka has commenced a
dividend will be visible throughout the economy—enabling the country to reduce defence
expenditures and to focus on bringing the large public debt under control. But, macroeconomic
stability has been threatened by the high rates of inflation. And, notwithstanding its luminous
record in human development, approximately one-third of the population is categorized as poor,
according to the Asian bank‘s report. However, if we consider poverty line as USD 1.25 per day
per person then in 2002 approximately only 14% of population in Sri Lanka lives below the
poverty line, and these figures are also lowest among the selected developing countries. It is
worth mentioning here that in Sri Lanka, poverty is mainly a rural phenomenon, as
approximately 7 percent in urban areas, 85 percent in rural areas, and 6 percent belongs to estate
sectors are living below the poverty line.
The Fiscal Characteristics of the Selective South Asian Countries
2.
Public Expenditure
In market economies government uses public expenditure as an effective instrument of
public policy. There are certain sectors of economy--- e.g., public utilities, infrastructure, or
where external economies are compelling--- wherein due to one reason or the other private sector
is reluctant to invest or restrained by the government to operate effectively. Public expenditure
also reveals the preferences of government for public goods, and it is used to create effective
demand in the market to ensure its smooth functioning. However, theoretically as well as
empirically, the impact of public expenditure on private initiative to make investment and on
economic growth remains a matter of debate in academic circles and public discourse. There is
the view associated with the neo-classical understanding of the real world that a large size of
conventional wisdom has not been supported by empirical studies. 2 Also, the Great Recession
has shifted public policy from the unregulated role of the market to a large government role.
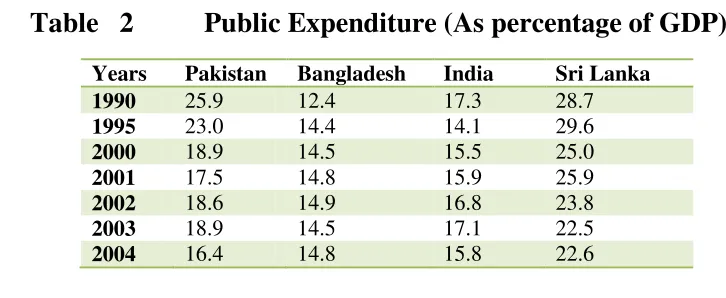
Table 2 depicts trend of public expenditure as percentage of GDP in South Asian
countries. Among the sample countries total expenditure-to-GDP ratio has been the highest in Sri
Lanka, where the concern of the government with social welfare---especially with respect to
providing education and access to health services---has been most evident. Total
expenditure-to-GDP ratio for Sri Lanka was 25.3% per annum in 1975 and it was on the average 32.5% during
1980s. However, after the 1990s, the government came to believe, or was made to believe, more
and more in the efficacy of the market (mainly under the influence of market reforms), so that by
2007, the ratio declined to 23.2%. However, in comparison with other countries it still remains
the highest. Pakistan had an average expenditure to GDP ratios. India and Bangladesh have the
lowest ratios: In India, total expenditure was only 11.3% of GDP in 1970s and was on average
15.3 % during 1980s and in 2007 a mere 15.1%. In Bangladesh, the situation has been even
worse: in 1995, public expenditure was 12.4% of GDP. Since then it has slightly increased to
14.3% of GDP in 2007.
Table 2
Public Expenditure (As percentage of GDP)
Years Pakistan Bangladesh India Sri Lanka 1990 25.9 12.4 17.3 28.7
1995 23.0 14.4 14.1 29.6
2000 18.9 14.5 15.5 25.0
2001 17.5 14.8 15.9 25.9
2002 18.6 14.9 16.8 23.8
2003 18.9 14.5 17.1 22.5
2004 16.4 14.8 15.8 22.6
2Empirical studies have yielded conflicting results: Devarajan (1996), Ghura (1995) supports the hypothesis that a
[image:11.612.78.441.503.652.2]2005 18.0 15.0 14.1 23.8
2006 18.7 14.7 14.1 24.2
2007 19.3 14.3 15.1 23.2
Source: Key indicators of Asia & Pacific; Asian Development Bank 2008
The Composition of Public Expenditure:3 Not only the total size but also the composition of
public expenditure is very important because different components of expenditure exercise a
different impact on growth and development and social welfare, and also because changes in its
composition is an important determinant of the efficiency in resource allocation.
In Pakistan, during 2007, administrative expenditure accounted for 46% of total
expenditure, while the collective share of debt servicing and defense was approximately 38%.
Consequently, the government has very little room available for expanding social sector and
development expenditure: indeed, not more than 3% of total expenditure has been spent on
education and health, which is lowest among the selected developing countries---which also
explains why Pakistan‘s performance in human development terms has been dismal. A roughly
similar pattern of public spending exists in India: administrative expenditure was 37%, while
defense expenditure and debt servicing were 13% and 20% of total public expenditure in 2007.
This scenario has contributed to a net shrinkage in the share of social spending: India has on
average spent only 6% of total public expenditure on health and education, slightly higher than
Pakistan but far below from other developing countries.
In sharp contrast, in Sri Lanka, administrative expenditure has been around a mere 7%,
and defense spending and debt servicing 12% and 22% of total public expenditure respectively.
This has left lot of room for the Sri Lankan economic managers to allocate higher amounts to
3
development and social sectors. No wonder, therefore, that Sri Lanka‘s social spending has been
the highest in the region. The expenditure on education and health has on average been 11% and
8% of total public expenditure, and the expenditure on subsidies and economic affairs etc. makes
a major part (40%) of total public expenditure. Their achievement on the human development
scale has therefore been impressively high---in some ways, it is now of the First World
standards.
Surprisingly, among selected countries, Bangladesh is having highest ratio of expenditure
on education and health: it has allocated 17% and 7% respectively of the total public expenditure
to these heads in 2004. The expenditures on public administration (22%), defense (10%) and
debt servicing (15%) have been moderate as compared to India and Pakistan.
The low allocation of expenditure to development and social sectors has adversely
affected economic growth in selected countries via three channels. Firstly, reductions in social
spending on health and education have stunted the development of human capital, which is a
prerequisite for sustainable economic growth. Secondly, cuts in public investment, especially in
infrastructure have created bottlenecks in economy and increased the cost of doing business.
Thirdly, the low share of development expenditure also resulted in discouraging private
investment. Whatever it is, a sharp increase in social spending is necessary to ensure a better
quality of life, especially for the poor.
3.
Public Revenue
To finance public expenditure, government collects revenue from various sources in a
way that is equitable, which improves social welfare and does not distort the structure of price
revenue) is low by international standards. According to the World Bank estimates in
developing countries, revenue collection, on average, forms only 13% of GDP during 2004.
Ineffective tax systems, an expanding shadow economy, shifting profits to low-tax jurisdictions,
capital flight to tax havens, trade liberalization and tariff reductions are some of the major
reasons for low revenue collection.4
Tax revenue generally is the major source of total public revenue. It measures the
willingness of the government and the people to bear the burden of development effort and to
[image:14.612.108.469.310.514.2]ensure a minimum degree of equity.
Table 3
Tax revenue (As % of GDP)
Countries 2004 2005 2006
Pakistan 10.3 9.6 9.5
India 9.8 10.4 10.7
Sri Lanka 13.9 14.2 15.3
Philippines 12.4 13.0 14.3
Bangladesh* 8.5 8.6 8.7
France 22.2 22.4 22.7
United Kingdom 27.2 27.9 28.8
Italy 21.6 21.3 22.9
Norway 28.0 29.0 29.2
Data Source: World Development Indicators 2008, CD-ROM * Publications of Asian development bank
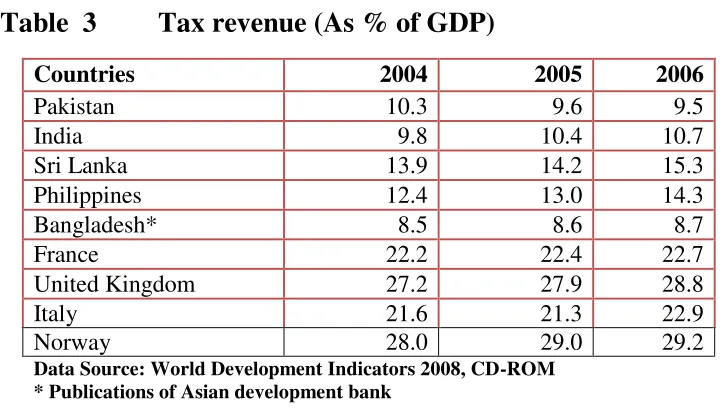
Table 3 above gives a comparative picture of the tax-GDP ratios in both the developed
and the developing countries. It also indicates the directions in which the developing countries
must move: the tax/GDP ratios should in the long run be raised by about three times over their
present level in the long run----from the 8.7% (Bangladesh),15.3% (Sri Lanka) range at present
to the 22.7(France), 29.2(Norway). The difference is also a reflection of the level of social
responsibility in the developing and the developed countries.
4
Like public expenditure, tax revenue collection has been the highest in Sri Lanka and the
lowest in Bangladesh. In Sri Lanka, during 1970s, tax revenues were on average 18% of GDP,
and this ratio persisted in 1980s. During the 1990s, the tax/GDP ratio started to decline and in
2007 it, for various reasons (presumably civil war and other exogenous disturbances) became
only 14.2% of GDP. This is an unfortunate development and has largely been responsible for
lower allocations to health and education. It is also surprising because IMF-led reforms generally
require raising the tax/GDP ratio. Since 1970s, in India, the tax revenue/GDP ratio has remained
in the narrow range of 6-10% of GDP but in 2007 the ratio was 9.2%. As noted above,
Bangladesh has had the least tax revenue collection but over time a conscious effort has been
made to raise this ratio: from a mere 5.8 % of GDP in 1990, the ratio rose to a more respectable
figure of 8.7 % of GDP in 2006. This is creditable, considering all the difficulties it has faced in
the last two decades or so. But a lot of ground has to be covered to reach a sustainable level of
tax revenue collection.
By world standards, Pakistan has had a very narrow tax base, grossly inadequate
tax-to-GDP ratio and low elasticity of tax revenue with respect to tax-to-GDP growth rate. Tax revenues were
on average 13.7% of GDP during 1980s, but regrettably, this ratio was reduced to 13.1 % in
1990‘s. This declining trend persisted and in 2006, tax revenues reached only 9.5% of GDP.
Consequently, even with good growth performance, low tax collection has forced the
governments to rely on loans for financing of deficit. In this the scandalous unwillingness of the
affluent class, especially of the landlords, in Pakistan to contribute to the tax effort has played a
large role. To increase tax revenue, during 2001, the government made a somewhat serious effort
has since then taken numerous steps to broaden the tax base. However, unfortunately, as a
percentage of GDP, these tax reforms have proved to be a failure.
4.
Public Deficit:
Public deficits can arise for a variety of reasons: either when liabilities exceed assets, or if
expenditures exceed incomes or if imports exceed exports, or if losses exceed profits. To meet
any of these situations the government must indulge in some kind of deficit financing. It may be
of interest here to distinguish between a fiscal deficit and a current account deficit.
i.
Fiscal Deficit:
When the governments‘ total expenditure exceeds total revenue then a fiscal deficit
emerges. Fiscal deficits have attracted greater attention all over the world after the Second World
War, to meet the inadequacy of effective demand that held back economy growth during the
Great Depression. However, for more than one reason, it has become a permanent feature in the
developing countries for financing economic growth and employment creation. But heavy doses
of fiscal deficit have also created problems of macroeconomic instability.5 The general belief
held by the government, especially those under the IMF vigilance, is that reducing fiscal deficit
will always result in better economic conditions. However, experience suggests that this need not
necessarily be so. If a reduction in fiscal deficit is achieved by reduced expenditure especially by
reducing development expenditure, rather by an expansion in revenue collection, then the
long-run impact of a reduction in fiscal deficit may indeed be negative for economic growth, which
may impede generation of public revenues for financing government expenditure
5
.
Table 4:
Fiscal Imbalances (As percentage of GDP)
Pakistan Bangladesh India Sri Lanka 1990 -6.5 -5.7 -6.6 -7.9
1995 -5.6 -2.2 -4.2 -8.8
2000 -5.4 -4.5 -5.7 -9.3
2001 -3.3 -4.1 -6.2 -10.2
2002 -2.4 -3.7 -5.9 -8.2
2003 -1.2 -3.4 -4.5 -7.3
2004 -1.8 -3.4 -4.0 -7.5
2005 -4.2 -3.7 -4.1 -7.0
2006 -3.7 -3.3 -3.4 -7.0
2007 -4.0 -3.3 -3.1 -6.9
Source: Key indicators of Asia & Pacific; Asian Development Bank 2008
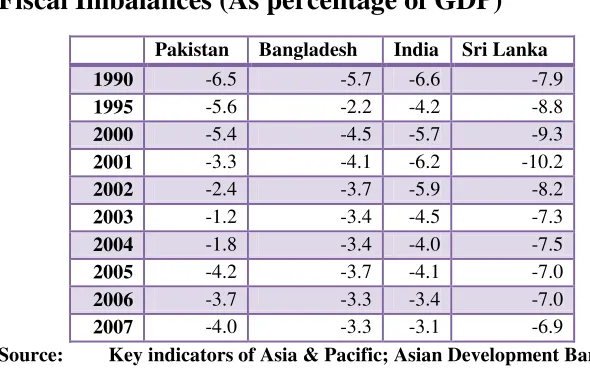
It can be seen from the table that fiscal deficits are the general rule rather the exception.
Even if the sunshine of fiscal surplus ever dawns, it lasts only for a short time. In Sri Lanka,
fiscal deficits have been the most severe in comparison with other countries. During the 1970s,
fiscal deficit was on average -7.5% of GDP and increased to -11.1 % of GDP in 1980s.
However, since 1990 fiscal deficit has started to decline mostly under the pressure of the IMF
and was -6.9 % of GDP in 2007. The main causes of these deficits have been: (a) huge defense
expenditure incurred to fight the Civil war, and (b) large debt servicing liabilities. It is hoped that
with the ending of the Civil War the defense expenditure will be reduced and the country will
enjoy better fiscal situation.
Pakistan, India and Bangladesh have also faced fiscal deficits over the years, yet the
problem has been somewhat less acute, though not less alarming, than in Sri Lanka. In Pakistan,
during the 1970s, the fiscal deficit remained, on average, 8.0% of its GDP; but that was because
of the very severe shocks caused by the 1971 war (which culminated in the separation of East
cumulative fiscal effect of these cataclysmic events was a severe resource crunch in government
and a sharp rise in government expenditure. Later on, during 1980s, fiscal deficit was reduced to
7.1 % of GDP. During the 1990s, government has tried its level best to bring fiscal deficits down
to 4% of the GDP, as part of its obligations under the IMF‘s structural adjustment program; but it
succeeded only to bring it down to 6.9% of GDP. In 2003 it became only 1.2% of GDP, only to
start rising once again.
In India, fiscal deficit was as high as 6.6 % of GDP in 1990, but thereafter India has been
able to bring down it to only 3.1% of GDP in 2007. The main factor behind this reduction in
fiscal deficit is reduction in the public expenditure from 17.3% of GDP in 1990 to 14.1 % of
GDP in 2006. The revenues remained almost stagnant 10.7% of GDP in 1990 and 10.6% of GDP
in 2006. Contrary to that trend, Bangladesh has achieved the reduction in fiscal deficit by means
of greater revenues. During 1990, the fiscal deficit there was 5.7 % of GDP that was reduced to
3.3% of GDP in 2007. During the same period revenues increased from 6.8% of GDP to 10.6 %
of GDP and expenditures from 12.4 % of GDP to 14.3% of GDP.
ii.
Current Account Deficit:
When country‘s total imports of goods, services and transfers exceed exports of goods,
services and receipts, then current account deficit emerges. Achieving current account balance
becomes very critical for those developing countries that also face a fiscal deficit. If there is
surplus in current account, it can help finance the deficit in fiscal account, without resorting to
deficit financing or public borrowing. However, if the fiscal deficit is accompanied by the
current account deficit ---the ―twin deficit problem‖--then the fiscal situation needs to be fixed
results in crowding out of private and public investment. Because country‘s overall financing
constraint becomes binding, as fiscal deficits feeds the current account deficits and it becomes a
part of the public debt problem. None of this can be allowed to last for long and remedial action
becomes necessary.
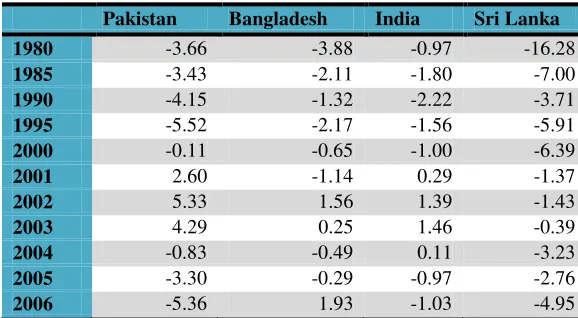
Table 5 presents a comparative picture of current account imbalances in Pakistan, India, Sri
Lanka, and Bangladesh. It reveals that all these countries have had to face current account
deficits. Once like fiscal deficits current account deficits also have been the rule rather than the
[image:19.612.159.448.380.539.2]exception. There have been brief periods of reprieve:
Table 5: Current Account Imbalances (As percentage of GDP)
Pakistan Bangladesh India Sri Lanka 1980 -3.66 -3.88 -0.97 -16.28
1985 -3.43 -2.11 -1.80 -7.00
1990 -4.15 -1.32 -2.22 -3.71
1995 -5.52 -2.17 -1.56 -5.91
2000 -0.11 -0.65 -1.00 -6.39
2001 2.60 -1.14 0.29 -1.37
2002 5.33 1.56 1.39 -1.43
2003 4.29 0.25 1.46 -0.39
2004 -0.83 -0.49 0.11 -3.23
2005 -3.30 -0.29 -0.97 -2.76
2006 -5.36 1.93 -1.03 -4.95
Source : World Development Indicators, World Bank
Pakistan also enjoyed a surplus in 2001, 2002 and 2003; but the honeymoon soon ended and
since 2004, the deficit situation has again reared its head. In 2006 its current account deficit was
-5.4 % of GDP and the highest among the selected countries. It has been caused mainly by the
[image:19.612.159.451.381.540.2]and electricity crisis etc. India was also able to get out of the deficit in 2001 but it once again fell
into a deficit situation in 2005. However, it has succeeded to cap the deficit around -1 % of GDP.
In Sri Lanka, the current account deficit was -16.3 % of GDP in 1980, but it could reduce it. In
2006 current account deficit became only -4.9 % of GDP, though relatively higher than the
previous year figure of -2.8 % of GDP. As for Bangladesh, the current account deficit has
remained under control and in 2006 it enjoyed a surplus of 1.9 % of GDP. It should be obvious
that in these countries the problem of twin deficits is a real one and has to be faced on an urgent
basis by a combination of domestic resource mobilization and export expansion (together with
efficient and creative import substitution in areas where long-run comparative advantage either
exists or can be created).
5.
Public Debt
Public debt refers to borrowing by a government from inside or outside the geographical
boundaries of a country over a period covering its entire history. There is a small distinction to
be made between public debt and deficit of a country. Debt is referred as a stock variable while
deficit is a flow variable. Accumulation of deficit over the years adds to the stock of debt of the
country. It can be concisely expressed by the following equations.6
Let 𝐺𝑡 = 𝐺𝑜𝑣𝑒𝑟𝑛𝑒𝑚𝑛𝑡𝑅𝑒𝑣𝑒𝑛𝑢𝑒
𝑇𝑡 =𝑇𝑎𝑥𝑅𝑒𝑣𝑒𝑛𝑢𝑒
Then
𝑃𝑟𝑖𝑚𝑎𝑟𝑦𝑑𝑒𝑓𝑖𝑐𝑖𝑡 =𝐺𝑡 − 𝑇𝑡
If 𝐷𝑡−1is last year's debt, and 𝑟is the rate of interest, then
6
𝑇𝑜𝑡𝑎𝑙𝑑𝑒𝑓𝑖𝑐𝑖𝑡 =𝐺𝑡 − 𝑟𝐷𝑡−1− 𝑇𝑡
Finally, one can calculate this year's debt:
𝐷𝑡 = (1 +𝑟)𝐷𝑡−1+𝐺𝑡 − 𝑇𝑡
Public debt is an extremely vital source for bridging the government-financing gaps. If it is
utilised in an effective manner then it can increase economic growth and is helpful for
government in achieving the social and development objectives. However, it should be kept in
mind that public debt is a doubled-edged sword; excessive reliance on public debt entails
unacceptable macroeconomic risks and can impede economic growth and development. Public
debt can be classified into two parts external debt and domestic debt and as pointed earlier both
have problems of their own.
i.
Domestic Debt
Government borrowing from internal sources is referred to as domestic debt. In poor
countries main justification behind the creation of domestic debt is that it protect them from
adverse external shocks, and alleviate foreign exchange risks and also helpful in development of
internal financial markets. The ratio of domestic debt/GDP and domestic debt/ revenue
[image:21.612.109.476.538.714.2]represents a country‘s debt carrying capacity.
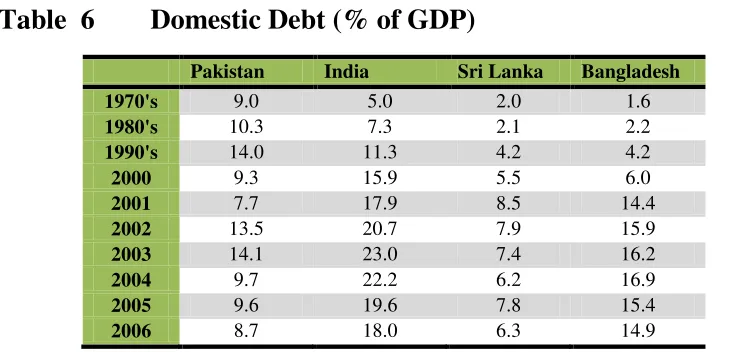
Table 6 Domestic Debt (% of GDP)
Pakistan India Sri Lanka Bangladesh 1970's 9.0 5.0 2.0 1.6
1980's 10.3 7.3 2.1 2.2
1990's 14.0 11.3 4.2 4.2
2000 9.3 15.9 5.5 6.0
2001 7.7 17.9 8.5 14.4
2002 13.5 20.7 7.9 15.9
2003 14.1 23.0 7.4 16.2
2004 9.7 22.2 6.2 16.9
2005 9.6 19.6 7.8 15.4
Source: International Financial Statistics; IMF 2009
The availability of data for domestic debt has been a major issue for all developing
countries. Therefore, the information about government securities is usually used as proxy for
domestic debt7. Table 6 shows the trends of domestic debt for Pakistan, Sri Lanka, India and
Bangladesh. During 1970s, 1980s and 1990s Pakistan had the highest domestic debt/GDP ratio.
However, in spite of high growth in government‘s domestic borrowings during last three
decades, growth in domestic debt started to decrease at the beginning of the 21st century. During
2006, it reduced to 8.7 % of GDP in comparison with average 14% in the 1990s. The
improvement in fiscal discipline, privatization of public sector enterprises coupled with the
rescheduling of external liabilities all helped in reducing the growth in domestic debt.
During 1970s and the 1980s, the Indian domestic debt was well below 8% of GDP but for
wrong reasons---- because the growth rate of the economy was rather poor. In the 1990s due to
economic reforms, Indian economic growth rate has accelerated. To finance a high rate of
economic growth Indian domestic debt burden also increased during 1990s to 11.3 % of GDP
and to 22.2 % in 2004. However, it declined to 18.0% of GDP in 2006, perhaps due to better
financial discipline. In Bangladesh, domestic debt was on average below 6.0% during
1975-2000. This might be ascribed to its lacklustre economic growth. However, it increased to 16.9 %
in 2004 and was 14.9% of GDP in 2006. Surprisingly, in Sri Lanka, domestic debt has been the
lowest among selected countries over the years. It remained below 9% of GDP until 2006.
ii.
External Debt
7
If domestic savings are not sufficient to meet requirements of investment then a country
has to rely on foreign savings and borrowing from external sources. External debt comes in the
form of unilateral borrowing, multilateral borrowing, and borrowing from a consortium or donor
agencies etc. Foreign borrowing allows the country to consume and invest beyond the limits of
domestic production and is helpful for economic growth. Financing development-related projects
with the help of foreign lenders could help the country to build its production capacity and
smooth the progress of economic growth. Particularly, external borrowing enables a country to
finance capital formation not only by using domestic savings but also foreign capital surplus.
Indeed, much of the fast growth witnessed throughout the developing world during the 1950s to
1970s can be safely attributed to the easy availability of foreign aid, most of which carried very
low interest rates or was in the form of grants. However, an addiction to foreign aid can, as it
has, slow down efforts to achieve self-reliance and undercut efforts to raise domestic saving and
investment and severe debt service obligations could hamper the long-term growth potential of a
country. Pakistan, India, Sri Lanka and Bangladesh present examples of both phases of external
borrowings in relation to growth, the incapacity to achieve self-reliance etc.
In order to analyze the debt-carrying capacity different indictors have been used; stock
measurements of the external debt burdens are generally expressed in terms of ratios to
GDP.8Similarly, the problem of indebtedness also depends very importantly on the composition
of debt obligations (i.e. short term and long-term obligations) and level of foreign exchange
reserves. For lack of comparable data, the following discussion focuses on only two
indicators---i.e., external debt as percentage of GDP and external debt as foreign exchange earnings.
(i) External Debt as percentage of GDP
8
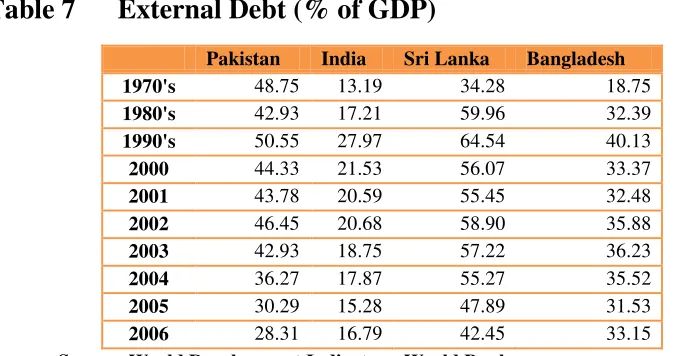
It can be seen that external debt as percentage of GDP has been the lowest in India
among the selected countries. During the 1970s and the 1980s the ratio was on average 13% and
17% respectively; however, in the 1990s, it accelerated to 28% .As a result of successful
economic reforms India has been able to control the external debt to GDP ratio. As a result, in
2006, external debt has once again reduced to only 16.8% of GDP. During the 1980s, external
debt was on average 74% of GDP and in 1990s it slightly reduced to 66% of GDP.
In Bangladesh, external debt was on average 32% of GDP in 1980s and it increased to
40% of GDP in 1990s. However, the situation started to improve on the eve of the 21st century
and in 2005 external debt reduced to 31% of GDP. Sri Lanka also has had a similar trend.
External debt as percentage of GDP has been on average 34%, 60% and 65% of GDP during
1970s, 1980s and 1990s respectively. After the 1990s, however, debt-GDP ratio started to
[image:24.612.115.453.427.605.2]decline and in 2006 it reduced to only 42% of GDP.
Table 7 External Debt (% of GDP)
Pakistan India Sri Lanka Bangladesh 1970's 48.75 13.19 34.28 18.75
1980's 42.93 17.21 59.96 32.39
1990's 50.55 27.97 64.54 40.13
2000 44.33 21.53 56.07 33.37
2001 43.78 20.59 55.45 32.48
2002 46.45 20.68 58.90 35.88
2003 42.93 18.75 57.22 36.23
2004 36.27 17.87 55.27 35.52
2005 30.29 15.28 47.89 31.53
2006 28.31 16.79 42.45 33.15
Source: World Development Indicators, World Bank
In Pakistan, during 1970s, external debt was on average 49 % of GDP, external debt as
percentage of GDP has declined in first half of 1980s, and increased in later half. On average
during 1980s external debt remained on average 43 % of GDP. Rising trend, which started in
than the growth of the GDP. It went up to 55% of GDP in 1999; but, on average, during 1990,
debt has been 51% of GDP. At the beginning of year 2000, the economy of Pakistan experienced
a turnaround: as GDP growth got acceleration and most of the macroeconomic indicators showed
significant improvement. Good growth performance accompanied with debt relief after
participating in war on terrorism. Pakistan was able to made external debt sustainable and it
reduced to 28.3% of GDP in 2006. It indicates that external debt grew much slower than GDP
growth rate.9
(ii) External Debt as Percentage of Exports
Debt as percentage of exports is another very important indicator of the severity of
external debt obligations; it reveals a country‘s capacity to repay external debt. In Pakistan, the
situation has been disturbing: taking 1970s as a starting point, external debt has been on average
482% of exports. Situation slightly improved in 1980s and continued to improve during 1990s
with debt are on average 309% of total exports. However, the improvement became dramatic
after 2001: in 2006, external debt was 185 % of exports. It is worth mentioning here that external
debt as a percentage of exports has improved at a slower rate than external debt as percentage of
foreign exchange earnings, reflecting the fact that its export performance has not been
satisfactory.
In India, debt as percentage of exports was 288% of exports in 1980s and ratio remained
same during 1990s. However, due to the dramatic growth in Indian software exports, this ratio
started to decline and was only 73% in 2006. This bespeaks a dramatic turnaround. On the other
hand, Bangladesh‘s debt carrying capacity has been severely limited. During the 1970s, external
9
debt was 353% of exports; this ratio went up to 628% during 1980. However, in 1990s debt as
percentage of exports started to decline and on average it has remained around 442% of exports.
But, in 2006 debt, debt was only 175% of exports showing considerable improvement in debt
carrying capacity of Bangladesh.
In Sri Lanka, debt as percentage of exports has been quite moderate—the corresponding
figures being 106% and 223% and in 2006, the ratio was only 134% of exports.
Table 8
External Debt (% of Exports)
Pakistan India Sri Lanka Bangladesh 1970's 482.14 206.39 106.07 353.55
1980's 357.54 288.13 223.01 627.91
1990's 308.82 289.25 193.83 441.82
2000 329.78 162.78 143.72 238.72
2001 298.62 161.54 148.53 211.16
2002 305.11 142.94 163.22 251.31
2003 256.80 127.17 159.23 254.86
2004 231.54 98.21 152.21 229.65
2005 193.09 75.18 142.91 190.15
2006 185.14 73.07 134.24 174.73
Source : World Development Indicators, World Bank
iii.
Debt Servicing:
The main problem with external borrowing is that eventually it has to be repaid in one
form or other, which entails a real transfer of resources from the borrowing country to the donor
country or organization. This transfer, if too large in relation to the growth of the domestic
economy and the net addition to the country‘s exporting capabilities, may cause a diminution in
the long-term growth potentialities and impose a burden on the balance of payments. Public
policy, therefore, must balance the pros and cons of external borrowing.
Public debt repayments consist of two elements; for external debt servicing payments to
This causes problems mostly in connection with the external debt. Unlike the domestic debt
where the monetary authorities have control over their own currency and therefore only interest
payments matter; both interest payments and the repayment of the principal amount have to be
settled in terms of foreign exchange. Therefore, payment of the principal amount and interest
payment for external debt both have to be considered for analyzing debt servicing of external
debt. However, to understand the burden of public debt the analysis of the annual revenues
pre-empted by debt servicing, whether foreign or domestic, is very crucial.
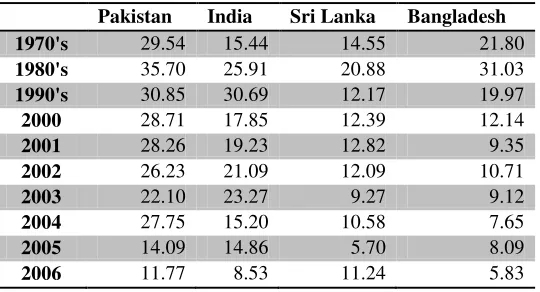
Table 9 shows the large size of external debt servicing among selected countries. As
discussed earlier, in Pakistan debt servicing has been a major part of government expenditure.
During the 1970s, debt servicing was on average 30% of GDP. This ratio rose to 35% of GDP in
the 1980s.10 During the 1990s, debt servicing was on average 32% of exports. However, after the
debt relief granted on the eve of Pakistan participating in the war against terrorism, all the
indicators of external debt servicing started to improve. As a cumulative of the debt relief and
other factors, debt servicing by 2006 had declined to only 12% of exports. However, the
reduction in the debt servicing liabilities does not tell a complete picture of government liabilities
on this count. Contingent liabilities, which might arise in near future, must also be taken into
account (so far they have been excluded) in computing the official public debt figures.11
10
The decade of 1980s can be divided into two halves: the period of 1980-85(when Afghan War was in its full swing); and from 1985 onwards. In the first half of the 1980s, Western countries granted loans on concessional basis and provided relief on debt servicing. As a result, debt servicing was on average 32% of exports. In the latter half, debt servicing as a percentage of exports increased up to 40 %.
11
Table 9
External Debt Servicing (% of Exports)
Pakistan India Sri Lanka Bangladesh 1970's 29.54 15.44 14.55 21.80
1980's 35.70 25.91 20.88 31.03
1990's 30.85 30.69 12.17 19.97
2000 28.71 17.85 12.39 12.14
2001 28.26 19.23 12.82 9.35
2002 26.23 21.09 12.09 10.71
2003 22.10 23.27 9.27 9.12
2004 27.75 15.20 10.58 7.65
2005 14.09 14.86 5.70 8.09
2006 11.77 8.53 11.24 5.83 Source : World Development Indicators, World Bank
In Bangladesh, debt servicing was 21%, 31% and 19% during 1970s, 1980s and 1990s
respectively. A decreasing trend persisted in first decade of 21st century and in 2006 debt
servicing was a mere 6% of exports. Similarly, in Sri Lanka debt servicing which was 15% of
exports in the 1970s increased in 1980s to 21%. However, thereafter, debt as percentage of
exports started to decline. In 1990, it was on average 11% and was further reduced to 6 % of
exports in 2005. In India, debt servicing was 15% of exports during 1970‘s and this ratio
increased to 25% in 1980‘s and to 30% in 1990‘s. But thereafter due to overall better economic
performance and particularly in exports, India has been able to reduce the debt servicing as
percentage of exports and it become only 8.5% in 2006. The overall picture is one that calls for
constant vigilance in planning sound public debt policies.
6.
Concluding Remarks
Initially all the four countries were poor and underdeveloped; so that to stimulate
economic growth, adequate revenues had to be generated. But over the years these countries
have been facing financial crunch. Inadequate resource mobilization and rising expenditures
the balance of payments has remained far from satisfactory and most of the countries have faced
current account deficit. The persistence of twin deficit has resulted in the creation of large
domestic and external public debt that has prevented these countries from earmarking enough
resources for development and social spending. The need to service debt obligation periodically
has undermined efforts at long-term of economic development planning.
In order to stimulate economic growth, curtail the incidence of poverty and improve the
indicators of human development, these countries require tremendous amount of resources to
finance development and social expenditures. Given the downward rigidity of current
expenditure, and crucial importance of the development expenditure, the only way would be to
mobilize additional resources by generating higher level of tax and non-tax revenues. Therefore,
there is an urgent need for implementing tax reforms. To this end, these countries have to bring
under-taxed and un-taxed sectors in the tax net. Above all, sincere efforts should be made for
curbing smuggling, corruption, tax evasion and the increasing size of the shadow economy. In
addition, the tendency to acquire both external and internal debt to finance deficit without
comprehensive analysis needs to be restricted. In this context, it is especially necessary that
resort to domestic debt should not be regarded as a risk-free option. The fact is that domestic
debt increases inflation. It is therefore necessary that bank and non-bank borrowings through
domestic sources for budgetary support should be kept within safe limits. Furthermore,
privatization proceeds must be utilized to retire public debt rather than to finance current
expenditure.
References:
Anwar, T. (2004). Recent Macroeconomic Developments and Implications for Poverty and Employment in Pakistan: The Cost of Foreign Exchange Reserve Holdings in South Asia. 10 Years of ASARC an International Conference. ASARC Working Paper 2004-14.
Aschauer, A.D.(1990), Is Government Spending Stimulative? Contemporary Policy Issues, pp. 30-45
Debt Committee Report. Ministry of Finance, Government of Pakistan (2001.)
Debt Policy Statement 2007-08, Ministry of Finance, Governemnt of Pakistan
Devarajan, S., V. Swaroop and H. Zou (1996 ) The composition of Public Expenditure and Economic Growth, Journal of Monetary Economics, pp.313- 344.
Economic Survey of Pakistan (Various editions), Ministry of Finance, Governemnt of Pakistan
Fan, E. X. (2007). Pakistan's Public Debt: A brief Overview.Asian Development Bank.
Fiscal Policy Statement 2007-08, Ministry of Finance, Governemnt of Pakistan
Ghura, D. (1995). Macro Policies, External Forces, and Economic Growth in Sub-Saharan Africa, Economic Development and Cultural Change , pp. 759-78
Hasan, P. (1999). Pakistan‘s Debt Problem: Its Changing Nature and Growing Gravity. The Pakistan Development Review, pp 435–470.
Human Development Report 2005: International Cooperation at a crossroad,Aid Trade and security in an unequal world. United Nations Development Programme (UNDP).
Human Development Report 2006: Power, poverty and the global water crisis. United Nations Development Progrrame.
Human development report 2007-08; Fighting climate change: Human solidarity in a divided world, United Nations Development Progrrame.
Khan, S. R. (2006). 50 years of pakistan's economy: tradition topics and contemporary concerns.
Oxford Pakistan.
Knoop, T. A. (1999) Growth, Welfare, and the Size of Government, Journal of Economic Inquiry, pp 103-119.
Lindauer, D.L. and A.D. Velenchik (1992), Government Spending in Developing Countries: Trends, Causes, and Consequences, World Bank Observer 7, pp. 59-78.
Martens, J. (2007). ―The Precarious State of Public Finance.‖ BILDUNGSWERK: DGB
Naqvi, Syed Nawab Haider(2010), The Evolution of Development Policy: A Reinterpretation, Oxford University Press.
Nelson, M.A. & Singh, R.D.(1994) , Deficit-Growth Connection: Some Recent Evidence from Developing Countries, Economic Development and Cultural Change, pp 167-91.
Pakistan Development Policy Review: A new Dawn. World Bank Report No. 23916-PAK.
(2002)
Pakistan Poverty Assessment: Poverty in Pakistan: Vulnerabilities, Social Gaps,and Rural Dynamics. World Bank Report No. 24296-PAK. (2002).
Pasha, H., & Ghaus-Pasha, A. (1996). Growth of Public Debt and Debt Servicing in Pakistan: Social Policy and Development Centre (SPDC) Karachi.
State Bank of Pakistan; Annual Report (Various editions)
Towards Pro-poor growth Policies in Pakistan. (2003). Proceedings of the Pro-poor growth policies symposium. Islamabad: UNDP, Pakistan.