Munich Personal RePEc Archive
Does Consumer Price Rigidity Exist in
Barbados?
Craigwell, Roland and Moore, Winston and Worrell, DeLisle
Department of Economics, University of the West Indies, Cave Hill
Campus, Barbados, Governor’s Office, Central Bank of Barbados,
Bridgetown
2011
1
DOES CONSUMER PRICE RIGIDITY EXIST IN BARBADOS?
by
Roland Craigwell
1and Winston Moore
Department of Economics, University of the West Indies, Cave Hill Campus, Bridgetown, BB11000, Barbados
and
DeLisle Worrell
Governor‟s Office, Central Bank of Barbados, Bridgetown, BB11126, Barbados
January 2011
1
Corresponding author: R. Craigwell, Department of Economics, University of the West Indies, Cave Hill Campus, Bridgetown, BB11000, Barbados. Tel.: +246-4174474; Fax:+246-4389104; Email:
DOES CONSUMER PRICE RIGIDITY EXIST IN BARBADOS?
by
Roland Craigwell, Winston Moore and Delisle Worrell
Abstract
This paper uses a unique micro data set of price records underlying the Barbados retail price
index between 1994 and 2008 to provide a detailed assessment of consumer price rigidity. The
major aim is to calculate price durations and the patterns of price-setting across sectors. We also
check whether price cuts are as frequent as increases, and whether there is specific downward
nominal rigidity. We find that prices in Barbados tend to change relatively frequently, with
between 50 and 80 percent of items in every category reporting a price change every month.
While there are regular monthly price reductions as well as increases, the reductions are always
smaller and fewer than the increases. The paper also reports no measurable impact of changes in
the money supply or national inflation on the frequency of price changes.
JEL Classification
:
E3; L1; C4, D4001.
Introduction
Inflation is among the most heavily researched topics in Caribbean economics (Coppin, 1993;
Cumberbatch, 1997; Downes et al, 1993; Hamilton, 1994; Kwon and Robinson, 2006; McClean,
1997; Sun, 2005; Worrell and Scantlebury-Maynard, 1994), but the results of this work are not
often reflected in policy initiatives to combat inflation. For example, recent policies to control
inflation in the Caribbean have focussed mainly on fiscal measures, whereas inflation studies
have been concerned primarily with monetary policy. The policies have been typically applied at
disaggregated levels, and their effects are not captured by research which deals almost
exclusively with macroeconomic aggregates.
At the disaggregated or firm level, Blinder (1994) attempted to confront models of price
stickiness with real world data using the responses to a series of questions on price formation by
managers in charge of pricing. The survey, which solicited responses from 200 randomly
selected firms in the United States (US), found that firms tend to change prices rather
infrequently, at most once during an average year. In addition, most indicated that on average
prices are altered only 3 months after a shock to demand or cost. Blinder also solicited views on
which theories of sticky prices best explained the managers‟ decision-making process. Of the
twelve theories tested, the coordination failure model of Ball and Romer (1991) seemed to best
describe the sources of price stickiness. In a similar survey of 654 United Kingdom (UK)
companies, Hall et al (1997) obtained comparable results in relation to the frequency of price
changes, but in their study price stickiness was largely attributed to cost-based pricing and
In order to bridge the gap between inflation models, inflation policy and the actual practice of
price formation in the Caribbean, further research is needed to illustrate and test the process of
price formation, the dynamics of inflation and the scope and effectiveness of anti-inflationary
policies. The present study makes a contribution to the description and testing of the practice of
price formation. We extract information on the frequency and magnitude of price changes from
input data for the construction of the monthly retail price index (RPI) over 8 recent years, and test
for possible factors affecting the frequency and magnitude of price adjustments.
After the introduction, previous empirical studies are reviewed, followed by the empirical
methodology in Section 4. Thereafter, the results are presented and in the final section,
conclusions are made.
2.
Previous Empirical Studies
Several authors have used data on product group trends to investigate the actual characteristics of
price formation. Kashyap (1995), in a study of the evolution of prices of 12 retail goods over 35
years sourced from the mail order catalogues of three major companies in the US, found that
nominal prices sometimes stayed fixed for several years before changing a number of times in a
given year, by relatively small increments. Kashyap infers that the costs of price adjustment are
relatively small. Levy et al (2002) compare price and cost data for 12 orange juice products,
concluding that prices tend to be rigid in response to small and temporary cost shocks and in
circumstances where the retailer has limited information about the nature of the shock. Herrmann
contribute to price rigidity. The prices of branded foods remain unchanged for an average of 19
weeks and as long as 53 weeks.
Levy et al (1998) track store-level information on the prices at five large supermarkets and one
drugstore chain in the US. These stores tend to change the prices of about 13-17 percent of their
products every week. This relatively high frequency of price adjustment was largely attributed to
the fierce competition in the supermarket industry, which counteracted the effects of the
complexity and cost of altering prices as well as rigidities in the laws governing retail pricing.
Weber and Anders (2007) collected weekly retail-scanner data for meat products from 207 retail
outlets in Germany, capturing information on prices, discounts, promotional activities and store
characteristics. On average, the prices of meat products such as beef can remain unchanged for
up to 63 weeks. This high degree of price rigidity was largely attributed to the market power of
firms, and their ability to absorb cost shocks by adjusting their margins, based on inferences from
a conjectural variations model that yielded an estimate that market power in the retail industry
tends to lead to price distortions of between 0.6 and 3 percent. Similar evidence of store level
price rigidity is reported for online booksellers (Chakrabarti and Scholnick, 2007), commercial
banks (Toolsema and Jacobs, 2007) and gas stations (Davis, 2007; Davis and Hamilton, 2004).
Bils and Klenow (2004), in a study covering a wider variety of goods than described in the last
paragraph, use data on 350 product categories from the US retail price index on a monthly
frequency from 1995 to 1997. In general, the authors find a higher frequency of adjustment than
studies utilising survey data or product group information: prices tend to change every 4.3
months. Bils and Klenow also report that goods prices tend to move more often than service
change. The persistence and volatility across goods was evaluated by fitting a first order
autoregressive (AR (1)) process to the monthly inflation rate for each of the goods. The results
suggested that goods with more frequent price changes tend to have more serial correlation in
inflation as well as higher volatility.
Recognising the value of these studies for policy-making purposes, researchers have replicated
and expanded them, using data from a wide variety of countries. Dhyne et al (2006) provide a
useful summary of this literature for the euro area: prices in the euro area change less frequently
than in the US, tending to remain unchanged on average for 10.6 months compared to 4.6 months
in the US. The disparity was largely attributed to differences in: (1) inflation and inflation
volatility; (2) market structure; (3) methodologies used by statistical agencies; (4) frequency and
size of cost and demand shocks; and (5) types of goods purchased. Moreover, when prices do
change, the movements are usually smaller than those for the US: 8.2 percent compared to 12.7
percent.
Price rigidity in a developing country was addressed by Kovanen (2006), who investigated the
relatively higher rate of inflation and inflation volatility in Sierra Leone. The study found that the
average duration of prices was 2.6 months, implying more frequent changes than in the industrial
states. Kovanen attributes this finding to a relatively large number of food items included in the
consumer price index (CPI) basket, the dominance of small-scale enterprises and individual
sellers and the level of macroeconomic volatility and inflation uncertainty. In addition to the
frequency of price changes a relatively larger proportion of the CPI basket was subject to price
alterations and high volatility. By regressing the fraction of prices changing every month on a
containing money growth, officials in Sierra Leone could potentially reduce the rate of inflation
and inflation volatility.
More recently, Sahinoz and Saracoglu (2008) studied the price-setting behaviour of a sample of
999 firms across several Turkish industries. They found that, under normal conditions, the
majority of the firms follow time-dependent pricing rules but when significant events occur, a
substantial portion of them change their behaviour to state-dependent reviewing. The median
Turkish firm reviews its prices every month, but changes its prices four times a year, results very
similar to those of Sierra Leone discussed above by Kovanen (2006). Sahinoz and Saracoglu
(2008) used probit models to show that price reviews and changes are mainly influenced by
market share, price discrimination, customer type, firm size, and the existence of regulated prices.
3.
Empirical Approach
This section outlines the empirical approach employed to study the issue of price rigidity in
Barbados. The index measuring whether or not prices are altered during a particular month is
defined as follows:
) ( ,...., 1 ) ( ,...., 1 0 1 1 1 periods of number T t and goods of number K i for p p if p p if I it it it it it (1)
For each goodi, the frequency of price movements Fi is calculated as the ratio of observed price
changes to all valid price records. The implied duration of price spells can be calculated as the
inverse of the frequency of price changes
F
D 1 . This computation, however, assumes that the
month. To relax this assumption and allow for continuous timing, the implied average and
median duration of price spells can be estimated as follows:
) 1 ln( ) 5 . 0 ln( ) 1 ln( 1 i Median i Average F D F D (2)
The rigidity of prices can be gleaned from the frequency as well as duration indicators. Prices
can be considered rigid if the frequency of price changes is small and there is therefore relatively
long duration of price spells.
It is also of interest to examine the synchronisation of price changes. Fisher and Konieczny
(2000) provide a measure of price synchronisation based on the ratio of the empirical standard
deviation of the frequency of price changes for product i to the theoretical maximum standard
deviation in the case of perfect synchronisation of price movements:
) 1 ( ) ( 2 1 i i t i it i F F F F T SYNC
(3)If price changes are synchronised, i.e. the prices of all goods adjust at the same time or not at all,
then the ratio should be near 1. This expression is also employed to calculate the synchronisation
of price increases and decreases over the sample period.
Related to the issue of price synchronisation is the correlation of monthly price changes, i.e. if
prices expanded in the previous month is that change likely to lead to a rise in prices in the
current month? An estimate of the correlation between monthly price changes or inflation
it it i
it
1 (4)
where is the month-on-month adjustment in prices. If is small then this would suggest a
relatively low degree of correlation between monthly prices changes.
Menu-cost models of price adjustment suggest that inflation tends to be higher in markets where
price alterations are more frequent (see Barro, 1972; Taylor, 1999). To understand the factors
that have influenced price changes in Barbados over the last few years an empirical model of the
frequency of price movements is estimated over the period 2000 to 2008. The model takes the
following form:
t i
i t i i
i t i
i i t i
t F dM
F
2
1 2
1 2
1
0 (5)
where dM is the month-on-month change in M2 (money plus quasi-money) and aggregate
monthly inflation. Money is included to capture the effects that money creation can have on the
demand for goods and services and therefore the frequency of price changes. Similarly, during
periods of high inflation, the prices of goods and services should be expected to move relatively
frequently as firms attempt to maintain profit margins. Lagged values of money and inflation are
included in the regression equation, as prices cannot be instantaneously adjusted in response to
demand pressures or higher input costs.
4.
Results
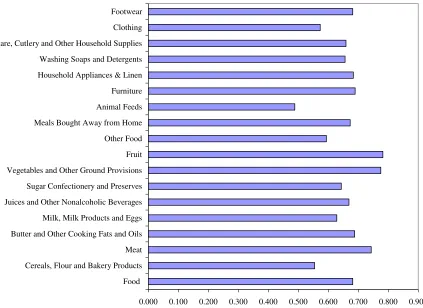
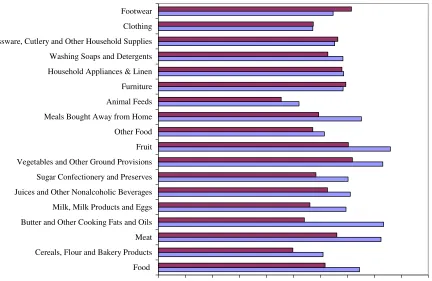
The estimated monthly frequency of price changes for each product are given in Table 1 and
plotted in Figure 1. The results indicate that between 50 to 80 percent of prices in each product
adjustments were „fruit‟ and „vegetables and other ground provisions‟, with about 80 percent of
items reporting price changes every month. This finding agrees with the previous literature in the
area that suggests commodity prices have a higher rate of fluctuation. „Animal feeds‟ have the
lowest frequency of price changes, with only half of the number of goods altering prices every
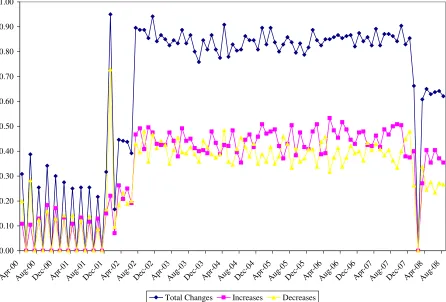
month. The frequency of price changes was fairly persistent over time (see Figure 2). 2
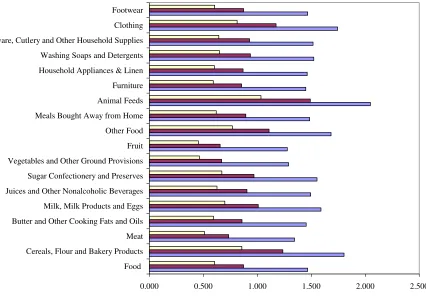
The average duration of most goods was between 1 and 2 months, with „animal feeds‟ and
„cereals, flour and bakery products‟ on the longer end of this spectrum. After making
adjustments to reflect continuous timing of price changes, the implied average and median
duration of price spells is less than 1 month for most goods, with a median duration of about 0.6
months. In the case of „vegetables and other ground provisions‟ and „fruit‟, prices remain fixed
for less than half a month. Only animal feeds had a median duration of over 1 month.
Figure 3 also shows that the relative proportions of these changes due to price increases and
decreases were relatively constant. In every month, between 40 to 50 percent of goods report
higher prices while 30 to 40 percent of goods experience some decline in price. The summary
statistics provided in Table 1 suggest that „fruit‟, „vegetables and other ground provisions‟,
„butter and other cooking fats and oils‟ as well as „meat‟ tended to have the highest probabilities
of price expansions during any given month. However, „fruit‟ and „vegetables and other ground
provisions‟ also had the highest probabilities of price declines during a given month.
2
Figure 4 plots the frequency of price increases/decreases by product group. For most product
groups the frequency of price expansions tended to be slightly higher than that for price
contractions. The only goods that were more likely to report price cuts than price increases were
„furniture‟, „glassware, cutlery and other household supplies‟, „clothing‟ and „footwear‟.
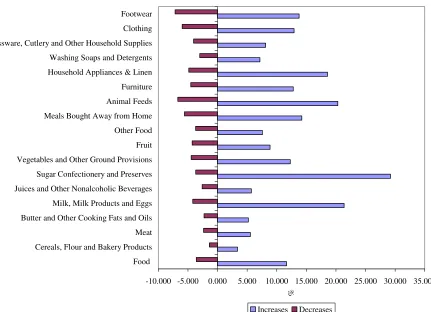
On average the size of these expansions tended to be larger than the price reductions: mean price
increases ranged from 3 to 29 percent, while average price contractions spanned between 1 and 7
percent per month (Figure 5). Nine product groups had double-digit average monthly price
expansions: (1) milk, milk products and eggs; (2) sugar confectionery and preserves; (3)
vegetables and other ground provisions; (4) meals bought away from home; (5) animal feeds; (6)
furniture; (7) household appliances and linen; (8) clothing, and; (9) footwear. „Household
appliances‟, „animal feeds‟, „sugar confectionery and preserves‟, and „milk, milk products and
eggs‟, had the largest average price increases per month at 15 percent. „Clothing, footwear and
animal feeds‟ had the greatest average price decreases.
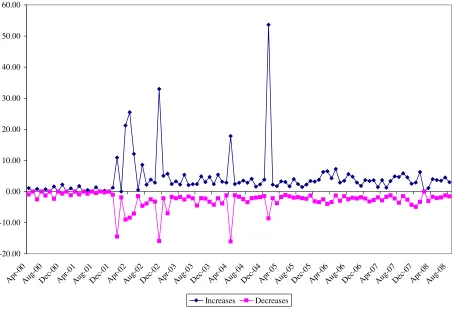
Figure 6, which plots the sizes of these price changes over time, reveals that during a given
month price increases are likely to be associated with price reductions. It also shows evidence of
five periods of high price volatility, with expansions ranging between 10 percent and over 50
percent in a month, coinciding with price contractions in double digits in the same month. Apart
from these five periods, prices generally fluctuate between +10 and -5 percent.
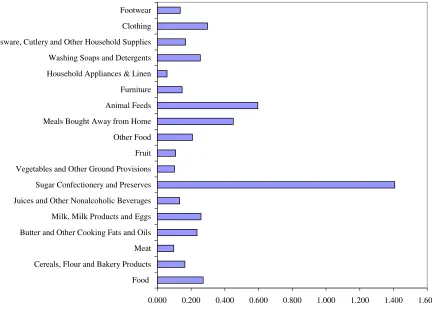
The volatility of price changes is not markedly high for any product group. In general, the
coefficient of variation for most product groups ranged between 0.2 and 0.4. The product groups
and „meals bought away from home‟, with the volatility of „sugar confectionery and preserves‟
more than twice that of the next most volatile category.
Table 2 shows only a few product groups where price changes for products within the group
tended to be highly synchronised. „Sugar confectionery and preserves‟, „meals bought away from
home‟ and „animal feeds‟ fall into this category, in terms of both price increases and decreases,
while „butter and other cooking fats and oils‟, „fruit‟ and „furniture‟ seem to display a degree of
synchronisation in relation to price expansions only. These results imply that while some stores
do follow closely what their competitors are doing in relation to prices, most stores do not.
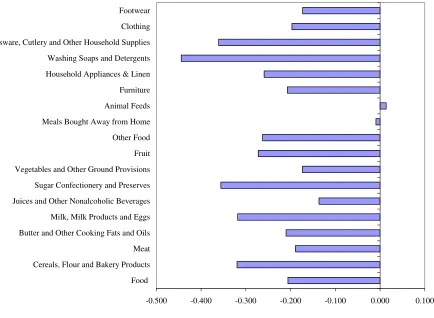
The estimated inflation persistence (correlation of price movements with changes in the previous
month) is quite low (Figure 8).3 Even though price alterations occur relatively frequently on the
island, past price adjustments have only a small impact on current changes. In addition, virtually
all correlations are negative, implying that price rises are likely to be followed by price
reductions. Price changes will therefore dissipate over time. The estimated half life
of movements in the prices of „washing soaps and detergents‟ and „glassware, cutlery and other
household appliances‟ were the fastest over the period under investigation, with 1 month needed
for a unit shock to prices in these product groups to disperse by half. In contrast, the estimated
half life for „meals bought away from home‟ was much longer, with the time taken for half of a
unit shock to dissipate estimated at over a year.
3
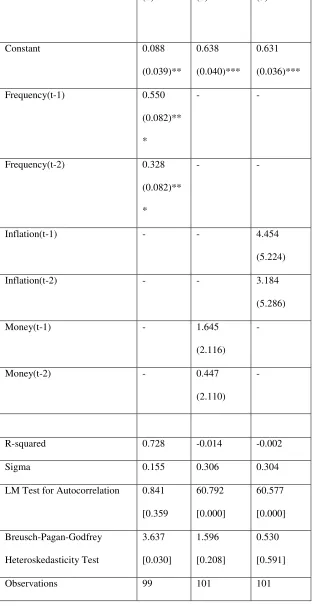
Estimates of an autoregressive model of the factors affecting the frequency of price change are
provided in Table 3. The results suggest that most of the frequency of price adjustment tends to
be due to changes over the previous two months. Lagged alterations in the money supply and
past inflation had no statistically significant impact on the frequency of price.
Conclusion
Our conclusions may be summarised as follows:
- Prices in Barbados are changed quite frequently; between 50 and 80 percent of items in
every category recorded a price adjustment every month on average;
- In the present decade the frequency of price movements has remained more or less
constant;
- There are regular monthly price reductions as well as increases, but the reductions are
always smaller and fewer than the increases;
- The magnitudes of expansions and decreases have remained largely unchanged during the
current decade;
- Apart from five periods of highly volatile prices, which lasted between one and six
months, price changes have fluctuated between contractions of five percent and increases of 10
percent;
- The price volatility pattern is similar for all product groups;
- However, within product groups price changes are not highly synchronised;
- Price adjustments are not highly correlated with changes in a previous period; correlations
are small and negative, indicating a slight tendency for increases to be followed by decreases, and
- There is no measurable impact of changes in the money supply or national inflation on the
frequency of price adjustments.
Further research is needed to investigate why prices are altered so frequently, why there is so
much volatility (reductions as well as increases), and why prices within product groups are not
synchronized. It would be instructive to design a survey of decision makers in order to explore
these issues further. Also it will be necessary to revisit tests of the impact of monetary policy and
notions of what really drives prices. The fact that inflation appears not to be related to the
observed pattern of price changes is also puzzling and deserving of further investigation. Studies
of other Caribbean countries, done in a similar vein to this one, would also serve to enlighten this
References
Ball, L. and Romer, D. (1991) “Sticky Prices as Coordination Failure,” American Economic
Review 81(): 539-552.
Baudry, L., Bihan, H., Sevestre, P. and Tarrieu, S. (2007) “What Do Thirteen Million Price
Records Have To Say About Consumer Price Rigidity,” Oxford Bulletin of Economics and
Statistics 69(2): 139-183.
Barro, R.J. (1972) “A Theory of Monopolistic Price Adjustment,” Review of Economic Studies
39(2): 17-26.
Bils, M. and Klenow, P.J. (2004) “Some Evidence on the Importance of Sticky Prices,” Journal
of Political Economy 112(5): 947-985.
Blinder, A.S. (1994) “On Sticky Prices: Academic Theories Meet the Real World,” Mankiw,
N.G., Monetary Policy, University of Chicago Press, Chicago: 117-154.
Chakrabarti, R. And Scholnick, B. (2007) “The Mechanics of Price Adjustment: New
Evidence on the (un)Importance of Menu Costs,” Managerial and Decision Economics 28:
657-668.
Coppin, A. (1993) “Recent Evidence on the Determinants of Inflation in a Tourism-oriented
Economy: Barbados,” Social and Economic Studies 42(2/3): 65-80.
Cumberbatch, C. (1997) “A model of inflation in Barbados,” in Worrell, D. and Craigwell, R.,
Macroeconomics and Finance in the Caribbean: Quantitative Analyses, Caribbean Centre for
Monetary Studies, St. Augustine, Trinidad and Tobago.
Davis, M. (2007) “The Dynamics of Daily Retail Gasoline Prices,” Managerial and Decision
Davis, M.C. and Hamilton, J.D. (2004) “Why Are Prices Sticky? The Dynamics Of Wholesale
Gasoline Prices,” Journal of Money, Credit and Banking 36(1): 17-37.
Dhyne, E., Álvarez, L.J., Hoeberichts, M.M., Kwapil, C., Bihan, H., Lünnemann, P., Matins,
F., Sabbatini, R., Stahl, H., Vermeulen, P. and Vilmunen, J. (2006) “Price Changes in the
Euro Area and the United States: Some Facts from Individual Consumer Price Data,” Journal of
Economic Perspectives 20(2): 171-192.
Downes, A., Worrell, K. and Scantlebury, A. (1993) “Macroeconomic Adjustment and the
Inflation Experience of Selected Caribbean Countries,” Caribbean Development Bank.
Fisher, T. and Konieczny, J.D. (2000) “Synchronization of Price Changes by Multiproduct
Firms: Evidence from Canadian Newspaper Prices,” Economics Letters 68(3): 271-277.
Hall, S., Walsh, M. and Yates, A. (1997) “How do UK Companies Set Prices,” Bank of
England Working Paper No. 67, London, UK.
Hamilton, R. (1994) “Analysing real wages, prices and productivity and the effects of state
intervention in Caribbean type economies,”Social and Economic Studies 43(1):
Herrmann, R. And Moeser, A. (2006) “Do Psychological Prices Contribute to Price Rigidity?
Evidence from German Scanner Data on Food Brands,” Agribusiness 22(1): 51-67.
Kashyap, A.K. (1995) “Sticky Prices: New Evidence from Retail Catalogues,” Quarterly
Journal of Economic 110(): 245-274.
Kovanen, A. (2006) “What Do Prices in Sierra Leone Change So Often? A Case Study Using
Micro-Level Price Data,” IMF Working Paper WP/06/53, International Monetary Fund,
Washington, DC.
Kwon, G. and Robinson, W. (2006) “Public debt money supply and inflation: a cross country
study and its application to Jamaica,” IMF seminar paper, International Monetary Fund,
Levy, D., Shantanu, D. and Bergen, M. (2002) “Heterogeneity in Price Rigidity: Evidence from
a Case Study Using Microlevel Data,” Journal of Money, Credit and Banking 34(1): 197-220.
Levy, D., Shantanu, D., Bergen, M. and Venable, R. (1998) “Price Adjustment at Multiproduct
Retailers,” Managerial and Decision Economics 19(): 81-120.
McClean, W. (1997) “Monetary Dynamics in Barbados: the Evidence from Cointegration
Analysis and Error Correction Modelling,” in Worrell, D. and Craigwell, R., Macroeconomics
and Finance in the Caribbean: Quantitative Analyses, Caribbean Centre for Monetary Studies,
University of the West Indies, St. Augustine, Trinidad and Tobago.
Peltzman, S. (2000) “Prices Rise Faster than they Fall,” Journal of Political Economy 108(3):
466-502.
Sahinoz, S and Saracoglu, B. (2008) “Price-setting Behaviour in Turkish Industries: Evidence
from Survey Data”, The Developing Economies XLM(4): 363-85.
Sun, Y. (2005) “A monetary rule for Jamaica,” IMF Working Paper WP/05/41, International
Monetary Fund, Washington, DC.
Taylor, J.B.(1999) “Staggered Price and Wage Setting in Macroeconomics,” in Taylor, J.B. and
Woodford, M. (eds.), Handbook of Macroeconomics, Elsevier Publishing, New York: 1009-1050.
Toolsema, L. and Jacobs, J. (2007) “Why Do Prices Rise Faster than they Fall? With an
Application to Mortgage Rates,” Managerial and Decision Economics 28: 701-212.
Weber, S.A. and Anders, S.M. (2007) “Price Rigidity and Market Power in German Retailing,”
Managerial and Decision Economics 28(): 737-749.
Worrell, K. and Maynard, A. (1994) “An empirical note on inflation in Trinidad and Tobago,
18
Table 1: Frequency of Prices Changes by Product Group
Frequency of
Price
Changes
Average
Duration of
Price Spells
Median
Duration of
Price Spells
Frequency of
Price
Increases
Frequency of
Price
Decreases
Average
Price
Increase
Average
Price
Decrease
Food 0.682 1.467 0.605 0.373 0.309 11.670 -3.592
Cereals, Flour and Bakery Products 0.554 1.804 0.857 0.305 0.249 3.381 -1.368
Meat 0.743 1.345 0.510 0.413 0.331 5.539 -2.354
Butter and Other Cooking Fats and Oils 0.688 1.453 0.595 0.417 0.271 5.212 -2.276
Milk, Milk Products and Eggs 0.629 1.591 0.700 0.348 0.281 21.386 -4.184
Juices and Other Non-alcoholic Beverages 0.669 1.494 0.627 0.356 0.314 5.718 -2.592
Sugar Confectionery and Preserves 0.644 1.554 0.672 0.351 0.292 29.210 -3.690
Vegetables and Other Ground Provisions 0.775 1.290 0.464 0.416 0.360 12.294 -4.450
Fruit 0.782 1.278 0.455 0.430 0.352 8.881 -4.290
Other Food 0.594 1.683 0.769 0.308 0.286 7.585 -3.695
Meals Bought Away from Home 0.673 1.485 0.620 0.376 0.297 14.247 -5.587
Animal Feeds 0.488 2.047 1.034 0.261 0.228 20.323 -6.707
Furniture 0.690 1.450 0.592 0.342 0.347 12.795 -4.514
Household Appliances & Linen 0.684 1.463 0.602 0.343 0.340 18.573 -4.849
Glassware, Cutlery and Other Household Supplies 0.659 1.517 0.644 0.327 0.333 8.119 -4.049
Clothing 0.573 1.744 0.814 0.286 0.287 12.932 -5.974
Footwear 0.682 1.467 0.605 0.324 0.358 13.789 -7.171
20
Table 2: Synchronisation Ratio by Product Group
Synchronisation
Ratio of Price
Changes
Synchronisation
Ratio of Price
Increases
Synchronisation
Ratio of Price
Decreases
Food 0.610 0.345 0.295
Cereals, Flour and Bakery Products 0.523 0.398 0.348
Meat 0.691 0.394 0.324
Butter and Other Cooking Fats and Oils 0.717 0.576 0.480
Milk, Milk Products and Eggs 0.589 0.439 0.424
Juices and Other Nonalcoholic Beverages 0.648 0.461 0.416
Sugar Confectionery and Preserves 0.679 0.576 0.547
Vegetables and Other Ground Provisions 0.764 0.427 0.385
Fruit 0.798 0.532 0.497
Other Food 0.628 0.449 0.447
Meals Bought Away from Home 0.893 0.760 0.725
Animal Feeds 0.724 0.697 0.661
Furniture 0.805 0.502 0.496
Household Appliances & Linen 0.766 0.433 0.433
Washing Soaps and Detergents 0.717 0.452 0.410
Glassware, Cutlery and Other Household Supplies 0.678 0.433 0.430
Clothing 0.802 0.488 0.479
Table 3: Determinants of the Fraction of Price Changes
(1) (2) (3)
Constant 0.088
(0.039)**
0.638
(0.040)***
0.631
(0.036)***
Frequency(t-1) 0.550
(0.082)**
*
- -
Frequency(t-2) 0.328
(0.082)**
*
- -
Inflation(t-1) - - 4.454
(5.224)
Inflation(t-2) - - 3.184
(5.286)
Money(t-1) - 1.645
(2.116)
-
Money(t-2) - 0.447
(2.110)
-
R-squared 0.728 -0.014 -0.002
Sigma 0.155 0.306 0.304
LM Test for Autocorrelation 0.841
[0.359
60.792
[0.000]
60.577
[0.000]
Breusch-Pagan-Godfrey
Heteroskedasticity Test
3.637
[0.030]
1.596
[0.208]
0.530
[0.591]
Figure 1: Frequency of Prices Changes by Product Group
0.000 0.100 0.200 0.300 0.400 0.500 0.600 0.700 0.800 0.900 Food
Figure 2: Frequency of Prices over Time
0.00 0.10 0.20 0.30 0.40 0.50 0.60 0.70 0.80 0.90 1.00
Apr -00
Aug-00
Dec-00Apr -01
Aug-01
Dec-01Apr -02
Aug-02
Dec-02Apr -03
Aug-03
Dec-03Apr -04
Aug-04
Dec-04Apr -05
Aug-05
Dec-05Apr -06
Aug-06
Dec-06Apr -07
Aug-07
Dec-07Apr -08
Aug-08
Figure 3: Duration of Prices Changes by Product Group
0.000 0.500 1.000 1.500 2.000 2.500 Food
Cereals, Flour and Bakery Products Meat Butter and Other Cooking Fats and Oils Milk, Milk Products and Eggs Juices and Other Nonalcoholic Beverages Sugar Confectionery and Preserves Vegetables and Other Ground Provisions Fruit Other Food Meals Bought Away from Home Animal Feeds Furniture Household Appliances & Linen Washing Soaps and Detergents Glassware, Cutlery and Other Household Supplies Clothing Footwear
Figure 4: Frequency of Prices Increasing/Decreasing by Product Group (Per Month)
0.000 0.050 0.100 0.150 0.200 0.250 0.300 0.350 0.400 0.450 0.500 Food
Cereals, Flour and Bakery Products Meat Butter and Other Cooking Fats and Oils Milk, Milk Products and Eggs Juices and Other Nonalcoholic Beverages Sugar Confectionery and Preserves Vegetables and Other Ground Provisions Fruit Other Food Meals Bought Away from Home Animal Feeds Furniture Household Appliances & Linen Washing Soaps and Detergents Glassware, Cutlery and Other Household Supplies Clothing Footwear
Figure 5: Average Size of Prices Increasing/Decreasing by Product Group (Per Month)
-10.000 -5.000 0.000 5.000 10.000 15.000 20.000 25.000 30.000 35.000 Food
Cereals, Flour and Bakery Products Meat Butter and Other Cooking Fats and Oils Milk, Milk Products and Eggs Juices and Other Nonalcoholic Beverages Sugar Confectionery and Preserves Vegetables and Other Ground Provisions Fruit Other Food Meals Bought Away from Home Animal Feeds Furniture Household Appliances & Linen Washing Soaps and Detergents Glassware, Cutlery and Other Household Supplies Clothing Footwear
%
Figure 6: Average Size of Prices Increases/Decreases over Time
-20.00 -10.00 0.00 10.00 20.00 30.00 40.00 50.00 60.00
Apr -00
Aug-00
Dec-00Apr -01
Aug-01
Dec-01Apr -02
Aug-02
Dec-02Apr -03
Aug-03
Dec-03Apr -04
Aug-04
Dec-04Apr -05
Aug-05
Dec-05Apr -06
Aug-06
Dec-06Apr -07
Aug-07
Dec-07Apr -08
Aug-08
Figure 7: Estimated Volatility of Prices Changes by Product Group (Coefficient of
Variation)
0.000 0.200 0.400 0.600 0.800 1.000 1.200 1.400 1.600 Food
[image:29.612.95.527.132.444.2]Figure 8: Estimated Inflation Persistence by Product Group
-0.500 -0.400 -0.300 -0.200 -0.100 0.000 0.100 Food
Figure 9: Empirical Survivor Functions by Product Group 0.0 0.2 0.4 0.6 0.8 1.0
5 6 7 8 9 10 11 12 13
P ro b a b ili ty FOOD 0.0 0.2 0.4 0.6 0.8 1.0
3.0 3.5 4.0 4.5
P ro b a b ili ty CEREALS 0.0 0.2 0.4 0.6 0.8 1.0
6.5 7.0 7.5 8.0 8.5 9.0 9.5
P ro b a b ili ty M EAT 0.0 0.2 0.4 0.6 0.8 1.0
4 5 6 7
P ro b a b ili ty BUTTER 0.0 0.2 0.4 0.6 0.8 1.0
4 5 6 7 8 9 10
P ro b a b ili ty M ILK 0.0 0.2 0.4 0.6 0.8 1.0
3.6 4.0 4.4 4.8 5.2 5.6
P ro b a b ili ty JUICE 0.0 0.2 0.4 0.6 0.8 1.0
10 20 30 40 50 60
P ro b a b ili ty SUGAR 0.0 0.2 0.4 0.6 0.8 1.0
4.0 4.5 5.0 5.5 6.0 6.5
P ro b a b ili ty VEG 0.0 0.2 0.4 0.6 0.8 1.0
5 6 7 8 9
P ro b a b ili ty FRUIT 0.0 0.2 0.4 0.6 0.8 1.0
2.5 3.0 3.5 4.0 4.5 5.0
P ro b a b ili ty OTHFOOD 0.0 0.2 0.4 0.6 0.8 1.0
10 20 30 40 50
P ro b a b ili ty M EALSAWAY 0.0 0.2 0.4 0.6 0.8 1.0
5 10 15 20 25
P ro b a b ili ty FEEDS 0.0 0.2 0.4 0.6 0.8 1.0
800 900 1,000 1,100 1,200
P ro b a b ili ty FURNITURE 0.0 0.2 0.4 0.6 0.8 1.0
440 480 520 560
P ro b a b ili ty APPLIANCES 0.0 0.2 0.4 0.6 0.8 1.0
3 4 5 6 7 8
P ro b a b ili ty SOAPS 0.0 0.2 0.4 0.6 0.8 1.0
5 6 7 8 9 10 11
P ro b a b ili ty CUTLERY 0.0 0.2 0.4 0.6 0.8 1.0
20 30 40 50
P ro b a b ili ty CLOTHING 0.0 0.2 0.4 0.6 0.8 1.0
70 80 90 100 110 120