Munich Personal RePEc Archive
What do Italian consumers know about
Economic Data? An analysis based on
the ISTAT Consumers Survey
Giovannini, Enrico and Malgarini, Marco
University of Rome Tor Vergata, ANVUR and Fundacao Getulio
Vargas
2012
Online at
https://mpra.ub.uni-muenchen.de/54125/
1
What do Italian consumers know about Economic Data?
An analysis based on the ISTAT Consumers Survey
By Enrico Giovannini
*and Marco Malgarini
**Abstract
Standard theory describes economic decisions as the result of optimising behaviour of well-informed
economic agents. However, whether citizens are really well informed on economic data is still highly
disputed. In order to investigate on this issue, since 2007 the Italian Consumers survey has
incorporated a number of questions on the degree of knowledge about economic data. Surveys results
show that the level of knowledge of Italian consumers is relatively low; moreover, knowledge seems to
significantly vary across different groups of respondents, depending on individual characteristics and
the perceived costs and benefits of acquiring information. Results provide evidence of deviation from
the standard approach of full rationality in the information acquisition process: if agents are not always
fully rational, delays in information acquisition should be taken into account by policy makers in
designing appropriate interventions.
Keywords: Household information acquisition; information and knowledge; consumer
confidence; statistical literacy; media exposure
JEL code: C83; D1; D83; H31
PsycINFO Classification code: 2227; 2229; 2240; 2960
*
University of Rome “Tor Vergata”
**
2
1. Introduction
1Economic theory describes policy decisions as the result of optimising behaviour of rational
agents; on similar grounds, according to the public choice school, voters are also supposed to be well
informed agents who base their decisions on utility maximisation. More generally, mainstream
macroeconomics assumes that economic agents rationally elaborate on their full information set in
order to form their savings or consumption decisions2.
However, whether citizens are really well informed and rationally behaved is still highly
disputed. Indeed, a number of studies have recently shown that agents are far from being fully
informed about key economic variables; among them, Blinder and Kruger (2004) stressed the
importance of determining how a society knows about statistics. They found that ideology is the
strongest determinant in shaping public opinion: given the apparent inclination to use ideology,
combined with the difficulty in building knowledge oneself, they find that US citizens tend to follow
“ready-made” beliefs that society has chosen for them. According to Curtin (2008) people may be interested in knowing about how inflation affects their shopping trolley, or the unemployment rate in
their specific labour market, but are less interested in learning about the performance of the whole
country or in aggregated macro indicators which are difficult to apply to their daily life. In such
circumstances, private information derived from neighbourhoods or local communities may be better
appreciated by some than public information stemming from official sources. Reis (2006, 2009)
interprets this kind of finding arguing that costs associated with the acquisition and use of information
may generate “rational inattention”, with widespread “knowledge inequalities” among the population.
In this respect, official statistics have an increasingly important role in the development of a
common knowledge about the state and the evolution of a society: according to Giovannini et al.
(2008) the value added of statistics critically depends on what people know about the world they live
in. Following this strand of literature, since 2007 the Italian Consumers survey has incorporated once
a year a number of questions on the degree of knowledge about economic data3. Questions concern
knowledge about recent trends in GDP growth, inflation and the unemployment rate; consumers also
have to report their opinions on the reliability of economic information and to indicate the main
channels they use to acquire them. Finally, since 2009 they also have to report whether they use this
kind of information in their decision process.
1 The authors wish to thank Annamaria D'Urzo for the elaboration of the aggregate economic
knowledge indicators presented in section 4.
2
See on this Blinder A.S., Krueger, A.B., (2004).
3
This paper further analyses the results of the survey and is structured as follows: section 2
presents the consumers survey carried out by the Italian statistical institute (ISTAT), while section 3
presents survey results. In section 4 we develop an aggregate indicator of economic knowledge,
which in section 5 is put it in relation to socio-economic characteristics and opinions of the
respondents. Concluding remarks are presented in Section 6.
2. The ISTAT Consumers survey
2.1 The Sample and the questionnaire
The Institute for cyclical Studies (ISCO) started a survey on Italian consumers in 1973, in the
framework of an EU-wide project harmonized by the European Commission; in the period 1999-2010
the survey has been administered by the Institute for Studies and Economic Analyses (ISAE), and
since January 2011 is carried out by ISTAT. The survey consists of qualitative questions on the
personal situation of the consumer and the country. Questions allow five possible answers, ranging
from strongly positive to strongly negative; results are usually expressed as weighted balances of
positive and negative replies. The survey is conducted with a Computer Assisted Telephone
Interviewing (CATI) system; it is based on a monthly sample of 2.000 Italian consumers, changing
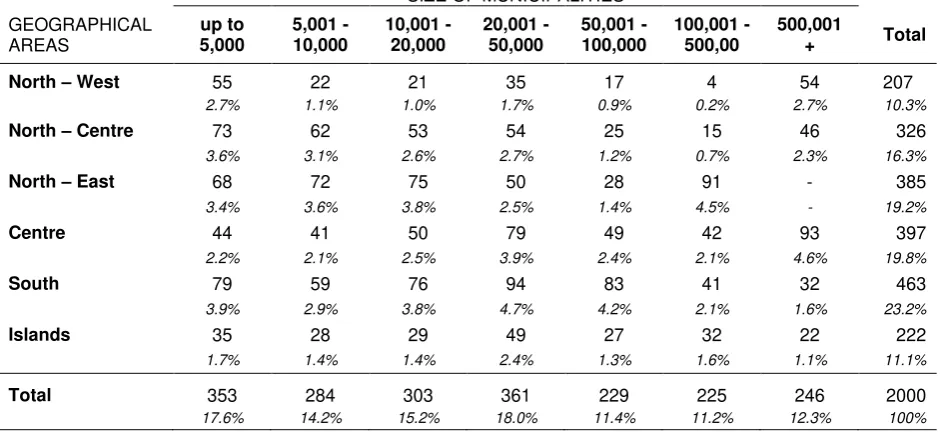
each month, for a total of 24.000 persons interviewed per year. The sample is extracted from the
public telephone book registers and selected on the basis of a two-stage technique: in the first step, it
is stratified according to zone of residence and size of municipalities (see table 1); the second stage is
based on the selection of a specific consumer within the household selected in the first step. This
selection is based on quota sampling according to gender (48,5% males, 51,5% females). Quota
sampling ensures that sample size is always equal to the target, substituting non response with other
consumers extracted from the sample; the response rate of the survey, calculated as the ratio among
the number of the respondents and that of total monthly contacts, has been equal to roughly 66% in
recent years. In order to take into account possible selection biases and changes over time in the
households composition and age structure of the sample, in this paper we will use a system of
4 Table 1 - The sample of the consumers’ survey
SIZE OF MUNICIPALITIES GEOGRAPHICAL
AREAS
up to 5,000
5,001 - 10,000
10,001 - 20,000
20,001 - 50,000
50,001 - 100,000
100,001 - 500,00
500,001
+ Total North – West 55 22 21 35 17 4 54 207
2.7% 1.1% 1.0% 1.7% 0.9% 0.2% 2.7% 10.3%
North – Centre 73 62 53 54 25 15 46 326
3.6% 3.1% 2.6% 2.7% 1.2% 0.7% 2.3% 16.3%
North – East 68 72 75 50 28 91 - 385
3.4% 3.6% 3.8% 2.5% 1.4% 4.5% - 19.2%
Centre 44 41 50 79 49 42 93 397
2.2% 2.1% 2.5% 3.9% 2.4% 2.1% 4.6% 19.8%
South 79 59 76 94 83 41 32 463
3.9% 2.9% 3.8% 4.7% 4.2% 2.1% 1.6% 23.2%
Islands 35 28 29 49 27 32 22 222
1.7% 1.4% 1.4% 2.4% 1.3% 1.6% 1.1% 11.1%
Total 353 284 303 361 229 225 246 2000
17.6% 14.2% 15.2% 18.0% 11.4% 11.2% 12.3% 100%
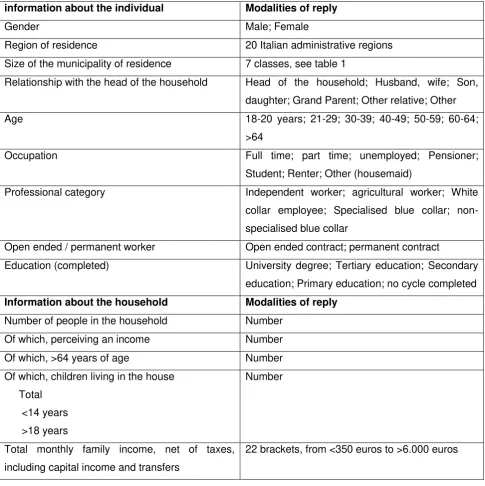
The first part of the questionnaire provides structural information about the consumer and
his/her household, including age, gender, the area of residence, level of education and working status
of the respondent (see table 2); the second part gathers consumers opinions on the general economic
situation of the country (including questions on unemployment and price dynamics) and on that of the
economic conditions of the household and of the individual consumer. Moreover, the survey asks
Italian consumers about their income: obtaining a reliable measure of income is usually problematic in
surveys administered with our methodology. In order to reduce the probability of missing data, the
respondent is asked to assign family income to one out of 22 classes, rather than providing a precise
5
Table 2 – Structural information about the individual and the household
information about the individual Modalities of reply
Gender Male; Female
Region of residence 20 Italian administrative regions
Size of the municipality of residence 7 classes, see table 1
Relationship with the head of the household Head of the household; Husband, wife; Son,
daughter; Grand Parent; Other relative; Other
Age 18-20 years; 21-29; 30-39; 40-49; 50-59; 60-64;
>64
Occupation Full time; part time; unemployed; Pensioner;
Student; Renter; Other (housemaid)
Professional category Independent worker; agricultural worker; White
collar employee; Specialised blue collar;
non-specialised blue collar
Open ended / permanent worker Open ended contract; permanent contract
Education (completed) University degree; Tertiary education; Secondary
education; Primary education; no cycle completed
Information about the household Modalities of reply
Number of people in the household Number
Of which, perceiving an income Number
Of which, >64 years of age Number
Of which, children living in the house
Total
<14 years
>18 years
Number
Total monthly family income, net of taxes,
including capital income and transfers
22 brackets, from <350 euros to >6.000 euros
2.2 The knowledge questionnaire
The first survey on the knowledge of Italian consumers about economic data has been
administered in 2007 in close collaboration between the former Institute of Studies and Economic
Analyses (ISAE) and the OECD Statistics Department; the survey has become yearly since 2009 and
6
questionnaire). The main goal is to verify the degree of knowledge of Italian consumers about the
recent developments – as registered by official statistics – of key economic variables such as GDP growth, inflation and the unemployment rate. Every question contains three core elements: a brief
definition of the key statistical variable, a reference to the agency responsible for its publication and a
question about the most recently published figure. Participants may choose to: 1) answer, 2) indicate
that they do not know the exact figure, or 3) refuse to answer.
Failure to report official data could imply that participants are not aware of the most recent
figure or that they do not know it, possibly because they have not recently heard about it in the media.
In this respect, a scarce knowledge of the most recent data associated with a general knowledge of
the phenomenon may imply a process of “staggering updates”, in which people infrequently update their knowledge because of its high cost and relatively low return. On the other hand, if the consumer
has not recently heard about official data releases, he/she may well be considered to be unaware of
the existence of such data and of its use. Following Curtin (2008), in order to try to distinguish among
these two cases, a follow-up question was introduced in the 2009 and 2012 surveys for each of the
previous questions, asking if the consumer has recently heard of a public announcement concerning
official statistics on GDP, inflation and the unemployment rate.
The questionnaire also collects answers about the importance of being informed on such
issues, asking about the desire to be more informed (if any), and the media channels used to acquire
information (possible media considered in the question are the television; radio; internet; newspapers
and magazines; scientific publications; contacts with friends and relatives, with experts and
politicians). Two further questions ask for an assessment on the quality of the economic information
provided by the media and the quality and reliability of official statistics. Indeed, a previous study
based on the Eurobarometer survey (Papacostas, 2008) has shown that there is a significant
relationship among trust in official statistics and trust in the transparency of political decisions,
confirming the important role of sound and accountable statistics in modern democracies. Finally the
questionnaire investigates whether the data are used in making strategic decisions about consumption
and saving.
3. Aggregate results
According to the ”rational inattention” approach, citizens follow more closely available information when they are perceived to be particularly relevant; in this sense, it is possible to assume
(Curtin, 2008) that the recent crisis started in 2008 may have generated an increased sensibility to
7
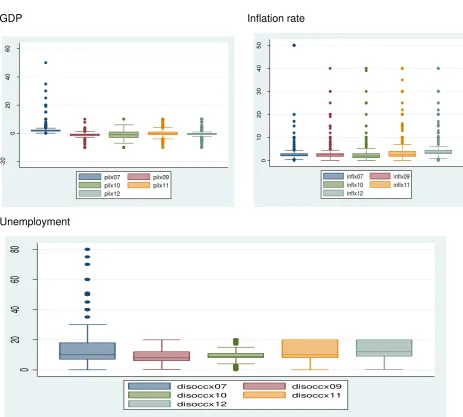
the Box-plot distribution of quantitative replies about the subjective knowledge on the statistics of
interest; the box represents the answers' distribution around the median value (represented with a
continuous line within the box), distinguishing among the answers comprised between the 75th and
and 25th percentile (respectively, the upper and lower margin of the box), answers immediately below
and above the threshold (answers comprised within the segments above and below the threshold) and
[image:8.595.60.524.256.673.2]outliers, represented as dots.
Figure 1 – Distribution of the answers
GDP Inflation rate
-2
0
0
20
40
60
pilx07 pilx09
pilx10 pilx11
pilx12
0
10
20
30
40
50
inflx07 inflx09
inflx10 inflx11
inflx12
Unemployment
0
20
40
60
80
disoccx07 disoccx09
disoccx10 disoccx11
8
Indeed, public knowledge about GDP and the unemployment rate appears to get better over
the years, with a decrease in the number of outliers; moreover, in the case of the answers about GDP
growth, in the last two years the 25th and 75th percentiles are much closer to each other, a result that
may be interpreted as a decrease in the level of uncertainty about this variable. On the other hand,
public knowledge about inflation does not seem to have changed much over the years: outliers remain
much more frequent than for the other two variables, and the inter-quartile difference remains broadly
stable. Indeed, it may be considered that during the crisis attention of the media and the general public
was rather focussed on growth and the unemployment rate than on inflation, and in this sense the
latter result may still bill interpreted as preliminary evidence of a “rational inattentive” behaviour of Italian consumers during the crisis.
Further evidence in this sense may come from the analysis of aggregate survey results shown
in table 3. Response rates vary between a minimum of 17% for the question about inflation in 2010 to
a peak of 44% for the question about the unemployment rate in 2012. Looking at the data for the 2009
and 2012 surveys, among the non-respondents those appearing to be inattentive rather than
9 Table 3 – Knowledge about economic indicators
GDP Inflation
2007 2009 2010 2011 2012 2007 2009 2010 2011 2012
Response rates 26% 23% 20% 34% 34% 32% 24% 17% 26% 29%
Don't know 72% 73% 79% 64% 65% 66% 74% 73% 62% 64%
of which: I have heard about it, but I do no remember exact figures
43% 42% 49% 43%
I haven't heard about it recently
28% 22% 23% 20%
Don't know
2% 1% 1% 1%
Refuse to answer 3% 4% 1% 3% 2% 2% 3% 9% 12% 7%
Average 2.7 -1.4 -1.0 0.1 -0.4 4.7 3.2 3.5 4.7 5.6
Median value 2.0 -1.0 -1.0 0.0 0.0 2.4 2.5 2.0 2.4 3.3
First quartile 1.5 -1.8 -3.0 -1.0 -1.0 2.0 1.8 1.2 1.8 3.0
Third Quartile 2.4 -0.5 1.0 1.0 0.0 3.0 3.0 3.0 4.0 4.5
Standard deviation 3.7 2.2 3.2 3.0 3.1 8.9 3.5 6.3 6.4 7.1 Official data 1.9 (1) -1.0 (2) -5 (3) 1,3 (4) 0,4 (5) 1.8 (6) 1.6 (7) 1.4 (8) 2,4 (9) 3,3 (10)
Unemployment
2007 2009 2010 2011 2012
Response rates 31% 22% 27% 39% 44%
Don't know 66% 75% 66% 55% 53%
of which: I have heard about it, but I do no remember exact figures
50% 42%
I haven't heard about it recently
24% 11%
Don't know
1% 1%
Refuse to answer 3% 3% 7% 6% 3%
Average 14.6 10.0 10.2 11.8 13.4
Median value 10.0 8.0 9.0 10.0 12.0 First quartile 7.0 6.0 8.0 8.0 9.0 Third Quartile 18.0 12.0 11.0 20.0 20.0 Standard deviation 13.0 5.7 4.6 6.2 5.7
10
March 2009; (13) IV Quarter 2009, available in April 2010; (14) January 2011, available in March 2011; (15) January 2012, available In March 2012.
about the data without being able to report the latest figure vary between 42% and 50%, while the
share of those not having heard at all about the data recently (i.e. those that we deem not having any
knowledge of the statistic at hand) varies between 11% for the unemployment rate in 2012 and 20%
for data about GDP growth in 2009.
As shown in fig. 1, the distribution of the replies is often characterised by the presence of
relevant outliers: hence, the median value is a better characterisation of the distribution than the
mean. On the basis of the median values, Italian consumers show a quite adequate knowledge of
GDP growth in years 2006 and 2008, strongly underestimating the severity of the crisis in 2009, and
resulting instead remarkably “pessimists” for 2010 and 2011. Median values for replies about the unemployment rate is on the other hand always above actual values; for inflation, median replies are
above the actual figures in years 2006-2009, while being broadly in line and coincident with the actual
rate respectively in 2010 and 2011.
Tables 4-8 report the results for the others questions comprised in the questionnaire. More
specifically, table 4 reports the opinions of respondents about the quality of the public debate about
these data, and on the reliability of official statistics (data being available for the period 2010-2012 in
[image:11.595.57.543.484.676.2]the first case, and only for the years 2009 and 2012 in the second).
Table 4 – Quality and reliability of economic information
In your opinion, during the recent economic and financial crisis, the quality and reliability of the information on the economic situation published by the media and the public debate on these issues has been: Good/Sufficient/Bad?
Generally speaking, do you consider that the official statistics we have talked about (Inflation, GDP, Unemployment rate) are reliable?
2010 2011 2012 2009 2012
Good 8.5 7.2 14.8 Yes 59.4 60.4
Sufficient 32.5 36.1 39.4
Bad 47.3 43.9 38.4 No 33.9 33.2
Don't know 11.0 10.2 6.5 Don’t know 6.7 6.4
Refuse to answer 0.7 2.6 0.8
Generally speaking, the relative increase in knowledge that has emerged from the analysis of
11
official statistics in general: however, the share of respondents deeming that the quality and reliability
of information published by the media is “good” is still largely below that of those considering it as
“bad”. On the other hand, a fairly stable 60% of respondents in 2010 and 2012 consider that official
statistics about GDP, inflation and unemployment are fairly reliable, and only slightly more than 33%
consider them as unreliable.
Table 5 reports the relative importance that the respondents assign to economic information,
together with the desire of being more informed. The survey shows an increase of the importance
assigned by the respondents to economic data, the share of those deeming they are very or fairly
important rising from 71% to 74%, with also a relative increase of those deeming that the data are
“very important” with respect to those judging them as “fairly important”. Indeed, in 2012 the increased importance of economic information also stimulates the desire to be more informed, expressed by
[image:12.595.53.420.344.580.2]almost half of the sample.
Table 5 – Importance and desire of being informed for Italian citizens
Importance of being informed
2007 2009 2011 2012
Very important Na 23.0 30.4 34.0
Fairly important Na 48.2 39.4 40.1
Not important, nor unimportant Na 17.7 14.7 14.8
Relatively not important Na 4.7 5.0 4.8
Not important at all Na 5.3 5.6 4.7
Don't know/no opinion Na 0.9 4.8 1.6
Desire of being more informed
Yes 51.5 40.7 40.6 46.6
No 43.8 55.6 52.5 51.2
Don't know 4.7 3.7 6.9 2:1
Moreover, as shown in table 6, in the last two years the share of people using (“a lot” or “a bit”) this kind of information as a support for relevant decisions concerning consumption and savings
behaviour has significantly risen, passing from 7% to over 15%; on the other hand, those not using at
all economic information has fallen from 77% of the sample in 2010 to 61% in 2012. Overall, the data
seem to suggest that during the crisis the increase importance of economic data has gone hand in
hand with a better assessment on the quality of the information, an increased desire to be informed
12 Table 6 - Use of information for strategic decisions
In your private life, do you use the information we have talked about for your economic decisions about financial investments, relevant purchases and others?
2010 2011 2012
A lot 0.9 1.0 2.1
A bit 6.0 14.8 13.2
Not much 10.4 20.2 21.2
Not at all 76.9 56.9 61.1
Don't know 4.6 4.3 1.9
Refuse to answer 1.0 2.7 0.5
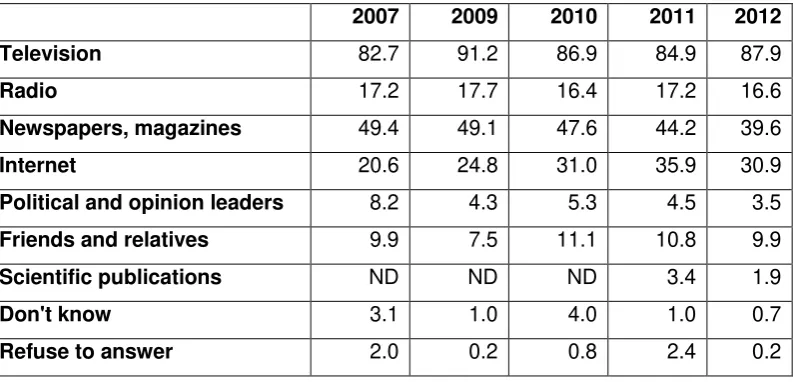
Finally, Table 7 contains the results concerning the media mostly used to gather this kind of
information: television remains by and large the most important channel to acquire information, being
used by almost 90% of the sample. In five years, the importance of the internet has grown from 20%
to over 30% (albeit a decrease from 35% in 2011); newspapers and magazines remain very important
for almost 40% of the sample. More “private” channels of information as the contacts with friends and relatives are important for around 10% of the sample, a minor share (2% in 2012) using also scientific
[image:13.595.60.457.505.696.2]press in order to acquire information about the economic data.
Table 7 – Information channels
2007 2009 2010 2011 2012
Television 82.7 91.2 86.9 84.9 87.9
Radio 17.2 17.7 16.4 17.2 16.6
Newspapers, magazines 49.4 49.1 47.6 44.2 39.6
Internet 20.6 24.8 31.0 35.9 30.9
Political and opinion leaders 8.2 4.3 5.3 4.5 3.5
Friends and relatives 9.9 7.5 11.1 10.8 9.9
Scientific publications ND ND ND 3.4 1.9
Don't know 3.1 1.0 4.0 1.0 0.7
13
4. The Knowledge Score
To assess the overall individual knowledge of statistical data on the basis of the answers to our
survey, we adopt the methodology already introduced in Fullone et al. (2008) and D'Urzo et al. (2009).
For each question we first calculate the absolute value of the relative error with respect to the official
data available at the moment of the interview and then compute the average of the relative errors for
the three questions, where a higher score indicates a lower knowledge of economic data:
Mean Absolute Relative Error (MARE)i =
3
3
1 ,
J j
j j
i
ISTAT
ISTAT
R
(1)
where Rij is the individual i reply to each question j and ISTATi is the official data pertaining to question
j.
Hence we calculate two different raw scores for each survey: in order to fully exploit the
information content of the surveys, the first score is calculated by considering also the “don’t know”
answers and excluding only those refusing to respond. To those answering “don’t know”, we impute a
score equal to the maximum value reached by the score of those having answered the question,
augmented by a unit: in other words, we “penalise” those answering of not knowing about the statistic under discussion assigning them the maximum error committed by those having indeed provided a
reply, augmented by a unit (we only exclude those having replied “don’t know” to all the three questions, i.e. the respondent should have answered at least one question to be considered in the
score). In this case we have a total of 4.457 observations available for the analysis.
The second score is calculated using also the information provided in the follow-up questions
asking whether consumers have publicly heard of such official statistics; in this case, data are
available for 2009 and 2012 only. We interpret this evidence as a measure of “rational inattention”, i.e. we consider that those not being able to answer but having heard about the indicator of interest are
subject to staggered updates, either because of the high cost or because of the low benefit of
acquiring information. For this reason, we assign them a score equal to the maximum score available
augmented by one; furthermore, we augment the maximum score by two units to those reporting that
they have not heard recently about such indicator(s). Those refusing to answer are still excluded from
14
In the following, we shall use a linear transformation of individual MAREs, standardising them
with respect to the mean and standard deviation of their distribution and calculating two z-scores,
having the advantage of holding useful linear mathematical properties:
Z-scorei = (MAREi– Mean(MARE))/Std(MARE) (2)
5. An econometric model for knowledge
In this section, we address the relationship between knowledge of economic data,
socio-demographic characteristics of the respondent, his/her desire and willingness of being informed and
the channels used to acquire such information. More specifically, we first look at the propensity to
answer the knowledge questions and hence the level of knowledge reached by those having actually
replied to at least one of the questions. In the first case our dependent variable is defined as an ordinal
categorical variable assuming values comprised between 0 (if the respondent has not answered to
any of the three questions) and 3 (in case she has answered all the three questions); the two
alternative definition of the z-score reported in (2) are then considered as dependent variable in the
second case. More specifically, we use the two following models to estimate the probability of
answering to the knowledge question and the knowledge score:
)
'
(
)
|
Pr(
q
it
x
z
it
F
z
it(3)
Kij = f (zit)+ ui
(4)In (3), variable qit takes values comprised between 0 and 3, F, is the cumulative distribution
function assumed to be distributed as a standard normal; in (4), K is the Z-score defined in (2). In both
(3) and (4), Zit is the vector of controls: more specifically, we considered information extracted from the
standard ISTAT consumers survey concerning gender (M/F), age (4 classes, from <30 years to 65+),
zone of residence (North West, North East, Centre and South), number of inhabitants of the city of
residence (5 categories from small town with less than 5,000 inhabitants to big cities with more than
500,000 people), employment status (4 categories, employees and self-employed, unemployed and
inactive people), level of education (3 classes, ranging from lower intermediate to University level) and
income quartiles. When available, we also include in the regressions the desire to be informed, the
source of information used for acquiring statistical data and the level of trust in official statistics. We
finally add a time dummy in order to test for possible differences in knowledge among the various
15
Squares with endogenous variables as instruments. In both cases we use individual probability
weights, as described in Fullone and Martelli (2008); unobserved error terms are assumed to be
heteroschedastic with robust methods.
5.1. Estimation results: the probability of answering knowledge questions
Table 8 reports estimation results for model (3). The first 4 columns report the results for the
whole sample; columns 5-8 the results obtained also using information on quality and use of statistical
information (available only since 2010) are used; columns 9-12 those obtained taking into account the
importance and desire to be informed (available for the whole sample, but 2010). In the estimation, we
normalise with respect to male respondents, being independent workers, in the first income quartile,
under 30 years of age, living in the North West with the lowest education attainment, deeming (when
these opinions are available) that economic information is not important, of bad quality, not used and
that they do not want to be more informed on these issues.
Ordered probit estimations are able to explain around 11% of total variability of individual replies.
Considering a confidence level of 5%, probability to reply to the knowledge questions is higher:
o for independent workers;
o the higher the level of education and the age of the respondent;
o the higher the level of income (even if this effect tends to disappear if we also consider
information about quality of information and willingness to be informed);
o for men with respect to women4;
o for those living in the North of the country;
o the higher the number of inhabitants in the city the respondent lives in;
o for those using other information channels on top of TV
If we add the consideration of opinion variables, the probability to reply to the knowledge
questions is also higher for those:
o using economic information in their decision-making process;
o deeming important to be informed on these issues;
o willing to be more informed on these issues.
16
Table 8 – Probability to reply, socio-demographics controls and the willingness to be informed
Whole sample Waves: 2010, 2011, 2012 Waves: 2007, 2009, 2011 and 2012
Variables Coeff Std t P Coeff Std t p Coeff Std t p Socio-demographic variables
Professional category (control group: independent workers)
Dependent workers -0.33 0.07 -4.81 0.00 -0.37 0.10 -3.78 0.00 -0.36 0.07 -4.92 0.00 Unemployed -0.31 0.13 -2.39 0.02 -0.36 0.18 -2.03 0.04 -0.39 0.14 -2.76 0.01 Inactive -0.33 0.08 -4.14 0.00 -0.42 0.11 -3.64 0.00 -0.33 0.08 -3.93 0.00
Age (control group:18-29 years)
30-49 years 0.14 0.08 1.71 0.09 0.16 0.13 1.27 0.20 0.23 0.09 2.70 0.01 50-65 years 0.35 0.08 4.34 0.00 0.42 0.13 3.35 0.00 0.42 0.09 4.97 0.00 > 65 years 0.07 0.09 0.74 0.46 0.25 0.14 1.87 0.06 0.17 0.09 1.76 0.08 Women -0.53 0.04 -13.25 0.00 -0.52 0.06 -9.25 0.00 -0.53 0.04 -12.12 0.00
Number of inhabitants (control group: < 5000 inhabitants)
From 5.001 to 20th 0.13 0.06 2.33 0.02 0.13 0.08 1.61 0.11 0.15 0.06 2.43 0.02 From 20 to 100th 0.12 0.06 2.11 0.04 0.10 0.08 1.22 0.22 0.13 0.06 2.03 0.04 From 100 to 500th 0.20 0.07 2.75 0.01 0.18 0.10 1.85 0.07 0.22 0.08 2.77 0.01 > 500th 0.24 0.07 3.20 0.00 0.24 0.10 2.39 0.02 0.22 0.08 2.73 0.01
Area of residence (Control group: north west)
North East -0.03 0.06 -0.56 0.57 0.00 0.08 0.03 0.97 -0.02 0.06 -0.35 0.72 Centre -0.17 0.06 -3.07 0.00 -0.15 0.08 -1.81 0.07 -0.18 0.06 -2.89 0.00 South and Islands -0.18 0.05 -3.61 0.00 -0.14 0.07 -2.02 0.04 -0.20 0.06 -3.52 0.00
Level of education (Control group: primary school or less)
Secondary School 0.39 0.05 8.33 0.00 0.29 0.07 4.30 0.00 0.37 0.05 7.33 0.00 University 0.64 0.07 9.17 0.00 0.57 0.10 5.44 0.00 0.61 0.07 8.20 0.00
Income (Control group: first quartile)
Second quartile 0.06 0.06 1.03 0.31 -0.06 0.08 -0.76 0.45 0.00 0.07 0.05 0.96 Third quartile 0.19 0.06 3.04 0.00 0.14 0.08 1.60 0.11 0.13 0.07 1.93 0.05 Fourth quartile 0.21 0.07 3.11 0.00 0.15 0.09 1.68 0.09 0.18 0.08 2.36 0.02
Information Channels
TV only -0.07 0.07 -0.92 0.36 0.10 0.10 1.01 0.31 -0.06 0.08 -0.82 0.42 Radio 0.13 0.05 2.55 0.01 0.19 0.07 2.72 0.01 0.07 0.06 1.18 0.24 Newsp., magazines 0.32 0.04 8.15 0.00 0.28 0.06 4.92 0.00 0.28 0.04 6.30 0.00 Internet 0.26 0.05 5.07 0.00 0.26 0.07 3.68 0.00 0.23 0.06 4.03 0.00 Opinion leaders 0.47 0.08 6.08 0.00 0.41 0.11 3.85 0.00 0.38 0.09 4.25 0.00 Friends, relatives 0.20 0.06 3.03 0.00 0.25 0.08 2.95 0.00 0.15 0.07 2.07 0.04
Reliability, use and desire to be informed
17
Good 0.00 0.09 0.06 0.96
Sufficient 0.06 0.06 0.99 0.32
Use of statistical information (Control group: no use)
Use information 0.54 0.06 9.26 0.00
Importance of statistical information (control group: not important)
Important 0.37 0.10 3.76 0.00
Desire of more information (no desire)
Desire 0.37 0.04 8.30 0.00
Time (2007)
2009 -0.19 0.05 -3.45 0.00 0.14 0.10 1.44 0.15 2010 -0.30 0.06 -5.10 0.00 (na)
2011 0.26 0.06 4.47 0.00 0.45 0.07 6.61 0.00 0.61 0.10 6.19 0.00 2012 0.44 0.06 7.66 0.00 0.59 0.07 8.88 0.00 0.75 0.10 7.61 0.00 Number of observations 7198 3920 5845
R2 0.11 0.12 0.11
No effect is found for the opinion on the quality of the public debate on the media about
economic information. Looking at the time dummies, probability of reply is systematically higher in
2011-2012 with respect to the previous years, a possible evidence of an increase in the importance of
economic information after the crisis and, more generally, of a greater impact of this kind of data in the
public debate and the media in the last few years.
5.2. Estimation results: the knowledge score
In the final step, we looked at the relationship among the quality of the replies and the same
control variables used in the previous estimation. Table 9-10 report the results obtained from the
2Stage Least-Squares estimations considering alternatively the two different definition of the
knowledge score described in session 4. Once estimating the model for the whole sample, and hence
without considering the follow up questions available only in 2009 and 2012, the number of available
observations vary between 3.345 and 2.038 (table 9), depending on the availability of the controls
used in the analysis. We use the same normalisations adopted in table 8: therefore, the constant term
may be interpreted as the average z-score for the control group, the coefficients of the various
dummies representing – if significant – the increase/decrease in knowledge associated with the specific characteristic at hand.
Knowledge is higher (i.e. the z-score is lower) for male independent workers, aged 30 or more,
18
apart from television (however, private information from friends and relatives does not accrue to the
average level of knowledge). Also, those willing to be more informed about these issues, and using
this kind of information in their decision making process, have a better knowledge than the average.
Knowledge is also higher in the last two waves of the survey. On the other hand, no significant
differences in the level of knowledge is found according to the number of inhabitants of the
municipality and its location, the level of household income and the opinions on the quality of the
media debate and the importance assigned to this kind of information. Overall, the regression explains
around 15% of the total individual variability of knowledge levels and results seem to be quite robust
across different specification of the control variables and over time.
Finally, Table 10 presents the results obtained considering the score calculated including also
replies to the follow up question administered in the 2009 and 2011 waves; in this case, only 1.357
observations are available for the estimation and the R2 of the regression is equal to 0.21. The
estimates broadly confirm the evidence already emerged: knowledge increases with age, education
and the use of other channel of information than only television; men appear to be better informed with
respect to women. The effect of the zone and amplitude of the municipality of residence is not
significant, as that of the professional category and income. Moreover, knowledge is higher when the
19
Table 9 – Individual knowledge, socio-demographics controls and the willingness to be informed
Whole sample Waves: 2010, 2011 and 2012 Waves: 2009, 2011 and 2012
Variables Coeff Std t p Coeff Std t p Coeff Std t p Constant term 0.36 0.16 2.18 0.03 0.40 0.22 1.82 0.07 0.69 0.21 3.31 0.00
Socio-demographic variables
Professional category (control group: independent workers)
Dependent workers 0.20 0.68 2.92 0.00 0.22 0.09 2.51 0.01 0.16 0.07 2.27 0.02 Unemployed 0.31 0.15 2.06 0.04 0.43 0.20 2.16 0.03 0.32 0.15 2.12 0.03 Inactive 0.19 0.08 2.38 0.02 0.23 0.11 2.10 0.04 0.16 0.09 1.91 0.06
Age (control group:18-29 years)
30-49 years -0.26 0.09 -2.92 0.00 -0.22 0.13 -1.64 0.10 -0.34 0.09 -3.72 0.00 50-65 years -0.47 0.09 -5.26 0.00 -0.39 0.13 -3.05 0.00 -0.51 0.09 -5.58 0.00 > 65 years -0.38 0.10 -3.87 0.00 -0.37 0.14 -2.62 0.01 -0.46 0.10 -4.48 0.00 Women 0.43 0.05 9.25 0.00 0.38 0.06 5.94 0.00 0.46 0.05 9.25 0.00
Number of inhabitants (control group: < 5000 inhabitants)
From 5.001 to 20th 0.02 0.07 0.24 0.81 0.00 0.09 -0.05 0.96 0.03 0.07 0.47 0.64 From 20 to 100th 0.04 0.07 0.55 0.58 -0.01 0.09 -0.07 0.95 0.06 0.07 0.77 0.44 From 100 to 500th 0.02 0.08 0.29 0.78 0.07 0.10 0.73 0.47 0.03 0.08 0.37 0.71 > 500th -0.05 0.08 -0.61 0.55 0.08 0.12 0.69 0.49 -0.06 0.09 -0.68 0.50
Area of residence (Control group: north west)
North East 0.02 0.07 0.32 0.75 0.05 0.09 0.57 0.57 -0.03 0.07 -0.45 0.65 Centre 0.06 0.07 0.99 0.32 0.03 0.09 0.34 0.73 0.08 0.07 1.15 0.25 South and Islands 0.09 0.06 1.57 0.12 0.09 0.08 1.15 0.25 0.07 0.06 1.04 0.30
Level of education (Control group: primary school or less)
Secondary School -0.28 0.05 -5.62 0.00 -0.28 0.07 -4.04 0.00 -0.25 0.05 -4.66 0.00 University -0.47 0.07 -6.86 0.00 -0.58 0.09 -6.18 0.00 -0.40 0.07 -5.63 0.00
Income (Control group: first quartile
Second quartile 0.14 0.07 1.92 0.06 0.26 0.10 2.74 0.01 0.16 0.08 2.13 0.03 Third quartile 0.05 0.07 0.75 0.45 0.14 0.09 1.50 0.13 0.09 0.08 1.16 0.24 Fourth quartile 0.11 0.08 1.52 0.13 0.22 0.10 2.31 0.02 0.12 0.08 1.53 0.13
Information Channels
20
Reliability, use and desire to be informed
Quality of information (Control group: bad)
Good 0.06 0.08 0.68 0.50
Sufficient -0.01 0.06 -0.11 0.91
Use of statistical information (Control group: no use)
Use information -0.31 0.06 -5.28 0.00
Importance of statistical information (control group: not important)
Important -0.20 0.13 -1.49 0.14
Desire of more information (no desire)
Desire -0.25 0.05 -5.31 0.00
Time
2009 0.01 0.07 0.20 0.84 -0.19 0.13 -1.39 0.16 2010 0.05 0.07 0.73 0.46 na
2011 -0.11 0.06 -1.76 0.08 -0.09 0.08 -1.16 0.25 -0.31 0.13 -2.38 0.02 2012 -0.17 0.06 -2.60 0.01 -0.15 0.07 -1.95 0.05 -0.34 0.13 -2.59 0.01
N. of observations 3345 2038 2882
21
Table 10 – Level of individual knowledge (including rational inattentive behaviour), socio-demographics controls and the willingness to be informed
Variables Coeff Std t p
Constant term
Socio-demographic variables
Professional category (control group: independent workers)
Dependent workers 0.13 0.10 1.22 0.22
Unemployed 0.47 0.20 2.35 0.02
Inactive 0.20 0.12 1.61 0.11
Age (control group:18-29 years)
30-49 years -0.29 0.13 -2.27 0.02 50-65 years -0.53 0.13 -4.21 0.00 > 65 years -0.45 0.14 -3.19 0.00
Women 0.46 0.07 6.60 0.00
Number of inhabitants (control group: < 5000 inhabitants)
From 5.001 to 20.000 in. 0.03 0.10 0.34 0.73 From 20 to 100.000 in. 0.05 0.11 0.45 0.66 From 100 to 500.000 in 0.04 0.12 0.29 0.78 > 500.000 inhabitants -0.08 0.12 -0.66 0.51
Area of residence (Control group: north west)
North East -0.04 0.10 -0.40 0.69
Centre 0.16 0.10 1.70 0.09
South and Islands 0.02 0.09 0.17 0.86 Level of education (Control group: primary school or less)
Secondary School -0.27 0.08 -3.55 0.00 University -0.43 0.10 -4.33 0.00
Income (Control group: first quartile
Second quartile 0.18 0.11 1.63 0.10 Third quartile 0.14 0.11 1.29 0.20 Fourth quartile 0.19 0.11 1.71 0.09
Information Channels
TV only -0.03 0.13 -0.21 0.84
Radio 0.00 0.09 0.00 1.00
[image:22.595.58.542.132.731.2]22
Reliability, use and desire to be informed
Quality of information (Control group: bad)
Good Sufficient
Use of statistical information (Control group: no use)
Use information
Importance of statistical information (control group: not important)
Important -0.36 0.09 -4.15 0.00
Desire of more information (no desire)
Desire -0.21 0.07 -3.09 0.00
Time
2012 -0.18 0.07 -2.69 0.01
Number of observations 1357
R2 0.21
6. Conclusions
Surveys performed since 2007 indicate that the level of knowledge of economic data of Italian
consumers is relatively low: response rates are always below the 50% threshold and accuracy of
response is seldom assured. Results available from similar survey worldwide (see for instance Curtin,
2008; 2009, and Papacostas, 2008) show that these findings are similar to those emerging on average
in EU and the US.
The detailed analysis of the data performed in the paper suggests a high variability of the level
of individual knowledge: this finding may be interpreted as a first confirmation of the idea of Carroll
(2006), according to which information propagates trough the society as a virus. In this sense, the first
exposed to the “contagion” of statistical information would be Italian males, aged 30 or more, with higher education, being independent workers and using other channel than only television to acquire
information.
Moreover, according to Reis (2006) and (2009), we can expect that the level of knowledge
would also depend upon information costs and benefits, with consumers that may choose to be
“rational inattentive” to information if it is acquired at high costs or considered to be of relatively low
use in everyday life. Survey results seem to provide confirmation also of this approach: indeed,
knowledge is higher for those deeming that economic information is useful in everyday life decisions
23
importance of private channel of information (contacts with friends and relatives) emerge from the
analysis.
These results may have interesting implications for economic theory, policy makers and
statistical producers alike. From a theoretical point of view, the data support both the Carroll and Reis
approaches to perceptions formation, in both cases providing evidence of deviation from the standard
approach of full rationality. If agents are not always fully rational, possible delays in information
acquisition patterns should be taken into account by policy makers in designing appropriate
interventions. Results provide also very interesting evidence for official statistical agencies: first of all,
it clearly emerges than an increase in the media exposure (as it was the case in the aftermath of the
economic crisis) favors an increase in individual knowledge of the data. Moreover, it also emerges that
in order to ensure a full translation of information available on the markets in effective knowledge, data
should be easily accessible and as close as possible to the demand for information of the general
24
References
Blinder A.S., Krueger, A.B., (2004), “What Does the Public Knows About Economic Policy, and How
Does It Know It?”, NBER Working Paper n. 10787, September, available at
www.nber.org/papers/w10787.pdf.
Bryan M.R., G. Venkatu G. (2001), “The Curiously Different Inflation Perspectives of Men and
Women”, Economic Commentary, Federal Reserve Bank of Cleveland.
Carroll C.D. (2006), “The Epidemiology of Macroeconomics Expectations”, in The Economy as an Evolving Complex System III. Larry Blume and Steven Durlauf (eds.) Oxford University Press.
Curtin R. (2008), “What US Consumers know about Economic Conditions”, in Statistics, Knowledge and Policy 2007: Measuring and Fostering the Progress of Societies, OECD, Paris.
Curtin R. (2009), “What US Consumers Know About the Economy: the Impact of Economic Crisis on Knowledge”, paper presented at the III OECD World Forum on “Measuring the Progress of Societies”, Busan, Republic of Korea, October.
D’Urzo A., Gamba M., Giovannini E., Malgarini M. (2009), “What do Italian Citizens Know About the Progress of their Country? Results from the 2009 ISAE/OECD Survey”, paper presented at the International conference “Monitoring Italy”, ISAE, Rome, 3-4 June, and at the III OECD World Forum on “Measuring the Progress of Societies”, Busan, Republic of Korea, October.
Fullone F., Gamba M., Giovannini E., Malgarini M., (2008), What do Citizens Know About Statistics?
The Results of an OECD/ ISAE Survey on Italian Consumers”, in Statistics, Knowledge and Policy 2007: Measuring and Fostering the Progress of Societies, OECD, Paris.
Fullone F., Martelli B. (2008), “Re-Thinking the ISAE Consumer Survey Processing”, Documento di Lavoro, ISAE n. 92, February.
Giovannini E., J. Oliveira Martins, M. Gamba (2008), “Statistics, Knowledge and governance”, paper presented at the Workshop “Committing Science to Global Development”, Lisbon, 29-30 September.
Papacostas S. (2008), “Special Eurobarometer: European Knowledge on economical indicators”, in
Statistics, Knowledge and Policy 2007: Measuring and Fostering the Progress of Societies, OECD,
Paris.
Reis R. (2006), “Inattentive Consumers”, Journal of Monetary Economics, vol. 53, (8), pp. 1761-1800.
Reis R. (2009), “A sticky information general equilibrium model for policy analysis”, NBER Working
25
Appendix 1
–
Questions included in the
“k
nowledge questionnaire
”
Unemployment rate: As you may know, every quarter the Italian National Institute of Statistics
publishes figures on the unemployment rate in Italy. In other words, every three months
ISTAT officially reports the percentage of people unemployed with respect to the active
population. Can you please tell us the most recent rate of unemployment published by
ISTAT?
Inflation rate: Another important economic indicator that is published by ISTAT on a monthly
basis is the consumer price index, commonly used to calculate the annual inflation rate. Can
you please tell us the most recent rate of inflation published by ISTAT?
GDP growth: ISTAT has recently published figures on all final goods and services produced in Italy in 2008. This figure is known as the Gross Domestic Product (GDP) of the country.
Can you please tell us the percentage of change of the Italian GDP recently published by