Comparison of Search based Techniques for Automated
Test Data Generation
Ruchika Malhotra
Department of Software Engineering Delhi Technological
University
New Delhi, India - 110042
Chand Anand
Department of Software Engineering Delhi Technological
University
New Delhi, India - 110042
Nikita Jain
Department of Software Engineering Delhi Technological
University
New Delhi, India - 110042
Apoorva Mittal
Department of Software Engineering Delhi Technological
University
New Delhi, India - 110042
ABSTRACT
One of the essential parts of the software development process is software testing as it ensures the delivery of a good quality and reliable software. Various techniques and algorithms have been developed to carry out the testing process. This paper deals with utility of the nature based algorithms namely Genetic Algorithm, Ant Colony Optimization algorithm and Artificial Bee Colony algorithm in automatic generation of optimized test suite for a given set of programs. The performance of algorithms is evaluated using various factors such as number of paths covered, number of iterations, number of test cases produced and time taken for generation of test suite. The results of performance analysis concluded that Artificial Bee Colony algorithm is more efficient as compared to other mentioned algorithms and can be employed for optimized test suite generation for various complex programs or software.
General Terms
Measurement, Performance, Experimentation
Keywords
Artificial bee colony (ABC), Ant colony optimization (ACO), Genetic algorithm (GA), Software testing, Automatic Test Suite Generation.
1.
INTRODUCTION
Software development process is carried out with an aim to develop high quality reliable software. Among various phases of the development process, software testing is the most important phase which consumes about 40-50% of the resources available for development. A major portion of software testing[11] involves test data generation as a good test data set ensures an increased probability of detecting faults. The automatic test data generation consists of two main steps: - 1) generation of independent paths from the program graph[11] of the software under test on which the test criterion is to be satisfied and 2) generation of an optimized test suite that ensures maximum path coverage. As the complexity and size of software increases, software testing has become a challenging task. In recent years, research in the field of automatic testing is being encouraged as researchers believe time and cost required for software testing will be reduced significantly if the testing process were automated. The development of methods or techniques in automatic test data generation will appreciably make the software testing process more efficient and robust. The population based algorithms are the ones which work on a set of solutions with the aim of improvising them. Population based algorithms can be grouped as swarm intelligence based algorithms[14] and evolutionary algorithms[14]. Swarm
intelligence deals with population of self-organized individuals who interact with one another and their surroundings. Over the past decade, application of swarm intelligence based algorithms for automated test data generation and optimization problems has been an emerging area of interest. Few examples of swarm intelligence algorithms are Ant Colony Optimization[6,8,13], Particle Swarm Optimization[12], Particle Swarm Inspired Evolutionary Algorithm and Artificial Bee Colony algorithm[4,7,14]. The other group of population based algorithm vis-a-vis evolutionary algorithms has proved to be efficient in finding nearly optimized solutions to various test problems. Genetic algorithm[3,5,9] is one such algorithm. The applications of these algorithms have gained popularity amongst testers for automated test data generation as results show that these algorithms have outperformed the traditional methods.
This paper presents the application of three novel algorithms- ABC, ACO and GA to generate automatic test data. Few programs that are in frequent use of the researchers are taken for experimentation purpose. The paper is organized as follows: Section 2 recapitulates the related work of the study. Section 3 describes the research methodology followed in this study. Section 4 presents the results interpreted from this study. The comparison on the basis of performance is evaluated in section 5. Conclusions drawn from the study are presented in section 6.
2.
RELATED WORK
Lam et al. discussed the Artificial Bee Colony in detail and implemented the algorithm on triangle classifier program to explicate its working. Lam also evaluated the performance of Artificial Bee Colony algorithm with respect to existing algorithms such as ACO, GA and Tabu Search and concluded that ABC was more efficient than other methods.
Ghiduk et al. explained the Genetic Algorithm and empirically evaluated the efficiency of proposed GA compared to Random Testing method by running them on few C++ programs. The results indicated that GA outperformed Random Testing technique in terms of both path coverage and cost. Similar results were seen in a study by Girgis who compared GA and Random Testing by implementing them on 15 small FORTAN programs. Another study by Ghiduk examined the path coverage and test suite generated by ACO algorithm by implementing it on a program using PCTDACO tool. The tool generated test cases automatically using ACO for different paths of program.
Mao et al. compared three algorithms- GA, ACO and Simulated Annealing on the basis of three metrics- average coverage, successful rate and average convergence generation and the results indicated that ACO performed significantly better than the other algorithms taken up in the research. This study compares ACO and GA on the basis of different parameters namely path coverage, number of iterations and time taken for test data generation.
Mala et al. demonstrated the efficiency of ABC algorithm in test suite optimization by implementing it on few academic and industrial test problems and comparing the results with GA. The results indicated that ABC outperformed GA.
3.
RESEARCH METHODOLOGY
In this section the procedure to generate test suite using the three algorithms used in the study is described. The procedure is divided into following stages (i) Independent Path Generation and (ii) Test Suite Optimization.
3.1
Artificial Bee Colony (ABC)
The steps which are followed for test suite generation using ABC are:
Energy sources are produced and initialized for every employed bee.
REPEAT
An energy source is selected by every employed bee from her source list and a neighbour source is identified, then the nectar amount of the source is evaluated.
One of the food sources is selected and evaluated by every onlooker bee from the information shared by the employed bees.
Exhausted energy sources are identified and are swapped with the new ones spotted by scout bees.
The best energy source is determined based on nectar amount and is registered.
UNTIL (requirements are met)
3.2
Ant Colony Optimization (ACO)
The steps which are followed for test suite generation using ACO are:
A random path is selected by an ant to reach the goal state. A pheromone trail is released by the ant on the traversed path.
REPEAT
Another ant selects a path from the repository considering the intensity of the pheromone levels of paths.
The ant increases the pheromone intensity by travelling on a particular path, hence increasing the probability of the selection of the path for the next ant.
UNTIL (requirements are met)
3.3
Genetic Algorithm (GA)
The following describes the steps followed in genetic algorithm:
Initial population is randomly generated for a population size.
Each member of the population is evaluated according to the parameter of fitness of the member, which is determined on the basis of path coverage. REPEAT
The parents are selected from the population by the Roulette Wheel Method.
The offspring is produced using genetic operations : Crossover and Mutation.
The new population generated is evaluated using the fitness parameter.UNTIL (requirements are met)
4.
EXPERIMENTAL EVALUATION AND
RESULT ANALYSIS
This section presents the results obtained from application of ACO, ABC and GA on few C++ programs for test data generation and test suite optimization. First, the overview of each program considered in the study is presented. Then the comparison analysis of the results obtained after experimentation is provided.
3.1 Experimental Setup
This section provides the brief description of the programs used for experiment purpose. 9 such C++ programs have been selected for automated test data generation and optimization activity, which are in frequent use of researchers for experimentation.
• Triangle classifier: The program checks whether the sides of triangle given as inputs form a triangle or not. If they form a triangle, then it classifies the triangle as isosceles, equilateral or scalene.
• Quadratic Equation: The program accepts three inputs and checks whether they can form a quadratic equation or not. If they form a quadratic equation, then it also finds the roots of equation.
• Even-Odd: The program checks whether a number input is even or odd.
• Largest Number: The program accepts three numbers and finds the largest number among them.
• Point w.r.t circle: This program accepts the coordinate of a point in x-y Cartesian plane and also the radius of circle whose centre is at origin. It then checks whether the point lies inside, outside or on the boundary of the circle.
• Prime Number: The program checks whether the number input is prime or not.
• Position of point in x-y Cartesian plane: The program accepts the coordinates of points and determines the quadrant in which the point lies.
• Remainder: The program accepts the dividend and divisor and checks if the remainder is zero or non-zero after division operation is performed.
• Leap Year: The program checks whether a given year is a leap year or not.
• Division of Student: The program accepts three inputs as marks of a student in three different subjects and calculating the average determines the division of the student from five possible categories: first division with distinction, first division, second division, third division or fail.
Table 1: Programs, number of variables and cyclomatic complexity
S.No. of
Programs Program Title
No. of Variables
Cyclomatic Complexity
1 Triangle Classifier 3 8
2 Even-Odd 1 3
3 Quadratic Equation 3 4
4 Largest of three no. 3 3
5
Point lies inside or outside or on the
circle
3 3
6 Remainder 2 3
7 Marks 3 5
8 Point lies in which
quadrant 2 5
9 Leap Year 1 4
3.2 Result Analysis
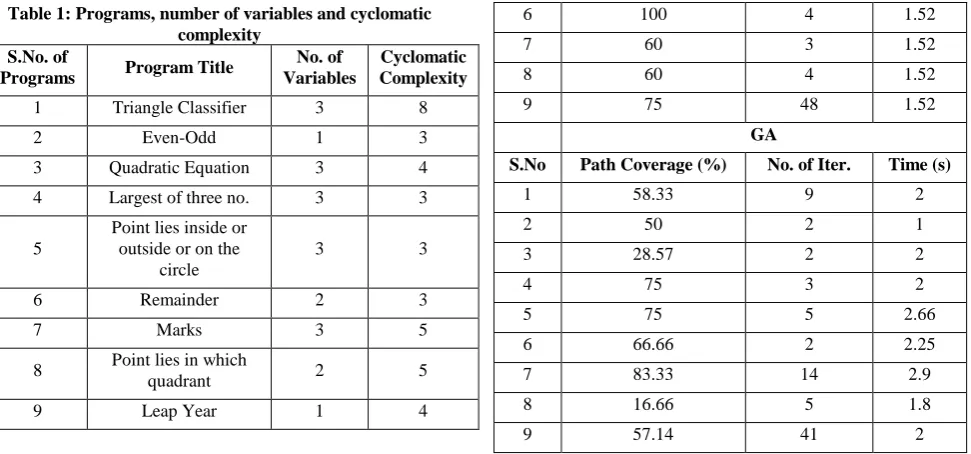
[image:3.595.308.551.419.579.2]Table 2 presents the results obtained after applying path generation and test suite optimization algorithms of ABC, ACO and GA methods to the above mentioned programs. The results are evaluated on the basis of three parameters: - path coverage, number of iterations and time taken for the execution of algorithm on a particular program. Path coverage refers to the percentage of paths covered by the path generation algorithm of the methods. The number of iterations refers to the number of times the test suite optimization algorithm of the methods was run before obtaining the final optimized test suite. Time refers to the time taken by the method to generate the final result i.e. the optimized test suite. The result in Table 2 is analyzed using Figure 1, Figure 2 and Figure 3.
Table 2: Values of the metrics on the application of ABC, ACO and GA to 9 above programs
ABC
S.No Path Coverage (%) No. of Iter. Time (s)
1 90 33 0.06
2 100 10 0.004
3 100 4 0.014
4 100 1 0.004
5 100 1 0.002
6 53 20 0.018
7 86 1 0.007
8 66 20 0.25
9 62.5 45 0.201
ACO
S.No Path Coverage (%) No. of Iter. Time (s)
1 75 18 1.53
2 100 10 1.51
3 50 50 1.52
4 100 11 1.51
5 100 12 1.51
6 100 4 1.52
7 60 3 1.52
8 60 4 1.52
9 75 48 1.52
GA
S.No Path Coverage (%) No. of Iter. Time (s)
1 58.33 9 2
2 50 2 1
3 28.57 2 2
4 75 3 2
5 75 5 2.66
6 66.66 2 2.25
7 83.33 14 2.9
8 16.66 5 1.8
9 57.14 41 2
Figure 1 presents the comparison of ABC, ACO and GA on the basis of percentage of path covered. Figure 1 shows that for all programs except 2, ABC performed better than other two methods. For program 6 and 9, ACO had better path coverage than ABC. GA performed poorly for all the programs. Although in some programs path coverage achieved by ACO and ABC are same but overall ABC was superior as it covered atleast 70% paths in 8 out of 9 programs.
Figure 1: Comparison on the basis of Path Coverage (%)
[image:3.595.50.291.481.758.2]Figure 2: Comparison on the basis of time taken for execution
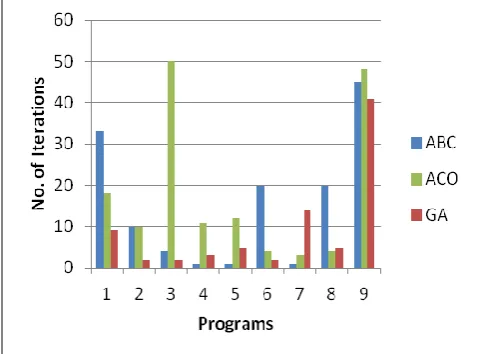
Figure 3 illustrates the comparison of the three algorithms on the basis of the third metric: number of iterations. From Figure 3, we observe that for this parameter, the results are most interesting. GA is seen to have least number of iterations though it was expected that it will generate higher number of generations. This anomaly is accounted by the fact that each generation involves complex selection processes which leads to greater time consumption for even a single generation. Hence even though GA has least value for the given parameter always, it doesn’t lead to better performance in terms of path coverage and execution time. ABC is shown to achieve final result in considerably less number of iterations as compared to ACO for programs 3 to 7. ACO seems to outperform ABC in two programs i.e. 5 and 8.
Figure 3: Comparison on the basis of No of Iterations
From table 2 and Figure 1, Figure2 and Figure 3, we conclude that overall performance of ABC in terms of path coverage, number of iterations needed for execution of algorithm and time taken for automated optimized test data generation is superior compared to ACO and GA.
The main reason for ABC to perform faster is the parallel working behavior of bees i.e. the solutions are obtained through parallel executions. Moreover in ABC, no overhead is required for updating pheromone value, unlike ACO algorithm which takes considerable time in updating pheromone value during test data generation activity. Furthermore the execution of ACO
end whereas solution is selected in ABC by incremental process. In case of GA, there is no such feature of memorization available and also it suffers from a problem of delayed convergence, which in turn increases the execution time. Thus, on the whole ABC has reduced space and time complexity in contrast to ACO and GA.
The performance of GA is affected by increase in mutation rate as it leads to unstable solutions. Also, local optima problem is faced by GA approach which is efficiently handled by ABC method as it implements parallelism. Although ABC is very efficient and robust for generating optimized solutions but large domains and increase in number of equality constraints affects its performance.
5.
CONCLUSION AND FUTURE WORK
In this research study, three novel algorithms- Artificial Bee Colony, Ant Colony Optimization and Genetic Algorithm for generating test data automatically have been discussed. These algorithms have been applied to 9 C++ programs and the results have been evaluated and analyzed to compare the performance of the above mentioned algorithms. From the experiments and results, it can be concluded that ABC is the most efficient optimization algorithm among all the discussed methods due to the incorporation of parallelism and neighbor and employed neighbor production mechanism. The performance of ACO lacked due to the overhead required for updating pheromone value and its sequential execution. GA suffered from problem of generating optimal solutions and no memorization.
As future work, the comparative analysis will be extended to other existing algorithms such as Firefly and Particle Swarm Algorithm. It is also proposed to expand the applicability of ABC algorithm for automated test data generation to other large and complex industrial software. Moreover, the ACO algorithm can be improvised for generating optimized test suite thus, enhancing its performance and efficiency. Performance of ABC can be additionally improved by distributed and parallel processing approach.
REFERENCES
[1] Michalewicz Z., 1999. Genetic Algorithms + Data Structures = Evolution Programs. 3rd Edition, Springer. [2] Srinivas,M. and Patnaik,L.M., 1994. Genetic Algorithms:
a Survey. IEEE Computer.
[3] Lam, S.S.B., Raju,M.L. H.P., Kiran, U., Ch,S. and Srivastav, P.R.,2012.Automated Generation of Independent Paths and Test Suite Optimization Using Artificial Bee Colony. Procedia Engineering 30, 191-200. [4] Ghiduk, A.S. and Girgis, M.R., 2010.Using Genetic
Algorithms and Dominance Concepts for Generating Reduced Test Data. Informatica 34.
[5] Ghiduk, A.S, 2010. A New Software Data-Flow Testing Approach via Ant Colony Algorithms. Universal Journal of Computer Science and Engineering Technology, 64-72. [6] Dahiya, S.S. , Chhabra, J.K. and Kumar, S., 2010. Application of Artificial Bee Colony Algorithm to Software Testing. 21st Australian Software Engineering Conference, IEEE
[image:4.595.54.293.426.603.2][8] Girgis, M.R., 2005. Automatic Test Data Generation for Data Flow Testing Using a Genetic Algorithm. Journal of Universal Computer Science, Vol. 11
[9] Mala, D.J. and Mohan, V.,2009. ABC Tester - Artificial Bee Colony Based Software Test Suite Optimization Approach. IJSE
[10] Yogesh Singh. Software Testing. Cambridge University Press.
[11] Trelea, I.C. 2002. The particle swarm optimization algorithm: convergence analysis and parameter selection. Information Processing Letters
[12] Colorni, A., Dorigo, M. and Maniezzo, V. Distributed Optimization by Ant Colonies. European Conference on Artificial Life, Paris, France.