Munich Personal RePEc Archive
Financial systems and banking crises: An
assessment
Ruiz-Porras, Antonio
5 January 2006
Online at
https://mpra.ub.uni-muenchen.de/168/
Documentos de Trabajo
Departamento de Contabilidad y Finanzas
Campus Ciudad de México
Documento de Trabajo No. 2006/02
FINANCIAL SYSTEMS AND BANKING CRISES:
AN ASSESSMENT
Antonio Ruiz-Porras
El autor es profesor-investigador del Departamento de Contabilidad y Finanzas, División de Negocios, Tecnológico de Monterrey, Campus Ciudad de México.
FINANCIAL SYSTEMS AND BANKING CRISES: AN ASSESSMENT*
(This version: January 5th, 2006)
Antonio Ruiz-Porras**
Accounting and Finance Department
Tecnológico de Monterrey, Campus Ciudad de Mexico
Abstract
Traditionally an old concern among economists has referred to the effects that specific financial systems may have on economic performance. Here we investigate the stylised facts among financial systems and banking crises by using individual and principal-components indicators and sets of OLS regressions. The study relies on a set of banking fragility, financial structure and development indicators for a sample of 47 economies between 1990 and 1997. The stylised facts suggest that financial development is associated to financial systems leaded by stock and securities markets. Furthermore they also suggest that such association is magnified during episodes of borderline or systemic banking crises. Thus what our findings might suggest is that banking crises may encourage financial development and the transformation of financial systems into market-based ones.
JEL Classification: G1, F4, C2
Keywords: Financial systems, banking crises, financial structure, financial development
*
I am grateful to Spiros Bougeas, Richard Disney, Alan Stewart Duncan, Philip Molyneux Jose Antonio Nuñez-Mora and Humberto Valencia-Herrera for valuable suggestions on earlier drafts. However, the usual disclaimer applies.
**
FINANCIAL SYSTEMS AND BANKING CRISES: AN ASESSEMENT
1. Introduction
Traditionally an old concern among economists has referred to the effects that financial systems may have on economic performance. 1 This concern has encouraged the development of theories and empirical research to assess the relative merits of different financial systems for policy purposes.2 Here we investigate the stylised facts among financial systems and banking crises by using international evidence. The study relies on a set of banking fragility, financial structure and development indicators for a sample of 47 economies between 1990 and 1997.
The investigation is motivated by the idea that banking crises may carry repercussions of social nature in addition to the ones of private one. 3 Financial and non financial firms and even the security of the payment system may be affected by banking crises [Freixas and Rochet (1997), Goodhart et al. (1998)]. Particularly we focus on the relationship among financial systems and banking crises because such empirical studies are scarce in spite of the recognition that they may be useful to improve our understanding of the likelihood of banking fragility [Demirguc-Kunt and Detragiache (1998)].4
The study of the stylised facts may be interesting for theoretical purposes. According to some economists, different financial systems provide different incentives and opportunities to share risks and to encourage specific performance goals due to the existence of competition among financial markets and banks [Allen and Gale (2000), (2004)]. However, with exception of the studies of Levine (2002) and Lopez and Spiegel (2002), we do not know about other empirical assessments related to such claim. Thus the characterisation of the stylised facts may provide evidence to develop and support theoretical claims.
1
Such concerns can be traced back to Bagehot (1873) and Fisher (1933). According to the former, Germany had overcome the United Kingdom as an industrial power in the nineteen century due to the relative superiority of the German bank-based financial system with respect to the market-based British one. According to the latter, the severity of the American Great Depression was mainly a result of poorly performing financial markets.
2
See Getler (1988), Santomero (1989), Levine (2002), Beck (2003), Allen and Gale (2000) and (2004) for some surveys and reviews on the theories regarding financial structure and economic performance. Comparative studies of the existing financial systems along the world are Goldsmith (1969), Frankel and Montgomery (1991) Demirguc-Kunt and Levine (1999) and Allen and Gale (2000).
3
Caprio and Klingebiel (1996a) and (1996b) show that the costs that the economies pay due to banking insolvency episodes usually are above 15% of their GDP. Moreover, these costs do not include the ones associated to the exchange-rate crises and economic downturns that usually accompany such episodes.
4
Methodologically, we characterise the stylised facts with assortments of indicators.5 Categorical banking fragility indicators refer to episodes of systemic and borderline banking crises compiled by Caprio and Klingebiel (2002). Data extracted from the database of Beck, Demirguc-Kunt and Levine (2000), are used to build financial structure and development assortments of indicators according to the guidelines of Levine (2002). The assortments include measures of activity, size and efficiency of the intermediaries. Individual and principal-component indicators are used for the empirical assessments.
Our research aims to identify patterns or “stylised facts” that may shed light on the normative properties of different financial systems. We do this by comparing relationships between indicators under different banking conditions. The idea underlying the identification of such patterns is to suggest answers to some of the following questions: What are the main empirical relationships among financial systems and banking crises? How does banking fragility affect the relationships between financial structure and financial development? Which type of implications may be derived from these findings?
Our findings have implications for academic and policy purposes. Specifically the stylised facts suggest that financial development is associated to financial systems leaded by stock and securities markets. Furthermore they also suggest that such association is magnified during episodes of borderline or systemic banking crises. These findings are consistent with the idea that crises have had a significant impact on the historical development of financial systems. Thus what our findings might suggest is that banking crises may encourage financial development and the transformation of financial systems into market-based ones.
The paper is divided in five sections. Section 2 describes the data used in the econometric analyses. Section 3 discusses methodological issues to assess the limits and scope of our findings. Section 4 characterises the stylised facts among financial structure and development with banking fragility. Section 5 summarises and discusses the main findings. Finally the appendix focuses on the principal-component methodology.
2. Financial and banking indicators
Here we describe the financial and banking indicators used in the analysis. We believe this task particularly relevant because of the absence of empirical definitions for financial system features and banking fragility. Thus, before proceeding, we define certain definitions for operative purposes. Specifically, in the following we will refer to financial development as the level of development of both intermediaries and markets, while by financial structure we will mean the degree to which a financial system is based on intermediaries or markets. Banking fragility will mean a situation in which borderline or systemic banking crises are present in an economy.
5
We build the indicators by extracting financial and banking data from two databases. We use panel-data extracted from the cross-country database on financial development and structure [Beck, Demirguc-Kunt and Levine (2000)], to build the financial system indicators. Furthermore, we use data from the database on episodes of borderline and systemic banking crises [Caprio and Klingebiel (2002)], to build qualitative indicators of banking fragility. The main advantage of using these databases is that they allow us to treat consistently the financial and banking system data across economies and across time. 6
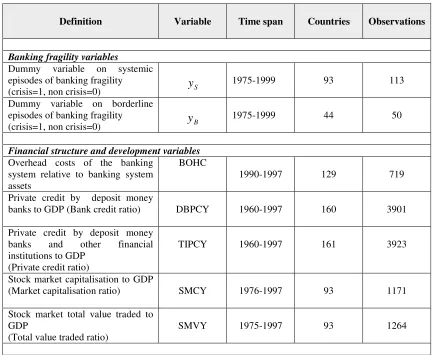
[image:6.612.77.511.246.601.2]The financial and banking data and their main features are summarised in the table:
Table 1. Financial and Banking Data
Definition Variable Time span Countries Observations
Banking fragility variables
Dummy variable on systemic episodes of banking fragility
(crisis=1, non crisis=0) yS
1975-1999 93 113
Dummy variable on borderline episodes of banking fragility
(crisis=1, non crisis=0) yB
1975-1999 44 50
Financial structure and development variables
Overhead costs of the banking system relative to banking system assets
BOHC
1990-1997 129 719
Private credit by deposit money
banks to GDP (Bank credit ratio) DBPCY 1960-1997 160 3901
Private credit by deposit money banks and other financial institutions to GDP
(Private credit ratio)
TIPCY 1960-1997 161 3923
Stock market capitalisation to GDP
(Market capitalisation ratio) SMCY 1976-1997 93 1171
Stock market total value traded to GDP
(Total value traded ratio)
SMVY 1975-1997 93 1264
Notes: The complete financial development and structure database includes statistics on the size, activity and efficiency of various intermediaries (commercial banks, insurance companies, pension funds and non-deposit money banks) and markets (primary equity and primary and secondary bond markets). Regarding the database on banking crises, it comprises of the two variables included here.
6
The sample was built according to data availability. It includes data for Argentina, Australia, Bolivia, Brazil, Barbados, Canada, Switzerland, Chile, Colombia, Costa Rica, Cyprus, Germany, Ecuador, Egypt, Spain, Ghana, Greece, Guatemala, Honduras, Ireland, Jamaica, Jordan, Japan, Kenya, Korea, Morocco, Mexico, Malaysia, Namibia, Nigeria, Netherlands, Norway, New Zealand, Peru, Philippines, Paraguay, El Salvador, Sweden, Thailand, Trinidad and Tobago, Tunisia, Turkey, Taiwan, United States, Venezuela, South Africa and Zimbabwe. Hence, the sample comprises data for 47 economies and 115 banking crises over the period 1990-97.
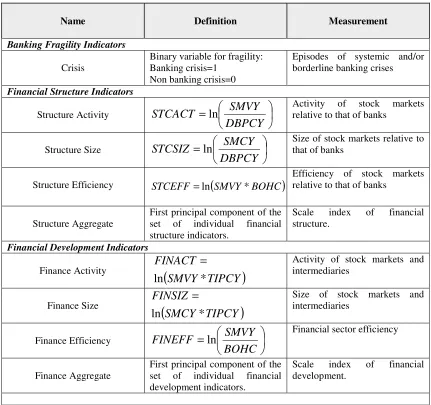
We define seven individual indicators.We follow Demirguc-Kunt and Levine (1999) and Levine (2002) to build two assortments of indicators to analyse the features of financial systems. The assortment of structural indicators contains individual measures of the activity, size and efficiency of stock markets relative to that of banks. The assortment of development indicators contains measures of the activity, size and efficiency of stock markets and banks. The banking fragility indicator is a qualitative variable for borderline and systemic crises that follows the standard convention of the fragility literature [Demirguc-Kunt and Detragiache (1998), and Hardy and Pazarbasioglu (1999)].
The six financial system indicators use different measures to assess the structure and the degree of financial development. The structural assortment is integrated by the Structure-Activity, Structure-Size and Structure-Efficiency indicators. In this assortment market-based financial systems are associated to large values of the indicators while bank-market-based ones are associated to small values. The financial development assortment is integrated by the Finance-Activity, Finance-Size and Finance-Efficiency indicators. In this assortment, financial development is associated to large values of the indicators while underdevelopment is associated to small values.7
Furthermore we build two aggregate indicators to summarise the information content of the assorted indicators. We follow the methodological approach of Levine (2002) to define and construct them using principal-component multivariate methods. More specifically, each aggregate indicator is defined as the first linear combination of the three individual indicators that integrate each assortment. The way in which the aggregate indicators summarise the relevant information is based on proportions of the total variance that are accounted from the individual indicators. [See Appendix for further details]
We use the principal-components methodology to simplify the task to understand the explanatory multivariate data in terms of a smaller number of uncorrelated variables. Intuitively, given that a first principal-component is positively correlated to the each of the individual indicators, it can be interpreted as a measure of what is common to all the variables. Given the lack of empirical definitions for financial development and financial structure, we can interpret the aggregate indicators as indexes of scale for the degree of development and of the relative prominence of markets in the financial system.
7
The set of financial and banking indicators is summarised in the following table:
Table 2. Financial and Banking Indicators
Name Definition Measurement
Banking Fragility Indicators
Crisis
Binary variable for fragility: Banking crisis=1
Non banking crisis=0
Episodes of systemic and/or borderline banking crises
Financial Structure Indicators
Structure Activity =
DBPCY SMVY
STCACT ln Activity relative to that of banks of stock markets
Structure Size =
DBPCY SMCY
STCSIZ ln Size of stock markets relative to that of banks
Structure Efficiency STCEFF=ln
(
SMVY*BOHC)
Efficiency of stock markets relative to that of banks
Structure Aggregate
First principal component of the set of individual financial structure indicators.
Scale index of financial structure.
Financial Development Indicators
Finance Activity
(
SMVY TIPCY)
FINACT
* ln
= Activity of stock markets and intermediaries
Finance Size
(
SMCY TIPCY)
FINSIZ
* ln
= Size of stock markets and
intermediaries
Finance Efficiency =
BOHC SMVY FINEFF ln
Financial sector efficiency
Finance Aggregate
First principal component of the set of individual financial development indicators.
Scale index of financial development.
Notes: Large values of the financial structure indicators are associated to market-based financial systems; small ones to bank-based ones. Large values of the financial development indicators relate to high levels of financial development.
3. Methodological issues on indicators and econometric methodology
explaining the OLS regression approach used to assess the stylised facts among financial systems and banking crises.
We begin by examining the financial structure and development indicators. These indicators are useful to assess the stylised facts because the data used to build them are consistent across economies and across time. However, the indicators have certain limitations. The first one relates to the fact that the information that indicators provide is relative to the sample.8 Thus it would not be surprising if any classification for an economy changes when the sample changes. Furthermore, a second one is that the interpretation of the aggregate principal-component indicators is somewhat subjective.
The referred subjectivity argument can be extended to include the banking fragility indicator. The characterisation of banking crises periods is not as direct as it seems [Caprio and Klingebiel (2002)]. The time span of banking crises is not easy to determine. Financial distress periods, where the banking system has negative worth, can occur over a period of time, before and after being detected. Also it is not always clear when a crisis is over. Thus, even at a mere qualitative level, the characterisation of banking crises with a categorical variable requires certain judgement.
However, in spite of the above limitations, we use the best and most extensive financial and banking data publicly available. It allows us to quantitatively characterise the main features of most financial systems by using econometric techniques like OLS and panel-data ones. Particularly the possibility to use different econometric techniques to study the data suggest us a concrete first approach to study such stylised facts. Such assessment approach is based on comparisons among indicator relationships under different situations of banking performance. Here the chosen approach is based on OLS regression techniques.
Methodologically, the relationships among financial systems and banking crises are assessed with four regression sets (One for the aggregate indicators and the other three for the individual ones). Each set is built by subsets of three single-variable regressions that describe the associations between a specific pair of indicators under different data samples. In each subset, the first regression estimates an association using all the sampled data. The second and third regressions re-estimate the same association using two data sub-samples that are differentiated according to the banking fragility indicator.
Each regression set analyses one specific relationship among the indicators. The first set analyses the relationships among the financial development indicators with respect to the Structure-Activity one. The second set analyses the relationships with respect to the Size one. The third analyses the relationships with respect to the Structure-Efficiency one. It may be argued that the underlying assumption behind these regressions is that financial structure causes financial development. However, this is not the case. The assessment of stylised facts does not imply any causality.
8
4. Econometric assessment of stylised facts
Here we report the econometric results associated to the four regression sets used to assess the stylised facts among financial systems and banking crises. First we report the results associated to the three sets used to investigate the relationships among individual indicators. Later we report the results associated to the fourth set of aggregate indicators. The regression subsets between pairs of indicators are estimated with three data samples according to the econometric procedure described above. In all the regressions we have included a constant term to eliminate constant effects.9
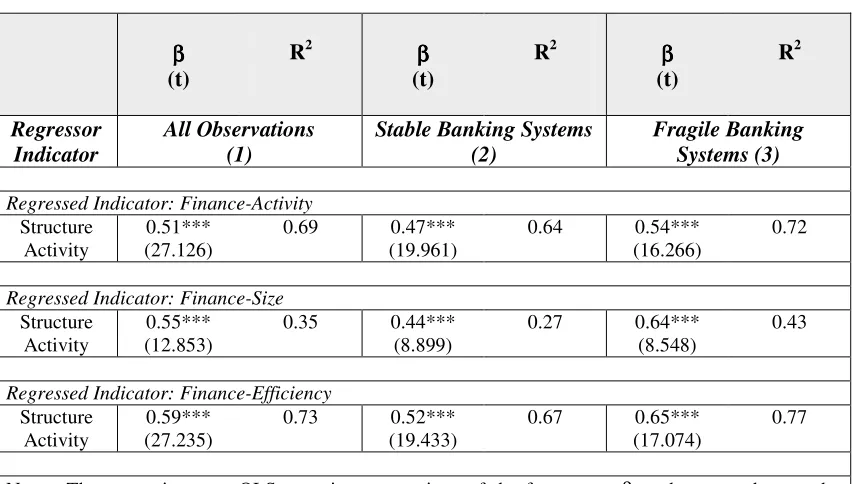
[image:10.612.82.508.321.563.2]The first regression set analyses the relationship between financial development and the relative activity of stock markets with respect to that of banks. We summarise the results of the regression set of individual indicators in the following table:
Table 3. Financial Systems and Banking Crises (Financial Development and Structure-Activity Indicators)
β ββ β
(t)
R2 ββββ
(t)
R2 ββββ
(t) R2 Regressor Indicator All Observations (1)
Stable Banking Systems (2)
Fragile Banking Systems (3)
Regressed Indicator: Finance-Activity
Structure Activity
0.51*** (27.126)
0.69 0.47*** (19.961)
0.64 0.54*** (16.266)
0.72
Regressed Indicator: Finance-Size
Structure Activity
0.55*** (12.853)
0.35 0.44*** (8.899)
0.27 0.64*** (8.548)
0.43
Regressed Indicator: Finance-Efficiency
Structure Activity
0.59*** (27.235)
0.73 0.52*** (19.433)
0.67 0.65*** (17.074)
0.77
Notes: The regressions use OLS to estimate equations of the form: y=α+βx, where y and x are the regressed and regressor indicators, respectively. The regressions use different observations for comparison purposes. Specifically, the first column refers to regressions that include all the observations. The second column refers to regressions that include observations for which the banking fragility variable is equal to zero. The third column refers to the ones for which the banking fragility variable is equal to one. Each column contains the estimate ofβ, the t-statistic of this estimate (in parentheses) and the R2 value of the regression. One, two and three asterisks indicate significance levels of 10, 5 and 1 percent respectively. The estimated coefficients for constants are not reported.
9
Table 3 shows that financial development is associated to a relative increase in the activity of stock markets with respect to that of banks. All the associations are positive and statistically significant (1 percent significance level). The consistency and robustness of these associations hold independently of banking stability considerations. Interestingly, the comparisons among data samples suggest that such associations are magnified during episodes of borderline or systemic banking crises. The regression coefficients, , and coefficients of determination, R2, are higher for samples involving fragile banking systems.
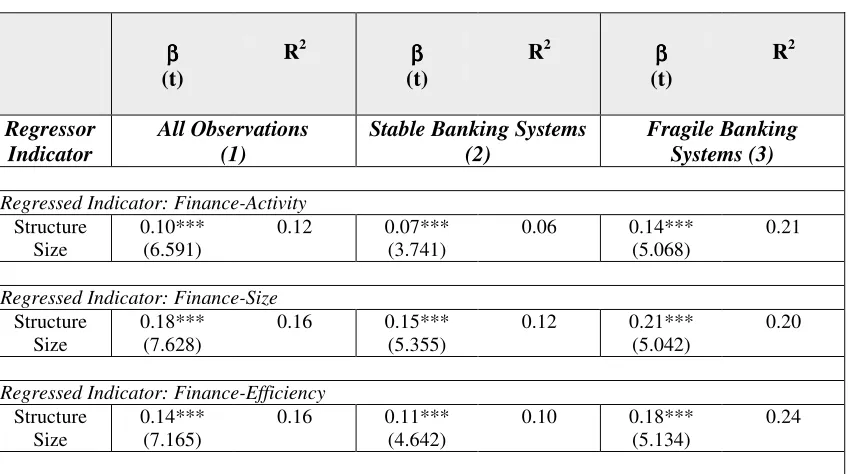
[image:11.612.85.510.266.503.2]The second regression set analyses the relationship between financial development and the relative size of stock markets with respect to that of banks. We summarise the results of the regression set of individual indicators in the following table:
Table 4. Financial Systems and Banking Crises (Financial Development and Structure-Size Indicators)
β ββ β
(t)
R2 ββββ
(t)
R2 ββββ
(t) R2 Regressor Indicator All Observations (1)
Stable Banking Systems (2)
Fragile Banking Systems (3)
Regressed Indicator: Finance-Activity
Structure Size
0.10*** (6.591)
0.12 0.07*** (3.741)
0.06 0.14*** (5.068)
0.21
Regressed Indicator: Finance-Size
Structure Size
0.18*** (7.628)
0.16 0.15*** (5.355)
0.12 0.21*** (5.042)
0.20
Regressed Indicator: Finance-Efficiency
Structure Size
0.14*** (7.165)
0.16 0.11*** (4.642)
0.10 0.18*** (5.134)
0.24
Notes: The regressions use OLS to estimate equations of the form: y=α+βx, where y and x are the regressed and regressor indicators, respectively. The regressions use different observations for comparison purposes. Specifically, the first column refers to regressions that include all the observations. The second column refers to regressions that include observations for which the banking fragility variable is equal to zero. The third column refers to the ones for which the banking fragility variable is equal to one. Each column contains the estimate of β, the t-statistic of the estimate (in parentheses) and the R2 value of the regression. One, two and three asterisks indicate significance levels of 10, 5 and 1 percent respectively. The estimated coefficients for constants are not reported.
The third regression set analyses the relationship between financial development and the relative efficiency of stock markets with respect to that of banks. We summarise the results of the regression set of individual indicators in the following table:
Table 5. Financial Systems and Banking Crises
(Financial Development and Structure Efficiency Indicators)
β ββ β
(t)
R2 ββββ
(t)
R2 ββββ
(t)
R2
Regressor Indicator
All Observations (1)
Stable Banking Systems (2)
Fragile Banking Systems (3)
Regressed Indicator: Finance-Activity
Structure Efficiency
0.61*** (31.024)
0.77 0.57*** (22.514)
0.73 0.64*** (19.471)
0.81
Regressed Indicator: Finance-Size
Structure Efficiency
0.70*** (15.639)
0.48 0.60*** (11.861)
0.44 0.82*** (10.294)
0.55
Regressed Indicator: Finance-Efficiency
Structure Efficiency
0.67*** (27.087)
0.72 0.61*** (18.415)
0.64 0.74*** (19.210)
0.80
Notes: The regressions use OLS to estimate equations of the form: y=α+βx, where y and x are the regressed and regressor indicators, respectively. The regressions use different observations for comparison purposes. Specifically, the first column refers to regressions that include all the observations. The second column refers to regressions that include observations for which the banking fragility variable is equal to zero. The third column refers to the ones for which the banking fragility variable is equal to one. Each column contains the estimate of β, the t-statistic of this estimate (in parentheses) and the R2 value of the regression. One, two and three asterisks indicate significance levels of 10, 5 and 1 percent respectively. The estimated coefficients for constants are not reported.
Table 5 shows that financial development is associated to a relative increase in the efficiency of stock markets with respect to that of banks. Once again the associations are positive and statistically significant. Once more the comparisons among data samples suggest that such associations are magnified during banking crisis periods.
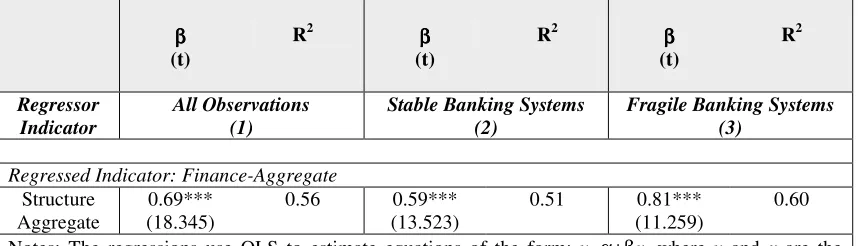
The fourth regression set analyses the relationship between the financial development and financial structure aggregate indexes. We summarise the results of the regression set of indicators in the following table:
Table 6. Relationships Between Financial and Banking Aggregate Indicators (Regression Analysis)
β β β β
(t)
R2 ββββ
(t)
R2 ββββ
(t)
R2
Regressor Indicator
All Observations (1)
Stable Banking Systems (2)
Fragile Banking Systems (3)
Regressed Indicator: Finance-Aggregate
Structure Aggregate
0.69*** (18.345)
0.56 0.59*** (13.523)
0.51 0.81*** (11.259)
0.60
Notes: The regressions use OLS to estimate equations of the form: y=α+βx, where y and x are the regressed and regressor indicators, respectively. The regressions use different observations for comparison purposes. Specifically, the first column refers to regressions that include all the observations. The second column refers to regressions that include observations for which the banking fragility variable is equal to zero. The third column refers to the ones for which the banking fragility variable is equal to one. Each column contains the estimate of β, the t-statistic of this estimate (in parentheses) and the R2 value of the regression. One, two and three asterisks indicate significance levels of 10, 5 and 1 percent respectively. The estimated coefficients for constants are not reported.
Table 6 confirms that financial development is associated to market-based financial systems. Not surprisingly, the associations are positive and statistically significant and their consistency and robustness hold independently of banking performance. Once again, the coefficients and R2 are higher when banking distress is present. Thus this regression set provides an overview of the stylised facts among financial systems and banking crises.
We summarise our findings by indicating that the evidence suggests that developed financial systems are leaded by stock and other securities markets. Moreover it also suggests that such association is magnified during episodes of borderline or systemic banking crises. These findings are consistent with the idea that crises have had a significant impact on the historical development of financial systems [Allen and Gale (2000)]. Thus what our findings might suggest is that banking crises may encourage financial development and the transformation of financial systems into market-based ones.
5. Conclusions and discussion
Research results may be summarised by indicating that the evidence suggests that
developed financial systems are leaded by stock and securities markets. This result was obtained after estimating regressions between pairs of individual and principal-components indicators. In all cases the conclusion was supported by consistent and statistically significant regression coefficients. Furthermore other results suggested that such relationship is magnified during episodes of banking fragility. In all the regressions the coefficients and R2 were higher when banking distress was present.
These findings are consistent with the idea that crises have had a significant impact on the historical development of financial systems [Allen and Gale (2000)]. Specifically, our findings suggest that banking crises might encourage financial development and the transformation of financial systems into market-based ones. We consider this conclusion interesting under the basis that the question “What drives the evolution of the financial system?” is one of the main research issues in the literature of comparative financial systems [Allen and Gale (2004: 701)]..
Academically, what follows up from this study is that further research can be carried along the lines of the literature of comparative financial systems [Allen and Gale (2000) and (2004)]. The relevance of such research is justified under theoretical and practical purposes. Well designed financial and banking systems era essential to guarantee the smooth allocation of resources within and across economies. Further issues regarding globalization, financial fragility, risk management and regulation practices may be analysed under the guidelines of this literature. We hope to encourage further research in such directions. 10.
10
APPENDIX
The principal components analysis (PCA) is a method for re-expressing multivariate data. It allows to reorient the data so that the first few dimensions account for much as information as possible. The central idea is based on the concept of the proportion of the
total variance (the sum of the variance of the p original variables) that is accounted for by each of the new variables. PCA transforms the set of correlated variables
(
x1,..., xp)
to a setof uncorrelated variables
(
y1,...,yp)
called principal compnents in such a way that1
y explains the maximum possible of the total variance, y2the maximum possible of the remaining variance, and so on.
The aim of PCA is to interpret the underlying structure of the data in terms of the most important principal components. Usually, the first principal component may be interpreted as a measure of what is common to the set of correlated variables
(
x1,...,xp)
. Suchinterpretation relies on the fact that the first principal component is the best one-dimensional summary of the data. Particularly, for the aims of the analysis developed here, the first principal component may be interpreted as a scale index that summarises the information contained on a particular set of variables.
Mathematically, the PCA problem is to determine the coefficients aijfor the following
linear system: p pp p p p p p p p x a x a x a y x a x a x a y x a x a x a y + + + = + + + = + + + = ... ... ... ... 2 2 1 1 2 2 22 1 2 1 2 1 2 21 1 1 1 1 Where
(
x1,...,xp)
Former set of correlated variables(
y1,...,yp)
Set of principal component variables.Each principal component is defined by the variables with which it is most highly correlated. The first principal component, denoted byy1, is given by the linear combination of the original variables X =
(
x1,x2...,xp)
with the largest possible variance (where thevariance is interpretable as the information contained in the data). The second principal component denoted byy2, is given by the linear combination of X that accounts for the most information (highest variance) not already captured byy1; that is y2 is chosen to be uncorrelated withy1. All the subsequent principal components are chosen to be uncorrelated with all previous principal components.
principal component may be meaningless without introducing further conditions. We standardise the data to avoid this problem. Such data are denotedXS. This standardisation is achieved by introducing an orthogonality condition for the coefficients. Algebraically, such condition can be written as:
(
)
(
j k j p k p)
a a
p j
a
p
i ik ij p
i ij
,..., 1 ; ,..., 2 , 1 ; 0
,..., 2 , 1 1
1 1
2
= =
≠ =
= =
= =
Analytically, the solution to the principal components problem stated above is obtained by performing an eigenvalue decomposition of the correlation matrix (i.e., the covariance matrix of the standardised data). Thus, finding the eigenvalue vector λ =
(
λ1,λ2,...,λp)
and eigenvectors of the correlation matrix solves the problem.The variance of each principal component can be obtained by listing the eigenvalues from the largest to the smallestλ1 ≥λ2 ≥...≥λp ≥0. The variance of first principal-component
will be the eigenvalueλ1. The proportion of total variance explained by the first
principal-component will be then
p λ λ
λ
λ
+ +
+ 2 ...
1
1 .
REFERENCES
Allen, Franklin (2001) “Financial structure and financial crisis” International Review of Finance, 2(1/2), 1-19
Allen, Franklin and Gale, Douglas (2004), “Comparative financial systems: A discussion” in S. Bhattacharya, A. Boot y A. Thakor, eds., Credit Intermediation and the Macroeconomy: Models and Perspectives, (Oxford University Press, Oxford, New York), 699-770
- (2000) Comparing Financial Systems, Cambridge, United States, MIT Press
Bagehot, Walter (1873) Lombard Street: A Description of the Money Market, London, United Kingdom, Henry S. King & Co.
Bartholomew, David J., et al. (2002) The Analysis and Interpretation of Multivariate Data for Social Scientists, Boca Raton, United States, Chapman & Hall/CRC
Beck, Thorsten (2003) “Stock markets, banks and economic development: Theory and evidence” in BIS, Europe’s Changing Financial Landscape: Recent Developments and Prospects, BIS policy papers Vol. 8 (Bank for International Settlements, Basle), 36-54.
Beck, Thorsten, Demirguc-Kunt, Asli and Levine, Ross (2003) “Bank concentration and crises” Massachusetts, National Bureau of Economic Research, NBER Working Paper 9921
- (2000) “A new database on the structure and development of the financial sector” The World Bank Economic Review, 14(3), 597-605
Bernanke, Ben and Getler, Mark (1990) “Financial fragility and economic performance”
Quarterly Journal of Economics, 105(1), 87-114
Caprio, Gerard and Klingebiel, Daniela (2002) “Episodes of systemic and borderline financial crises” World Bank Research Domestic Finance Data Sets,[Online], (July 2002)
- (1996a) “Bank insolvencies: Cross-country evidence” Washington, World Bank, Policy Research Paper 1620
- (1996b), “Bank insolvency: Bad luck, bad policy or bad banking?”, Document prepared for the Annual Bank Conference on Development Economics, April 25-26, 1996 (World Bank)
Demirguc-Kunt, Asli and Huizinga, Harry (2000) “Financial structure and bank profitability”Washington, World Bank, WB Working Paper 2430
Demirguc-Kunt, Asli and Levine, Ross (1999) “Bank-based and market-based financial systems: Cross country comparisons” Washington, World Bank, WB Working Paper 2143
Fischer, Irving (1933) “The debt-deflation theory of great depressions” Econometrica, 1(4), 337-357
Frankel, Allen and Montgomery John D. (1991) “Financial structure: An international perspective” Brooking Papers on Economic Activity, 1991(1), 257-297
Gertler, Mark (1988) “Financial structure and aggregate economic activity: An overview”
Journal of Money, Credit and Banking, 20(3), 559-588
Goldsmith, Raymond W. (1969), Financial Structure and Development, New Haven, United States, Yale University Press
Goodhart, Charles et al. (1998), Financial Regulation. Why, How and Where Now?,
London, United Kingdom, Routledge
Hoenig, Thomas R. (2001) “Perspectives on financial crises: What have we learned from the events of recent years?” Paper presented to Eleventh Annual Hyman P. Minsky Conference on Financial Structure (The Jerome Levi Economics Institute). April 26, 2001. Blithewood.
Lattin, James, Carroll, Douglas J. and Green Paul E. (2003) Analyzing Multivariate Data, Toronto, Canada, Thomson Brooks/Cole
Levine, Ross (2002) “Bank-based or market-based financial systems: Which is better?”
Journal of Financial Intermediation, 11(4), 398-428
Lopez, Jose A. and Spiegel, Mark M. (2002) “Financial structure and macroeconomic performance in the short and long run” San Francisco, Center for Pacific basin Monetary and Economic Studies-Economic Research Department-Federal Reserve Bank of San Francisco, Working Paper PB02-05
Mishkin, Frederick S. (1999) “Global financial instability: Frameworks, events, issues”
Journal of Economic Perspectives, 13(4), 3-20
Ruiz-Porras, Antonio, Noemí Vásquez-Quevedo and José A. Nuñez-Mora (2006) “Efectos de la globalización financiera en la administración y regulación de riesgos bancarios en México” Contaduría y Administración, [forthcoming]