A Framework for Career-Education Hybrid
Recommender System using a Selective Path
Delta-SimRank Algorithm
Waleed M. Al-Adrousy
Computer Science Department, Computers and Information
Systems Faculty Mansoura University, Egypt
Hesham A. Ali
Computer Engineering and systems Department,
Engineering Faculty, Mansoura University, Egypt
Taher T. Hamza
Computer Science Department,Computers and Information Systems Faculty Mansoura University, Egypt
ABSTRACT
Selecting proper educational courses is a major problem in the student’s life. A key factor in selecting courses is asking for the experts’ opinion in the real life business. However, contacting with a real expert in a field may be difficult for many students. In this research, we suggest a general framework for a social network to connect students and experts. The framework depends on a variation of Delta-SimRank algorithm. The suggested variation is called Selective Path Delta-SimRank (SPDSR). Both the SPDSR and the original Delta-SimRank apply MapReduce technique for load balancing in a network of device. The suggested SPDSR tries to enhance the performance of Delta-SimRank. The Experiments results had shown that SPDSR had reduced the processing time in 30-70% of test cases to enhance performance by 18% in average.
General Terms
Distributed Systems and Social Networking.
Keywords
MapReduce, Scientogram, SimRank, Recommender System, Education and Self-Learning, Collaboration.
1.
INTRODUCTION
Learning and education in academic institutes should be targeted toward specific jobs desired by students. Choosing right education courses can be hard for several reasons; knowing the requirements of each job, knowing the content of
each course and its importance, knowing the prerequisites of each course and the logical order of courses, measuring the suitability of each course to student’s personal abilities, and distinguishing the up-to-date courses from the outdated ones. Those problems become greater during self-learning processing due to students’ lack of experience. Even in academic institutions, the nature of continuous updating of careers job specifications may advance the academic curriculums updating. So, this research tries to link the professional experts in market with the academic institutes by providing a large social network of students and professionals to exchange ideas and make discussions.
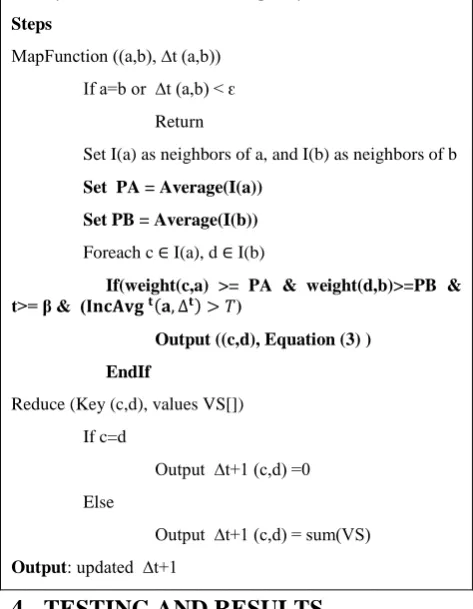
On the other hand, detecting dependencies of dynamically changed courses can be an exhausting process if done manually. So, there is a need to store the dependencies of scientific items and keep it updatable according to conversations among members. Semantic and syntactic analysis is required to extract objects from text conversations and generate the dependency graph of them. A similar concept is Scientogram or Atlas of Science [1, 2]. Scientogram is a graph that interconnects scientific items in a set of domains. The scientogram is constructs from documents co-citation [3]. Figure 1 presents a USA atlas of science in 2002.
[image:1.595.60.552.556.744.2]According to [3], The key challenges of constructing that atlas are : Modeling various documents contents obtained from many sources in a time effective way, Inferring relationships of sciences based on semantic and syntactic analysis, Visualizing the map of science in time effective way
and being updatable in the same time, Large memory space and computing resources, Rendering Map in a multi level of details in a real time, Allowing concurrent editing to the map from different users from different geographic locations, and synchronization of concurrent editing operation. In this paper, the details of scientogram are beyond the scope of research. The size of the scientogram can be a problem in processing for users to distinguish the trust-worthy advice in that network. A new trend of systems called Recommender System [4] has been developed to help users by recommending items to them. Currently, there are two types of recommender systems, collaborative filtering and content-based filtering. Collaborative filtering makes use of users' ratings to items regardless of its content, while the content-based filtering does the opposite. Content-content-based filtering systems analyze the semantic content of profiles and pages in social network to suggest suitable items to users [5]. A common problem in recommender systems is similarity calculation between items. The similarity calculation is important to match item-to-user or item-to-item objects[6]. Calculating similarity has many measures based on central server. However, computation in the large graph is very expensive for a central server. Some efforts were made to apply parallelism on similarity calculation. One of those efforts is discussed in the next section. This paper focuses on the enhancement of parallelism in one of the distributed similarity calculations algorithms.
This paper is organized as follows; section 2 has an overview of related work and possible contributions, section 3 presents the proposed framework and technique, section 4 presents testing results, and section 5 has the discussion of the results.
2.
PREVIOUS AND RELATED WORK
2.1
Recommender Systems for Education
Many researches had been made on building a recommender system for educational purposes. One technique was to use item-based strategy extended by model-based techniques for personal learning environment (PLE) named PAcMan [7]. PAcMan (Personal Activity Manager) allowed users to manage their online resources and tools using a simple model of learning activities. It applied Actor-Network Theory ANT principle [8] that lists that the neighbors of each PLE as: processes, media, artifacts, actors, and communities. However, it was a client-side system to manage local resources.A framework was proposed by [9] to provide a context-aware recommender system for learning. The context in that framework included factors like: location of learner, social relations among users, available resources, and performed activities. This framework was focused on the context of learner’s environment and didn’t include the professional experts’ intersection with that context.
Another work is BROA [10] which is based on a Spanish phrase that means: “Learning Objects Search, Retrieval, and Recommender System”. BROA uses multi-agent technique to recommend learning objects to students. BROA was developed by Java and JDom Model for XML processing. However, it needed more work to optimize query to consider bandwidth of networks and depends mainly on collaborative filtering. Also, BROA research had used some existing algorithms and didn’t creatte new algorithms.
2.2
SimRank and Delta-SimRank
Algorithm
The SimRank algorithm is proposed by [11] to calculate the similarity in any object-to-object networks. The main idea of it is concluding that two objects are similar if they are connected to similar neighbor nodes. This algorithm is iterative since it has a recursive definition; the similarity of nodes depends on the similarity of their neighbors, and the similarity of the neighbor nodes depends in turn on their neighbors.
Suppose that there is a network G(V,E) where V is the set of vertices and E is the set of edges. The SimRank generates a new graph G2 of node pairs from graph G as in Figure 2. In Figure 2 the left side graph is the original graph G and the right side graph G2 is the pair graph. An edges in G2 is formed between node (a,b) to node (c,d) when there’s an edge from a to c and an edge b to d in original graph G. the main concept in SimRank is that two nodes are similar if their neighbors are similar. Suppose the set of nodes with ingoing links to node a is I(a) and the SimRank score for similarity of two nodes a and b is s(a,b). The calculation of s(a,b) is by Equation (1). The parameter of C is decay factor which is usually about 0.8 [11] which expresses the fading of node effect of longer paths compared to the nodes on near paths. For example, when C=0.8 and the node a is connected to a direct neighbor b it has 0.8 effect on node a. If node b in turn is connected to node d, then node d has an effect of C2 on node a (0.8*0.8). An initial score value is assigned to each node as in Equation (2).
[image:2.595.317.537.392.668.2]
Equation (1) Equation (2)
Figure 2 A Simplified Example Based fon SimRank Algorithm [11], the Left Diagram is The Original Graph,
and The Right Diagram is The Transformed Graph.
power. A relatively new variant of SimRank is the Delta-SimRank is developed by [12]. The MapReduce technique [13] is applied in Delta-SimRank to have a distributed similarity. The Delta-SimRank is iterative also and measures the difference in scores in each node from iteration of time t to iteration of time t+1 as in Equation (3). The initial value of Delta-SimRank is calculated by Equation (4) which depends on Equation(1). The Delta-SimRank algorithm is illustrated in Algorithm 1.
Equation (3) Equation (4)
Algorithm 1 Pseudo Code of Delta-SimRank [12] Input: Graph G, initial ∆ values and small threshold ԑ
Steps
MapFunction ((a,b), ∆t (a,b)) If a=b or ∆t (a,b) < ԑ
Return
Set I(a) as neighbors of a, and I(b) as neighbors of b
Foreach c I(a), d I(b)
Output ((c,d), Equation (3) ) Reduce (Key (c,d), values VS[])
If c=d
Output ∆t+1 (c,d) =0 Else
Output ∆t+1 (c,d) = sum(VS)
Output: updated ∆t+1
To conclude that section, the contributions of this research are: suggesting a framework to recommend careers based on learning skills, recommend coursers based on desired careers, combine hybrid combination of content filtering, collaborative filtering and map-reduce. Another contribution is suggesting a modification to Delta-SimRank algorithm to achieve partial enhancement performance. This paper is not limited to education domain but also the distributed systems domain.
3.
PROPOSED TECHNIQUE
3.1
General Framework
The Figure 3 lists the main components in the proposed framework. Table 1 lists the function of each component in the framework. This suggested framework combines the collaborative filtering and content based filtering. There are four main stereotypes of components in the framework: The repository components to store information of each network, Level 1 components take the input of users such as conversations and posts and perform the initial recommendation steps, Level 2 components that use MapReduce [14] and [15], and the Output Level which combine the results of both types of recommender systems and present results to user and sends feedbacks to Level1 components to update repositories.
[image:3.595.44.539.180.501.2]Since this framework is very large to be implemented by small group, the focus in this research is on the components of Level 2. Level 2 components need to calculate similarity between academic courses features and career jobs requirements in the proposed network. This is a large network that contains: students, courses, professionals and posts. So, both components in level 2 have a suggested variant of Delta-SimRank as explained in the following sub-section
.
Table 1 Main Components of Suggested Framework
3.2
Proposed Selective Path
Delta-SimRank Algorithm
The proposed algorithm is a variant of Delta-SimRank. The main Idea of algorithm is trying to minimize the aggregated scores from neighbors by applying greedy path selection criteria. The proposed Selective Path Delta-SimRank (SPDSR) algorithm excludes some paths during search by applying local view for each node. Instead of exploring all neighbor nodes in Delta-SimRank, the SPDSR selects only neighbors above or equal to the average old score from the previous iteration. This idea is simple and sometimes not the optimal efficiency. However, an optimal selective algorithm will add more complexity and overhead to the current algorithm. The SPDSR algorithm is very similar to Delta-SimRank. The significant steps are marked in bold in the in Algorithm 2. An incremental average IncAvg function is
defined as in Equation (5). The step 8 in Algorithm 2 is the main selective path criteria.
Equation (5)
Algorithm 2 Pseudo Code of Selective Path Delta-SimRank
Input: Graph G, initial ∆ values small threshold ԑ, significant
count β, and threshold of delta frequency T
Steps
MapFunction ((a,b), ∆t (a,b)) If a=b or ∆t (a,b) < ԑ
Return
Set I(a) as neighbors of a, and I(b) as neighbors of b
Set PA = Average(I(a)) Set PB = Average(I(b))
Foreach c I(a), d I(b)
If(weight(c,a) >= PA & weight(d,b)>=PB & t>= β & ( )
Output ((c,d), Equation (3) ) EndIf
Reduce (Key (c,d), values VS[]) If c=d
Output ∆t+1 (c,d) =0 Else
Output ∆t+1 (c,d) = sum(VS)
Output: updated ∆t+1
4.
TESTING AND RESULTS
The experiments were made on randomly generated graphs for generality and simplicity instead of real datasets. The real life datasets are specific to certain cases. The random generated graphs were based on three random graph models: Eppstein’s Power Law model [16], Erdos-Renyi model [17] and [18], and Barabasi -Albert model [19]. Those models are types of small world random graph [3] and [20]. A custom simulator1 is developed using Java Ateji PX2 and JUNG3 libraries. The Ateji library is used for parallel processing to simulate the MapReduce technique. The experiments were made on Core 3i processor with 4GB ram size.
The Mean Absolute Error MAE measure is the sum of absolute differences of a set of expected reference result and a set of corresponding predicted results [21]. Assuming n values of expected values exp0, exp1 … and expn , and a set of predicted values pred0, pred1 … and predn , then the MAE value can be calculated by Equation (6).
1 The simulation source code is available at:
http://code.google.com/p/simulation-of-spdsr/
2 http://www.ateji.com/ 3 http://jung.sourceforge.net/
The Component The Function
Knowledge Network <<Repository>>
The ontology of related text terms. In addition to a map of science to model the general sciences graph [3] (Scientogram).
Experts' Ranking <<Repository>>
The database of experts and their rankings. The ranking are updated based on each expert’s activities on the network like answering questions, making comments or suggesting courses as prerequisites for some jobs. The experts’ profiles of users are stored in that component.
Job Specification <<Repository>>
The profile of each job and career.
Academic Courses Program <<Repository>>
The academic courses in the academic institution. The course content may contain several scientific terms from the scientogram component.
Topics Analysis Component <<Level 1>>
The content based recommender system. The engine of mining the relationships of academic courses and build new relationships by content similarities.
Experts' Recommendation
Surveying <<Level 1>>
The collaborative filtering component. It aggregates the experts’ explicit survey results.
Content MapReduce Component <<Level 2>>
A MapReduce component to inspect the contents of academic courses using the content of scientogram to build initial dependencies among careers and courses.
Survey Analysis MapReduce Component <<Level 2>>
A MapReduce component to build dependencies among careers and courses using the weighted experts’ rankings.
Career-Coursers Recommendations
<<Output>>
Equation (6)
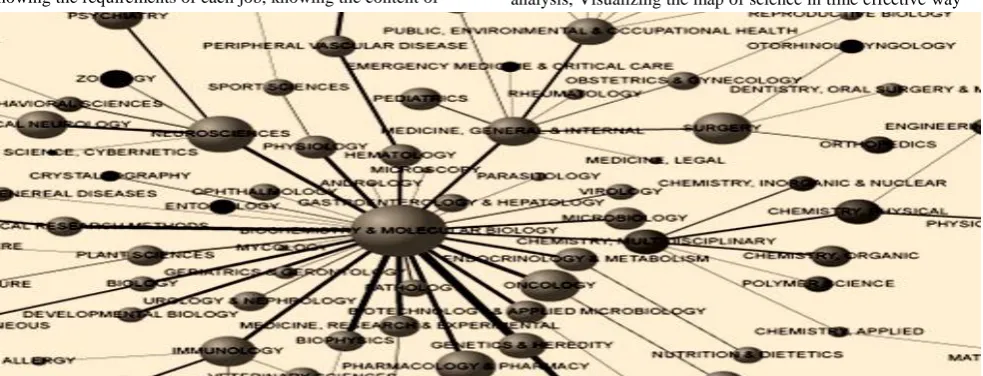
The correctness and performance simulation results are listed in Table 2. The experiments were done on 30 sample (10 per model) random graphs with count of nodes with sizes of (50, 60 ... and 140) nodes. The count of edges in simulation was 5 times the count of nodes. The MAE was computed to compare Delta-SimRank and SPDSR algorithms results when running on the same generated network each time. Figure 4presents the simulation results in detail when using the Eppstein’s Power Law
Table 2 Summary of Testing Results on Random Generated Graphs Comparing SPDSR Results to Original
Delta-SimRank Results
Criteria/Model Eppstein’s Power Law Model (10 cases)
Erdos-Renyi Model (10 cases)
Barabasi-Albert Model (10 cases) Mean Absolute
Error (MAE)4
0. 297 *10-14
0. 947*10-4
0
Relative Count Enhanced Cases
70% 50% 30%
Best
Enhancement of Time
43% 36% 8%
Worst Performance
-4% -22% -36%
Average Performance
[image:5.595.49.294.236.616.2]18% 4% -6%
Figure 4- Processing Time Comparison of SPDSR and Delta-SimRank algorithms (Eppstein’s Power Law). The Horizontal Axis is The Count of Nodes, and The Vertical
Axis is The Processing Time in (Nano Seconds).
5.
DISCUSSION AND CONCLUSION
From the previous section, it’s clear that there are cases the SPDSR algorithm can enhance the processing time of Delta-SimRank when the network graph has the power law property in about 70% of cases. The enhancement amount in average can exceed 40% of Delta-SimRank. However, the greedy
4 http://en.wikipedia.org/wiki/Mean_absolute_error
local selective nature of the algorithm can be a disadvantage in some cases. This is apparent in the case of Barabasi-Albert random graphs as only 30% of cases are enhanced by SPDSR, while the other majority of cases had less performance than the Delta-SimRank. In the MAE view of point, both algorithms produce almost identical results. Another factor of SPDSR delay is the extra averaging and selection steps, which in some case can be more expensive than working on all available paths in some nodes.
The SPDSR algorithm could maintain the distributed nature and correctness of Delta-SimRank. However, it has some problems that may be done as a future work. It needs more efforts to have stable enhancements of performance in all types of graphs or at least prevent being worst than Delta-SimRank. Also the framework of Education-Career selection needs to be implemented in a real system. Some other issues may be apparent in real-life application of such system. The simulator was a simplification of the target problem and some factors hadn’t been implemented in it. The general framework could be very useful to educational institutes but it needs a large team and many resources to implement and test it.
6.
REFERENCES
[1] S. G. F. De Moya-anegón, Z. Chinchilla-rodríguez, E. Corera-álvarez, F. J. Munoz-fernández, and V. Herrero-solana, “Visualizing the Marrow of Science,” JOURNAL OF THE AMERICAN SOCIETY FOR INFORMATION SCIENCE AND TECHNOLOGY, vol. 58, no. 14, pp. 2167–2179, 2007.
[2] A. Quirin, O. Cordón, P. Shelokar, and C. Zarco, “Analysis of the Time Evolution of Scientograms Using the Subdue Graph Mining Algorithm,” Computational Intelligence for Knowledge-Based Systems Design. Springer Berlin Heidelberg, pp. 310–319, 2010.
[3] K. Börner, “Mapping Science Case Studies : Computational Scientometrics :,” Annual review of information science and technology, vol. 37, no. 1, pp. 179–255, 2003.
[4] O. R. Zaiane, “Building a Recommender Agent for e-Learning Systems,” in Proceedings of the International Conference on Computers in Education (ICCE’02), 2002, pp. 55–59.
[5] Y. S. Kim, A. Krzywicki, W. Wobcke, A. Mahidadia, P. Compton, X. Cai, and M. Bain, “Hybrid Techniques to Address Cold Start Problems for People to People Recommendation in Social Networks.”
[6] L. Tang and H. Liu, “GRAPH MINING APPLICATIONS TO SOCIAL NETWORK ANALYSIS,” in Managing and Mining Graph Data, vol. 40, C. C. Aggarwal and H. Wang, Eds. Boston, MA: Springer US, 2010, pp. 487–513.
[7] F. Mödritscher, “Towards a recommender strategy for personal learning environments,” in 1st Workshop on Recommender Systems for Technology Enhanced Learning (RecSysTEL 2010), 2010, vol. 1, no. 2, pp. 2775–2782.
[8] R. Klamma and Z. Petrushyna, “The Troll Under the Bridge : Data Management for Huge Web Science Mediabases,” GI Jahrestagung, vol. 2, pp. 923–928, 2008.
[9] K. Verbert, N. Manouselis, X. Ochoa, M. Wolpers, H. Drachsler, I. Bosnic, S. Member, and E. Duval,
0 2E+09 4E+09 6E+09 8E+09 1E+10 1.2E+10 1.4E+10
50 60 70 80 90 100 110 120 130 140
“Context-aware Recommender Systems for Learning : a Survey and Future Challenges,” Journal of LATEX Class Files, vol. 6, no. 1, pp. 1–20, 2007.
[10]P. Rodriguez, V. Tabares, N. Duque, D. Ovalle, and R. Vicari, “BROA: An agent-based model to recommend relevant Learning Objects from Repository Federations adapted to learner profile,” International Journal of Interactive Multimedia and Artificial Intelligence, vol. 2, no. 1, pp. 6–11, 2013.
[11]G. Jeh and J. Widom, “SimRank : A Measure of Structural-Context Similarity,” in Proceedings of the eighth ACM SIGKDD international conference on Knowledge discovery and data mining, ACM, 2002, pp. 1–11.
[12]L. Cao, B. Cho, H. D. Kim, Z. Li, M.-H. Tsai, and I. Gupta, “Delta-SimRank computing on MapReduce,” in Proceedings of the 1st International Workshop on Big Data, Streams and Heterogeneous Source Mining Algorithms, Systems, Programming Models and Applications - BigMine ’12, 2012, pp. 28–35.
[13]H. Yang, A. Dasdan, R. Hsiao, and D. S. Parker, “Map-Reduce-Merge : Simplified Relational Data Processing on Large Clusters,” in Proceedings of the 2007 ACM SIGMOD international conference on Management of data. ACM, 2007, pp. 1029–1040.
[14]G.-J. Qi, M.-H. Tsai, S.-F. Tsai, L. Cao, and T. S. Huang, “Web-Scale Multimedia Information Networks,” Proceedings of the IEEE, vol. 100, no. 9, pp. 2688–2704, Sep. 2012.
[15]R. Agrawal, A. Gupta, Y. Prabhu, and M. Varma, “Multi-Label Learning with Millions of Labels : Recommending Advertiser Bid Phrases for Web Pages,” in International WorldWideWeb Conference Committee (IW3C2), 2013, pp. 13–23.
[16]D. Eppstein and J. Wang, “A steady state model for graph power laws,” arXiv preprint cs/0204001, pp. 1–8, 2002.
[17]G. L. Ciampaglia, “User Participation and Community Formation in Peer Production Systems presented by,” della Svizzera, Italy, 2011.
[18]M. E. J. Newman, “The structure and function of complex networks,” SIAM review, vol. 45, no. 3, pp. 167–256, 2003.
[19]D. Liben-nowell, “The Link-Prediction Problem for Social Networks,” Journal of the American society for information science and technology, vol. 58, no. 7, pp. 1019–1031, 2007.
[20]M. Martinez and H. Aldrich, “Networking strategies for entrepreneurs: balancing cohesion and diversity,” International Journal of Entrepreneurial Behaviour & Research Volume List, vol. 17, no. 1, pp. 7–38, 2011. [21]C. Res, C. J. Willmott, and K. Matsuura, “Advantages of
![Figure 2 A Simplified Example Based fon SimRank Algorithm [11], the Left Diagram is The Original Graph,](https://thumb-us.123doks.com/thumbv2/123dok_us/8049635.773591/2.595.317.537.392.668/figure-simplified-example-based-simrank-algorithm-diagram-original.webp)