Optimization of Horizontal Aggregation in SQL
by using C4.5 Algorithm
Priti Phalak
Lecturer, TSEC Mumbai, India
Rekha Sharma
HOD & Associate Professor TCET Mumbai, India
ABSTRACT
For efficient analysis of some data mining system and algorithms, data is required in the horizontal aggregated format. In a relational database, datasets are highly normalized and major efforts are required to compute aggregation when they are expected in horizontal form which is suitable for some data mining, statistical and machine learning algorithm. Query optimization techniques used for vertical (standard) aggregation is not suitable for horizontal aggregation. That’s why we propose an optimization technique for horizontal aggregation. To optimize horizontal aggregation we are using C4.5 classification algorithm and query evaluation methods. Horizontal Aggregation represents a template to generate SQL code which automates writing SQL queries, optimizing them, and testing them for correctness. It also reduces manual work in the data preparation phase in a data mining. There are various applications where the horizontal aggregation is used such as electrical billing, banks, hospital management system, pharmacy and online library etc.
General Terms
Data Mining, Aggregation Function, Classification, SQL, Query execution methods
Keywords
Horizontal Aggregation, C4.5 Algorithm, OLAP, PIVOT, CASE, SPJ
1.
INTRODUCTION
In the current era of database management system, there is wide availability of huge amounts of data and it is forthcoming need to turn such data into useful information and knowledge. This can be achieved by using data mining techniques. Data mining is the process of mining knowledge, examining data from a different view and sums it up into useful information. Data mining uses the data warehouse as the source of information for knowledge discovery [4]. In Data warehouse, Online Analytical processing (OLAP) has the capability to provide summarized data from multiple and dynamic view which is a solid foundation for successful data mining.
In general, datasets come from Online Transaction Processing (OLTP) systems and are stored in a relational database (or a data warehouse) where database schemas are highly normalized. Some data mining and machine learning algorithm generally require aggregated data in a summarized format. Major effort is required to compute aggregation when they are expected in horizontal tabular layout. Horizontal aggregation is a method which generates SQL code to return aggregated columns in the horizontal tabular layout. It returns
a set of numbers instead of one number per row. There are number of in-built aggregation functions in SQL provided as relational operations, for grouping and aggregation purpose, such as minimum, maximum, average, count, and sum. Data mining and OLAP tools are the data summarization/ aggregation tool. These tools are used with some OLAP operation for transposition (pivoting) of results retrieved by data mining.
In literature, horizontal aggregation has been successfully used to prepare dataset. In Ordonez and Chen’s paper [1] they have given the fundamental idea of horizontal aggregation and how it can be used to prepare dataset. They have proposed three query evaluation methods to evaluate horizontal aggregation: SPJ, CASE and PIVOT. They conclude that CASE method has similar speed to the PIVOT operator and it is much faster than the SPJ method. In general, the CASE and PIVOT methods exhibit linear scalability, whereas the SPJ method does not. The PIVOT and UNPIVOT complementary data manipulation operators or method which is used to exchange the role of rows and columns in a relational table. Pivot transforms a series of rows into a series of fewer rows with additional columns. Unpivot provides the inverse operation, removing a number of columns and creating additional rows that capture the column names and values from the wide form has described by Cunningham, Galindo-Legaria, Graefe [2]. How the K-means clustering algorithm is used to partition data sets after horizontal aggregations and a small description about the horizontal aggregation methods which returns set of numbers instead of one number per row has discussed in paper [3]
In this paper, three query evaluation methods are used with some aggregation function to operate horizontal aggregation of data sets.
Decision Tree C4.5 algorithms [3][8] is used to optimize the horizontal aggregation in SQL. For efficient retrieval of datasets, C4.5 algorithm classifies the transaction datasets in classified labels. A transactional database consists of a file which contains transaction related information.
2.
HORIZONTAL AGGREGATION
Horizontal aggregation is same as traditional SQL, or standard SQL aggregation, which return set of values in horizontal layout instead of one number per row. It is a new class of aggregate functions that aggregate numeric expressions and transpose results to produce a data set with a horizontal layout.
There are several advantages of horizontal aggregations as follows:
1) They represent a template to generate SQL code from a data mining tool. This SQL code automates writing SQL queries, optimizing them, and testing them for correctness.
2) SQL code reduces manual work in the data preparation phase in a data mining.
3) SQL code is more efficient than SQL code written by an end user as it is automatically generated. As a result, data sets can be created in less time. 4) The data set can be created entirely inside the
DBMS. In modern database environments, it is common to export de-normalized data sets to be further cleaned and transformed outside a DBMS in external tools. Unfortunately, exporting large tables outside a DBMS is very slow and it creates inconsistent copies of the same data and effects database security.
Horizontal aggregations just require a small syntax extension to aggregate functions called in a SELECT statement. Alternatively, they can be used to generate SQL code from a data mining tool to construct data sets for data mining analysis[1].
2.1
Example of Horizontal Aggregation in
SQL
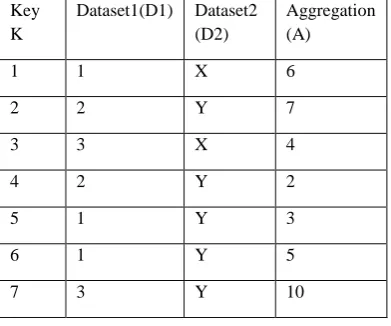
In this example ‘F’ is the input table having a simple primary key ‘K’ represented by an integer. ‘D1’ and ‘D2’ are the datasets. ‘A’ is aggregated value of dataset columns. In OLAP terms, ‘F’ is a fact table with one column used as primary key. Column K will not be used to compute aggregations.
In Table I dataset1 i.e D1 consist of three values 1, 2 and 3 repeatedly for distinct values in D2, which consist of only two distinct values X and Y. The values within D1 are repeated, 1 appears 3 times in row number 1, 5 and 6, and for row 1, 5 & 6 value of D2 are X, Y & Y respectively. The sum () aggregate operation is used in this, so the aggregation function sum () is applied to row 5 and 6. This sum () function adds aggregated values of these rows and store in the vertical aggregated format. This vertical aggregated data FV can be transformed into horizontal layout FH by generating new columns D2X and D2Y.
The basic SQL aggregation query is: SELECT D1, D2, sum (A)
FROM F
GROUP BY D1, D2 ORDER BY D1, D2;
Ordonez’s system collects particular needed attributes from different fact tables and display columns in order to create data in horizontal layout which is useful for most of the data mining task or operations such as unsupervised classification and data summation, as well as segmentation of large
[image:2.595.353.549.131.294.2]heterogeneous data sets into smaller homogeneous subsets so that they can be easily managed, separately modeled and analyzed [1].
[image:2.595.342.549.303.465.2]Table I: Original dataset
Table II : dataset is in vertical aggregated format (fv)
[image:2.595.331.549.515.592.2]
Table III: dataset is in horizontal aggregated format
2.2
SQL Code Generation
Defining a template to generate SQL code, combining aggregation and transposition (pivoting) is the main objective. Other goal is to extend the SELECT statement with a clause that combines transposition with aggregation.
Consider the following GROUP BY query in standard SQL that takes a subset L1; . . . ; Lm from datasets D1, . . .,Dp :
SELECT L1,….,Lm, sum(A) FROM F
GROUP BY L1,. . . ,Lm; Key K
Dataset1(D1) Dataset2 (D2)
Aggregation (A)
1 1 X 6
2 2 Y 7
3 3 X 4
4 2 Y 2
5 1 Y 3
6 1 Y 5
7 3 Y 10
D1 D2 A(Sum)
1 X 6
1 Y 8
2 Y 9
3 X 4
3 Y 10
D1 D2X D2y
1 6 8
2 Null 9
This aggregation query will produce a wide table with m+1 columns (automatically determined), with one group for each unique combination of values L1, . . . , Lm and one aggregated value per group (sum(A) in this case)
The basic objective of a horizontal aggregation is to transpose (pivot) the aggregated column A by a column subset of L1, . ., Lm; for simplicity, assume such subset is R1, . . .,Rk where k < m.
In other words, we partition the GROUP BY list into two sublists: one list to produce each group (j columns L1, . . . ,Lj) and another list (k columns R1, . . .,Rk) to transpose aggregated values, where L1, . . . , Lj R1, . . .,Rk.
Each different combination of R1,. . .,Rk will automatically produce an output column. Horizontal aggregation requires four input parameters to generate SQL code:
1. Input table F,
2. List of GROUP BY columns L1, . . . ,Lj, 3. Column to aggregate (A),
4. List of transposing columns R1 ,. . .,Rk.
Horizontal aggregations maintain evaluation semantics of standard (vertical) SQL aggregations. The main difference will be returning a table with a horizontal layout, possibly having extra nulls.
3.
QUERY EVALUATION METHODS
There are three query evaluation methods to evaluate horizontal aggregation
1) SPJ 2) PIVOT 3) CASE
SPJ method based on standard relational operator such as select, project, and join (SPJ) queries. CASE method based on the SQL CASE construct. PIVOT method uses a built-in operator in a commercial DBMS that is not widely available [1].
3.1
SPJ Method
It depends only on relational operations means it only doing select, project, join, and aggregation
The main idea of this method is to create one table with a vertical aggregation for each result column, and then join all those tables to produce horizontal aggregation.
We aggregate from input table F into dimension d projected tables with d Select-Project-Join Aggregation queries (selection, projection, join, aggregation).
Each table Fi corresponds to one subgrouping combination and has Li……Lj as primary key and an aggregation on A as the only non-key column.
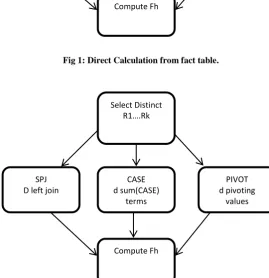
[image:3.595.305.576.73.259.2]There are two strategies to compute Horizontal Aggregation. first strategy is to do direct calculation aggregation form fact table and second one is to compute corresponding vertical aggregation in temporary table Fv grouping by list of grouping columns LE1,...,LEi, list of transposing columns RI1,...,RIj then FH can be computed from FV.
[image:3.595.305.575.214.493.2]Fig 1: Direct Calculation from fact table.
Fig 2: By Computing corresponding vertical aggregation FV (optimized)
3.2
CASE Method
In this method, the “case” programming construct available in SQL is use. a value selected from a set of values based on Boolean expressions is returned by the case statement. From theory point of view, a relational database is equivalent to doing a simple projection/aggregation query where each non key value is given by a function that returns a number based on some conjunction of conditions.
There are two basic strategies to compute FH. Just like SPJ, the first strategy is to directly aggregates from F and the second strategy to computes the vertical aggregation in a temporary table FV and then horizontal aggregations are indirectly computed from FV.
Compute Fh
PIVOT d pivoting values CASE d sum
(CASE) terms SPJ D left join
Select Distinct R1….Rk
Compute Fh
PIVOT d pivoting
values CASE
d sum(CASE) terms SPJ
D left join
For the direct aggregation method, Horizontal aggregation queries can be evaluated by directly aggregating from F and transposing rows at the same time to produce FH. First, get the unique combinations of R1,..…..Rk that define the matching Boolean expression for result columns[1]. The SQL code to compute horizontal aggregations directly from F is as follows:
observe V( ) is a standard (vertical) SQL aggregation that has a “case” statement as argument. Horizontal aggregations need to set the result to null when there are no qualifying rows for the specific horizontal group to be consistent with the SPJ method and also with the extended relational model [4].
SELECT DISTINCT R1; . . .;Rk FROM F;
INSERT INTO FH SELECT L1, . . . ,Lj
,V(CASE WHEN R1 = v11 and . . . and Rk =vk1 THEN A ELSE null END),
V(CASE WHEN R1 = v1d and . . . and Rk = vkd THEN A ELSE null END)
FROM F
GROUP BY L1; L2; . . . ; Lj;
Query evaluation needs to combine the desired aggregation with “CASE” statements for each different combination of values of R1, . . .,Rk. The following statements compute FH:
SELECT DISTINCT R1; . . .;Rk FROM FV ;
INSERT INTO FH SELECT L1,..,Lj
,sum(CASE WHEN R1 = v11 and .. and Rk = vk1 THEN A ELSE null END)
sum(CASE WHEN R1 = v1d and .. and Rk = vkd THEN A ELSE null END)
FROM FV
GROUP BY L1, L2, . . . , Lj;[1]
3.3
PIVOT Method
Pivot (also called rotate) is a visualization operation that rotates the data axes in view in order to provide an alternative presentation of the data. Pivot transforms a series of rows into a series of fewer rows with additional columns.
Data in one source column is used to determine the new column for a row, and another source column is used as the data for that new column[2].
In a commercial DBMS, the PIVOT operator is a built-in operator. Since PIVOT operator can perform transposition it can help evaluating horizontal aggregations. The PIVOT method internally needs to determine how many columns are needed to store the transposed table and it can be combined with the GROUP BY clause.
The syntax for PIVOT provides is simpler and more readable than the syntax that may otherwise be specified in a complex series of SELECT...CASE statements.
The following is syntax for PIVOT.
SELECT <non-pivoted column>,
[first pivoted column] AS <column name>,
[second pivoted column] AS <column name>,
[last pivoted column] AS <column name>
FROM
(<SELECT query that produces the data>) AS <alias for the source query>
PIVOT (
<aggregation function>(<column being aggregated>)
FOR
[<column that contains the values that will become column headers>]
IN ( [first pivoted column], [second pivoted column], ... [last pivoted column])
)
AS <alias for the pivot table> <optional ORDER BY clause>;
4.
PROPOSED SYSTEM
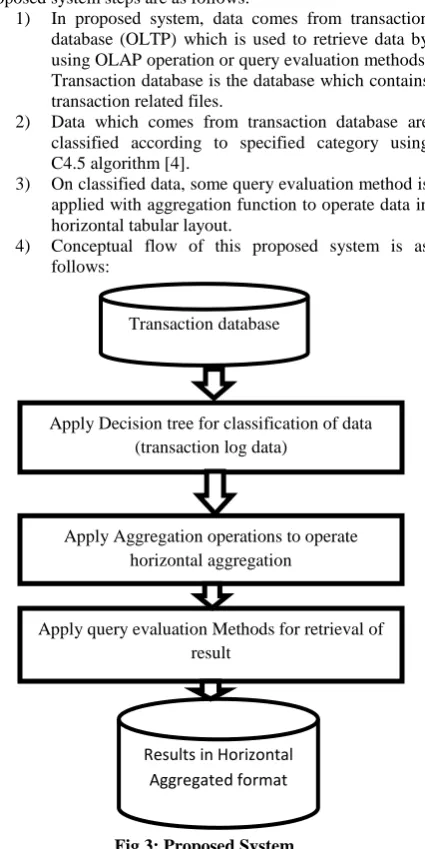
Proposed system steps are as follows:
1) In proposed system, data comes from transaction database (OLTP) which is used to retrieve data by using OLAP operation or query evaluation methods. Transaction database is the database which contains transaction related files.
2) Data which comes from transaction database are classified according to specified category using C4.5 algorithm [4].
3) On classified data, some query evaluation method is applied with aggregation function to operate data in horizontal tabular layout.
[image:4.595.326.539.322.747.2]4) Conceptual flow of this proposed system is as follows:
Fig 3: Proposed System
Apply Decision tree for classification of data (transaction log data)
Apply query evaluation Methods for retrieval of result
Apply Aggregation operations to operate horizontal aggregation Transaction database
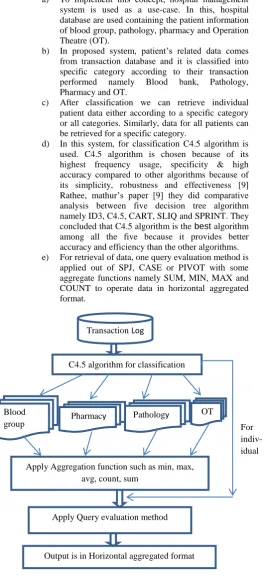
a) To implement this concept, hospital management system is used as a use-case. In this, hospital database are used containing the patient information of blood group, pathology, pharmacy and Operation Theatre (OT).
b) In proposed system, patient’s related data comes from transaction database and it is classified into specific category according to their transaction performed namely Blood bank, Pathology, Pharmacy and OT.
c) After classification we can retrieve individual patient data either according to a specific category or all categories. Similarly, data for all patients can be retrieved for a specific category.
d) In this system, for classification C4.5 algorithm is used. C4.5 algorithm is chosen because of its highest frequency usage, specificity & high accuracy compared to other algorithms because of its simplicity, robustness and effectiveness [9] Rathee, mathur’s paper [9] they did comparative analysis between five decision tree algorithm namely ID3, C4.5, CART, SLIQ and SPRINT. They concluded that C4.5 algorithm is the best algorithm among all the five because it provides better accuracy and efficiency than the other algorithms. e) For retrieval of data, one query evaluation method is
[image:5.595.30.297.78.656.2]applied out of SPJ, CASE or PIVOT with some aggregate functions namely SUM, MIN, MAX and COUNT to operate data in horizontal aggregated format.
Fig 4: Conceptual Flow of the proposed system
4.1
C4.5 Classification Algorithm
C4.5 algorithm is an improved version of ID3, which uses Gain Ratio as splitting criteria. This algorithm handles both continuous and discrete attributes. To handle continuous attributes, C4.5 creates a threshold and then splits the list into those whose attribute value is above the threshold and those that are less than or equal to it & the data is sorted at every
node of the tree in order to determine the best splitting attribute. The main advantages of C4.5 is it handles training data with missing attribute values
In general, missing data are simply ignored when a decision tree is built. The gain ratio is calculated by looking only at the other records, which have a value for that attribute. In order to classify a record with a missing attribute value, the attribute values for the other records can be used to predict the same.
If S is the set of training data denoting a concept with c classes, f(Cj, S) is the frequency of class Cj occurring in that set, then the expected information required to classify a given class in S is:
2 1
(
,S)
(
, )
( )
log (
)
|
|
|
|
c
j j
j
f C
f C S
Info S
S
S
(1)
when an attribute, A, with v values, has been selected as a test attribute, then the expected information needed to identify a class under that test is:
1
|
|
( )
( )
|
|
v i A i iS
Info S
Info S
S
(2)
where S1, S2, . . ., Sv is the subset of S all of whose instances possess value i for attribute A.
The information gain is the difference between the expected information needed to identify a class with and without the test on attribute A:
1
|
|
( )
( )
( )
|
|
v i i iS
Gain A
Info S
Info S
S
(3)
The attribute giving the maximum information gain is selected as the current split. The gain criterion is biased towards the high frequency data. To restructure this problem, C4.5 normalizes the information gain by the amount of the potential information generated by dividing T into v subsets:
2 1
|
|
|
|
inf ( )
log (
)
|
|
|
|
v
i i
i
S
S
Split
o A
S
S
(4)
C4.5 selects the test to partition the set of available cases is defined as:
( )
( )
inf ( )
gain A
GainRatio A
Split
o A
(5)C4.5 selects the test that maximizes gain ratio value. It uses
multi-way splits. Post-pruning technique is used by C4.5 to reduce the size of the decision [3].
5.
RESULTS
The query evaluation techniques and classification algorithm are implemented on Intel(R) Core(TM) i5-3337U CPU @1.80 GHz,6 GB RAM. Microsoft visual studio and MS SQL Server 2008 is used as platform. We have applied these techniques on 5k records.
In proposed system, C4.5 classification algorithm is used when we wanted to retrieve all patient’s data or single patient’s data which belongs to specific category in horizontal tabular layout. The results of all patient’s data according to specific category are as follows:
Blood
group Pharmacy
macy
Pathology OT
Apply Aggregation function such as min, max, avg, count, sum
Transaction Log
Database
C4.5 algorithm for classification
Apply Query evaluation method
Output is in Horizontal aggregated format
For indiv-idual
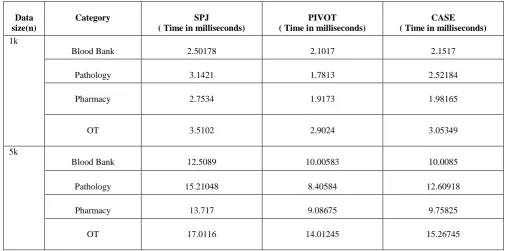
Table III : Query Execution time for retrieval of all patients data in Horizontal aggregated format using C4.5 algorithm
Data size(n)
Category SPJ
( Time in milliseconds)
PIVOT ( Time in milliseconds)
CASE ( Time in milliseconds)
1k
Blood Bank 2.50178 2.1017 2.1517
Pathology 3.1421 1.7813 2.52184
Pharmacy 2.7534 1.9173 1.98165
OT 3.5102 2.9024 3.05349
5k
Blood Bank 12.5089 10.00583 10.0085
Pathology 15.21048 8.40584 12.60918
Pharmacy 13.717 9.08675 9.75825
OT 17.0116 14.01245 15.26745
In the above table n is a size of data. There are different readings for different size of data as well as for different category namely Blood Bank, Pathology, Pharmacy and OT. These are some readings for retrieving data of all the patients who performed transactions in Blood Bank, Pathology, Pharmacy and OT respectively.
0 0.51 1.52 2.53 3.54
Bloo
d
Ba
n
k
Pa
th
o
logy
Ph
ar
m
ac
y
OT
1k
SPJ ( Time in milliseconds)
PIVOT ( Time in milliseconds)
[image:6.595.170.544.439.592.2]CASE ( Time in milliseconds)
Fig 5: Graph for retrieval of 1k records
0 5 10 15 20
B
lo
o
d
B
an
k
P
at
h
o
lo
gy
P
h
ar
m
ac
y
OT
5k
SPJ ( Time in milliseconds)
PIVOT ( Time in milliseconds)
CASE ( Time in milliseconds)
Fig 6: Graph for retrieval of 5k records [image:6.595.60.281.440.592.2]
6.
CONCLUSION
In this paper, dataset is constructed in horizontal tabular layout by using three provisions of SQL which are used to build aggregations namely SPJ, CASE and PIVOT. When these provisions are used, the underlying commands are executed and datasets are generated in horizontal format. These operators can be used in OLAP application where huge amount of historical data is analyzed. We built this operator for horizontal aggregation same as that we built for vertical aggregation, but optimization techniques which are used for standard (Vertical) Aggregation is not suitable for Horizontal Aggregation. Hence, optimization technique for Horizontal Aggregation using C4.5 Algorithm with three query evaluation methods namely SPJ, CASE and PIVOT has been proposed. It is observed that, query execution is significantly faster when we use C4.5 Algorithm with these three query evaluation methods to retrieve data in horizontal tabular format. The query execution time required for PIVOT and CASE methods to retrieve data in horizontal aggregated format is less as compared to SPJ. We plan to analyze the behavior of proposed system with large amount of datasets and study query optimization strategies which is more precise and efficient in theoretical terms with I/O cost model.
7.
REFERENCES
[1] C.C. Ordonez, and Zhibo Chen, “Horizontal Aggregation in SQL to prepare Data Sets for
Data Mining Analysis,” IEEE Transactions on Knowledge and Data Engineering (TKDE), April 2012. [2] C. Cunningham, G. Graefe, and C.A. Galindo-Legaria,
“PIVOT and UNPIVOT: Optimization and Execution Strategies in an RDBMS”, Proc. 13th Int’l Conf. Very Large Data Bases (VLDB ’04), pp. 998-1009, 2004.
[3] Venkatadri.m, Lokanatha C. Reddy”A Comparative Study On Decision Tree Classification Algorithms In
Data Mining”ISSN: 0974-3596, April ’10 – Sept ’10, Volume 2 : Issue 2, Page: 24.
[4] R. Rakesh Kumar, A. Bhanu Prasad,” K Means Clustering Algorithm for Partitioning Data Sets Evaluated From Horizontal Aggregations”, IOSR Journal of Computer Engineering (IOSR-JCE) e-ISSN: 2278-0661, p- ISSN: 2278-8727Volume 12, Issue 5 (Jul. - Aug. 2013), PP 45-48.
[5] Joyce Jackson, Data Mining: A Conceptual Overview. Communications of the Association for Information Systems (Volume 8, 2002) 267-296.
[6] Xindong Wu, Vipin Kumar, J. Ross Quinlan, Joydeep Ghosh, Qiang Yangb,Hiroshi Motoda, Geoffrey J. McLachlan, Angus Ng, Bing Liu, Philip S. Yu, Zhi-Hua Zhou, Michael Steinbach, David J. Hand, Dan Steinbergand, ”Top 10 algorithms in data mining”, Received: 9 July 2007 / Revised: 28 September 2007 / Accepted: 8 October 2007 Published online: 4 December 2007 © Springer-Verlag London Limited 2007.
[7] J. R. Quinlan, “C4.5: Programs For Machine Learning”. Morgan Kaufmann Los Altos, 1993.
[8] Matthew N. Anyanwu, Sajjan G. Shiva , “Comparative Analysis of Serial Decision Tree Classification Algorithms”, International Journal of Computer Science and Security, (IJCSS) Volume (3) : Issue (3).
[9] Anju Rathee, Robin prakash mathur, ”Survey on Decision Tree Classification algorithms for the Evaluation of Student Performance”, International Journal of Computers & TechnologyVolume 4 No. 2, March-April, 2013, ISSN 2277-3061.
[10] Durka.C, Kerana Hanirex.D,”An Efficient Approach for Building Dataset in Data Mining”, IJARCSSE, Volume 3, Issue 3, March 2013.