Static Hand Gesture Recognition for Sign Language
Alphabets using Edge Oriented Histogram and
Multi Class SVM
S.Nagarajan
Assistant Professor Department of CSE, Annamalai University, Annamalai nagar, Tamil Nadu, India
T.S.Subashini
Associate Professor, Department of CSE, Annamalai University, Annamalai nagar, Tamil Nadu, India
ABSTRACT
In recent years, enormous research is progressing in the field of Computer Vision and Human Computer Interaction where hand gestures play a vital role. Hand gestures are more powerful means of communication for hearing impaired when they communicate to the normal people everywhere in day to day life. As the normal people find little difficulty in recognizing and interpreting the meaning of sign language expressed by the hearing impaired, it is inevitable to have an interpreter for translation of sign language. To overcome this difficulty, an automatic hand gesture recognition system which translates the sign language into text needs to be developed. In this paper, a static hand gesture recognition system for American Sign Language using Edge Oriented Histogram (EOH) features and multiclass SVM is proposed. The edge histogram count of input sign language alphabets is extracted as the features and applied to a multiclass SVM for classification. The average accuracy of the system is compared with different number of features and the experimental findings demonstrate that the proposed method gives a success rate of 93.75%.
Keywords
Hand Gesture Recognition, Sign Language Recognition, Human Computer Interaction, Feature Extraction, Edge Oriented Histogram, Support Vector Machine.
1.
INTRODUCTION
The usage of computers is found in all the fields nowadays. However, the interaction between man and the machine is carried out only through the conventional input devices such as keyboard, mouse etc., Hence, the computers require some other ways for more convenient and efficient interaction with the human being by using speech or body language which includes gestures and postures. Gestures may be of two types namely static gestures [1] and dynamic gestures [2]. These gestures are shown by finger spelling. Several researchers are working in the area of Human Computer Interaction [3], since the main objective of HCI is to create a simple, visual interface for providing a natural way of communication between human and computer. The visual interface is created using the hand gestures and head movements. Hand gesture recognition is used in many typical applications such as computer game's control, virtual mouse, turning on/off the domestic appliances, and gesture based navigation of medical images during surgery. For hearing impaired, sign language is the only way of communication which employs different signs made by moving the hands in combination with facial expressions and postures of the body. Hand gesture Recognition is one of the areas which has high applicability and helps the community of hearing impaired using image
processing techniques and computer vision. In this proposed technique, the signer need not wear any specialized hardware equipment or colour gloves. In this paper, the American Sign Language alphabets are recognized using static hand gestures by vision based approach.
The paper is organized as follows. Section 2 explains the various work done so far in this area. Section 3 describes the proposed system with its architecture. Section 4 comprises the experimental results and discussion. Section 5 concludes with future work.
2.
RELATED WORK
Many research works have been done during the past two decades in the area of vision based hand gesture recognition. The overall objective of this subject is to help the hearing impaired people to communicate with the normal people, and replace the conventional language with sign language. Another application of gesture language is human-computer interaction, which uses hand gestures as input data to a computer through webcam. In HCI, a visual interface is created to provide a natural way of communication between man and machine [4].
Volume 82 – No4, November 2013 using PCA [13]. Using the reduced Gabor features, gestures
are recognized by SVM. Discrete Wavelet Transform features are used to train the neural network in recognition of Persian Sign Language in [14].
Various colour models are used in the segmentation of hand in the gesture recognition system. The perceptual colour space is used for hand gesture recognition [15] for wireless robot control applications. The finger spelling is dependent on the specific language of a country. Finger spelling [16] is used in Indian sign language, American Sign Language, British Sign Language, Chinese sign Language, Persian Sign Language, Arabic sign language, Malaysian sign language for recognition of sign language.
3.
PROPOSED SYSTEM
The proposed methodology consists of five stages which include image acquisition, image pre- processing, segmentation, feature extraction and classification. The general architecture of the proposed hand gesture recognition system is shown below in Fig.1.
Fig. 1Architecture of the proposed system
3.1.
Image Acquisition
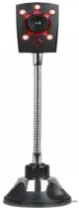
In this work, the hand gestures of American Sign Language alphabets were used for recognition purpose. With reference to [17], all the static hand gesture images were captured in real time with the resolution of 320 x 240 pixels using Zebronics Clarion USB 2.0 webcam and the data set was prepared. The camera has the still image resolution of 25 megapixels and the video capture resolution of 640 x 480 pixels and 320 x 240 pixels. The webcam used in this work is shown in Fig.2. The images were acquired by the webcam in real time without projecting the arm of the signer and were saved in .png format. The user need not wear any special clothes for preventing the projection of arms, since the proposed method does not incorporate any wrist cropping technique.
The image database contains totally 720 images for 24classes of American Sign Language alphabets, each class containing 30 images. The images were captured with different signers, different lighting conditions and with different orientation. For creating the image database, 10 images for each class were captured with 3 signers and archived. The experimental setup requires a simple plain background since this work is not concerned with complex background. The signer is required to maintain a distance of less than 1 m from the web camera. The camera is fixed at a predetermined position to capture the sign which is shown by the signer, thereby preventing the vibration of the camera. Proper illumination is to be given during the image acquisition so as to capture a clear hand image.
[image:2.595.318.539.289.477.2]All the gestures in the American Sign Language database are static in nature except the alphabets 'J' and 'Z'. Since these two gestures are dynamic which involve movement of fingers, they are out of focus of study in this proposed system and they are not included in the dataset. The dataset of American Sign Language is given in Fig.3.
Fig. 3 American Sign Language Dataset
3.2.
Image Pre-processing
The captured hand gesture images are in RGB colour space. In the pre-processing step, the input image is first resized into the size of 200 x 200 pixels. Image resizing is done to reduce the processing time by the computer and to improve the accuracy of the system. The resized image is then converted into a gray scale image which has the gray level intensity ranging from 0 to 255. To reduce the effect of illumination changes and scaling. The gray scale image is normalized using the equation that follows.
y = ((x - min) * 255 / (max - min)) (1)
Where x = gray scale intensity of original image, y = gray scale intensity of output image after normalization, min = minimum gray scale intensity value of the original
image, max = maximum gray scale intensity value of the original image.
[image:2.595.64.276.307.433.2] [image:2.595.147.187.624.731.2]differentiates the foreground and background pixels easily and segments the hand from the image. After segmentation, the hand region in the image would become white and the background would become black.
3.4.
Morphological Operations
As the segmented hand image still contains noise, various image morphological operations such as erosion and dilation [18] are performed on it. The smaller connected components which are less than 300 pixels present in the background of the image are eliminated and only the biggest connected component i.e., the hand is retained in the image using labeling. Then the labeled image is subjected to filtering for noise removal. In image processing, noise reduction is most often performed on an image and it is the typical pre-processing step to enhance the result of further pre-processing such as edge detection on an image. Median filter is a non-linear filter which is used to remove noise. The 3x3 mask median filter is applied to smoothen the hand image which is used for edge detection in the next stage.
3.5.
Canny Edge detection
The main objective of edge detection is to significantly reduce the amount of data and to filter out the useless information in an image while preserving its structural properties. In this work, canny operator is used to detect the edges of the filtered image, since it is the optimal and widely used as edge detection technique in research.
An optimal edge detection algorithm should be able to mark as many real edges as possible and any noise which is present in the original image should not create false edges. As these requirements are satisfied by Canny edge detection algorithm [19], it is used in this work. The outputs at various stages of the proposed system are shown in Fig.4.
3.6.
Feature Extraction
Feature extraction is the important stage in image processing. After finding the edges of the hand image using canny edge detection technique, the Edge Oriented Histogram features are extracted from it. The pseudo code for the proposed feature extraction algorithm is given below.
Pseudo code of feature extraction algorithm:
_________________________________________________ 1. Read the Gray scale image Igray and Canny edge image
Iedge.
2. Initialize the number of histogram bins as 'k', where k=0 to n-1. ( n = 16 or 32 or 64 or 128.)
i.e., range of gray level intensity falling in each bin = 256/number of histogram bins.
For 64 bins, the gray intensity range per each bin is given by [0-3] [4-7][8-11][12-15]... [252-255].
3. For every edge pixels of Iedge, say i =1 to m , where m =total no. of edge pixels
begin
4(a).Find the corresponding gray level intensity of the edge pixel from Igray.
If the gray level intensity falls in any of the bink, then
4(b).Increment the count of respective bink.
(For example, if gray scale value = 8, then count of bin2 is incremented by 1)
end end
4(c).Go to next edge pixel, i= i+1 5.Repeat the steps 4(a) & 4(b). 6.if i >m, exit the loop end
7. Display the histogram count of all the bins.
_______________________________________________ In this work, 16, 32, 64 and 128 histogram features are extracted from the canny edge image and the experimental results are compared. The number of features represents number of edge histogram bins. The edge oriented histograms of a training image for alphabet 'A' is given in Fig.5.
Volume 82 – No4, November 2013
Fig. 5 Edge oriented histograms of alphabet 'A' for 16, 32, 64 & 128 features
3.7.
SVM Classification
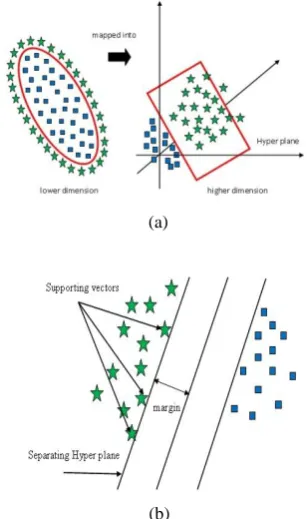
Support Vector Machine [20],[21] is a linear classifier which is based on the principle of maximization of margin between two sets of data. It is a powerful machine learning technique for classification and regression. It performs classification by constructing N-dimensional hyper plane which separates the input data into two categories in an optimal way. As a supervised learning algorithm, it is more popular for classification and regression task since it generalizes well the unknown dataset by avoiding the over fitting of data. SVM has been successfully used for many classification tasks such as EEG signal classification, handwritten character recognition, face recognition etc., SVM was developed by Vapnik in 1998 and it is a new class of learning machine which use support vectors and kernels for learning. The kernel machines provide a framework which can be adapted to different tasks and domains by choosing appropriate kernel function. Basically, SVM was developed for binary classification and later on it was extended to solve multi class classification using one against all strategy. In multi class SVM, multiclass labels are decomposed into several two class labels and it trains the classifiers to solve the problems and the solution of multi class problem is reconstructed from the outputs of classifiers. The one against all strategy comprises of constructing one SVM per class, which is trained to distinguish the samples of one class from the samples of all remaining classes. Generally, classification of an unknown pattern is done according to the maximum output among all SVMs.
In the literature of SVM, a predictor variable is known as an attribute and the attribute which is transformed defines a hyper plane, and it is called a feature. The task which is called as feature selection chooses the most suitable representation. The goal of SVM modeling is to find the optimal hyper plane that separates cluster of vectors in such a way that the cases with one category of the target are on one side of the hyper plane and the cases with other category are on the other side of the plane. The vectors near the hyper plane are known as 'Support Vectors'. Fig.6 shows the overview of SVM process. Many classification problems involve high dimensional and noisy data. SVM is normally able to deal with (a) more than
(a)
(b)
Fig. 6 Overview of SVM (a) non-linear problem, (b) linear problem
The margin of a linear classifier in SVM is defined as the distance from the closest training sample to the decision boundary. SVM is a binary classifier and the discriminant function value g(x) holds ±1 for two classes. The margin is as 1/ǁwǁ where ǁwǁ is the norm of w. In nonlinear separable case, it is difficult to find the hard margin with zero classification error. Hence a slack variable ξi is introduced to allow misclassification for few training samples near the marginal hyper plane. In SVM, a kernel function Φ (x) maps two dimensional input space into a 3 - dimensional feature as shown in fig 6(a) and (b). A kernel function may be any of the symmetric functions that satisfy the Mercer's conditions [22]. There are several SVM kernel functions as given below. Polynomial Kernel: (xt.xi+1)
p
(2)
Gaussian Kernel: exp[-ǁxt
- xiǁ 2/ 2σ2
] (3)
Sigmoidal Kernel:
Tanh(β0(xt.xi) + β1 ) (4)
where x is the input patterns, xi is the support vectors, p is the degree of polynomial.
σ2 is variance, 1≤ i ≤ N
s, where Ns is the number of support
vectors.
β0 and β1 are constant values.
4.
EXPERIMENTAL RESULTS &
DISCUSSION
[image:4.595.59.282.77.229.2]problem into 'n' number of two class problems and classifies the test data. In the training stage, the features extracted are fed to SVM training and the input feature vectors are trained. The SVM Torch creates 24 training models during training phase. In the testing phase, the SVM outputs the correct class of the test image by matching the test model with the already trained models and the corresponding alphabet for the classified image is displayed in the form of text. Fig. 7 and 8 show the recognition rate and the confusion matrix of ASL alphabets for 64 features.
[image:5.595.53.282.188.326.2]Fig. 7 Recognition rate of alphabets for 64 features
Fig. 9 Edge Histograms of few training images
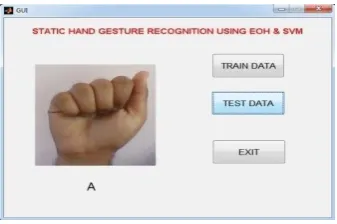
[image:5.595.345.514.287.399.2]The graphical user interface for the proposed static hand gesture recognition system is shown in Fig. 10.
Fig. 10 GUI of the proposed system
[image:5.595.76.508.440.749.2]Volume 82 – No4, November 2013 The edge histograms are extracted as the features during the
[image:6.595.319.543.82.158.2]feature extraction phase and the edge histograms of few training images which represent the ASL alphabets B, K, L and Y are shown in the Fig 9.
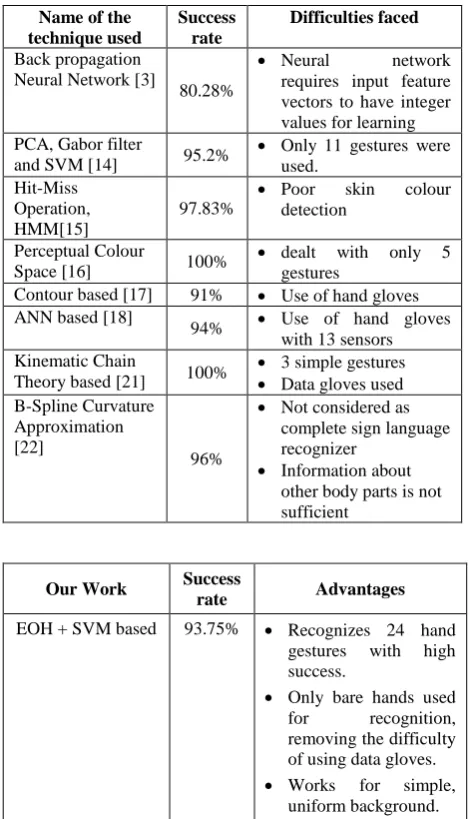
Table 1. Comparative study between our work and other approaches
Name of the technique used
Success rate
Difficulties faced
Back propagation Neural Network [3]
80.28%
Neural network requires input feature vectors to have integer values for learning PCA, Gabor filter
and SVM [14] 95.2%
Only 11 gestures were used.
Hit-Miss Operation, HMM[15]
97.83%
Poor skin colour detection
Perceptual Colour
Space [16] 100%
dealt with only 5 gestures
Contour based [17] 91% Use of hand gloves ANN based [18]
94% Use of hand gloves with 13 sensors Kinematic Chain
Theory based [21] 100%
3 simple gestures Data gloves used B-Spline Curvature
Approximation [22]
96%
Not considered as complete sign language recognizer
Information about other body parts is not sufficient
Table 1. gives a brief comparative study between our work with the other related works. As the training samples for some of the alphabets such as A, E, and S have similarities between them, they were misclassified in the testing stage. This is due to the change in orientation of the hand during image acquisition.
[image:6.595.47.282.151.561.2]Similarly, the alphabet M was misclassified as N, since they are identical to each other. Table 2. shows the number of correctly recognized samples for each class with respect to different number of features. The misclassified samples are shown in Fig. 11. The accuracy of the system is calculated by
Fig. 11 Misclassified samples
Table 2. Recognition results for different no. of features
Sign
16 Bins 32Bins 64 Bins 128 Bins
Co
rre
ct
In
co
rre
ct
Co
rre
ct
In
co
rre
ct
Co
rre
ct
In
co
rre
ct
Co
rre
ct
In
co
rre
ct
A 9 1 9 1 10 0 8 2
B 9 1 8 2 9 1 9 1
C 10 0 10 0 10 0 9 1
D 8 2 9 1 10 0 8 2
E 9 1 10 0 9 1 7 3
F 10 0 10 0 10 0 7 3
G 8 2 9 1 9 1 6 4
H 8 2 9 1 9 1 8 2
I 10 0 9 1 10 0 10 0
K 8 2 10 0 9 1 8 2
L 9 1 10 0 10 0 6 4
M 7 3 9 1 9 1 8 2
N 8 2 9 1 8 2 5 5
O 10 0 10 0 10 0 9 1
P 9 1 10 0 9 1 7 3
Q 9 1 9 1 10 0 9 1
R 8 2 9 1 10 0 10 0
S 6 4 5 5 7 3 6 4
T 9 1 8 2 9 1 9 1
U 9 1 10 0 10 0 9 1
V 10 0 9 1 10 0 7 3
W 9 1 10 0 9 1 8 2
X 8 2 9 1 9 1 8 2
Y 10 0 9 1 10 0 8 2
Total 210 30 219 21 225 15 189 51
In the above table, the total number of test images per class = 10.
Our Work Success
rate Advantages
EOH + SVM based 93.75% Recognizes 24 hand gestures with high success.
Only bare hands used for recognition, removing the difficulty of using data gloves. Works for simple,
[image:6.595.309.548.183.595.2] [image:6.595.308.549.194.583.2] [image:6.595.317.546.624.730.2]CLASSIFIER PERFORMANCE MEASURES:
[image:7.595.316.542.72.208.2]The performance of the classifiers produced by the Supervised Machine Learning (SML) can be evaluated in many ways. The measures of the quality of classification are derived from a confusion matrix which reveals the correctly recognized and misclassified samples for each class. Table 3. presents a confusion matrix for binary classification, where tp stands for true positive, fn stands for false negative, fp stands for true positive and tn stands for true negative counts. The various quality measures used to evaluate the performance of classifier are mentioned in [23].
Table 3. Confusion matrix of binary classification
Class/ Recognized
As Positive As Negative
Positive tp fn
Negative fp tn
Accuracy: n p n p n p t f f t t t Accuracy (5) Sensitivity/Specificity: n p p
f
t
t
y
Sensitivit
(6) n p nt
f
t
y
Specificit
(7) Precision/Recall/F-Score: p p pf
t
t
Precision
(8)n p p
f
t
t
Recall
(9) Recall Precision ) Recall * Precision ( * 2 Score F
(10)
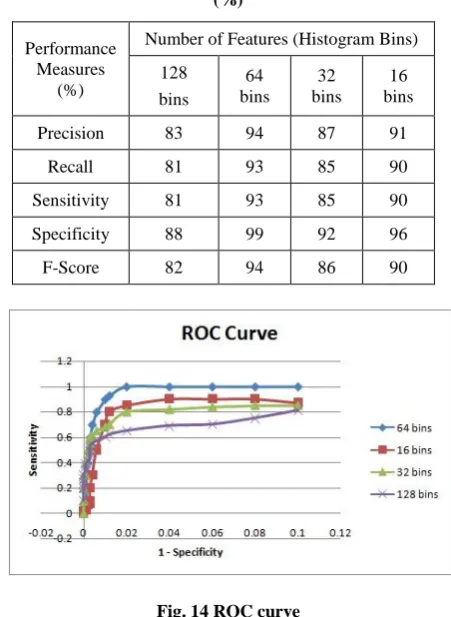
The quality measures such as precision, recall, sensitivity, specificity and F-score of the classifier are calculated for different number of features. The resultant values are tabulated in Table 4. The graph showing the classifier performance in terms of various quality measures is given in Fig.13. The Receiver Operating Characteristic (ROC) curve which is plotted with sensitivity and specificity is shown in Fig.14. thereby interpreting that the performance of the system is superior and the sensitivity is high when 64 features are considered for feature extraction.
Fig. 13 Graph showing classifier performance
Table 4. Summary of Classifier performance measures in (%)
Performance Measures
(%)
Number of Features (Histogram Bins)
128 bins 64 bins 32 bins 16 bins
Precision 83 94 87 91
Recall 81 93 85 90
Sensitivity 81 93 85 90
Specificity 88 99 92 96
[image:7.595.50.255.196.606.2]F-Score 82 94 86 90
Fig. 14 ROC curve
5.
CONCLUSION AND FUTURE WORK
The edge oriented histograms for feature extraction and multi class SVM for classification of hand gestures were investigated and analyzed in this paper. The experimental results show that the proposed system gives an overall success rate of 93.75%. The feature wise comparison is performed for calculating the accuracy of the system. The proposed system produces the highest accuracy with 64 features and its accuracy rate is lower while considering 16, 32 and 128 features.
Some of the alphabets are misclassified due to the orientation of the hand in front of the camera as well as the similarity between few gestures such as A, E and S. A little change in orientation of input gestures makes a significant change in the feature vectors, and offers reduced rates of recognition. However, the proposed method has yielded satisfactory result compared to other existing approaches. In this work, only 10 images per class were considered for testing. In future, the dynamic hand gestures for words would be recognized in a
0 20 40 60 80 100 120
Precision recall Sensitivity Specificity
P e rf or m an ce (i n % ) Quality Measures
Classifier performance chart
64 bins
32 bins
16 bins
[image:7.595.314.540.244.553.2]Volume 82 – No4, November 2013 background independent environment and the number of test
cases would also be extended further.
6.
ACKNOWLEDGEMENT
The authors thankfully wish to acknowledge the final year Post Graduate students of Computer Science & Engineering for their help in acquisition of input hand gestures in real time and preparing the image database of ASL alphabets.
7.
REFERENCES:
[1] Singha.J, and Das.K, "Hand Gesture Recognition based on Karhunen-Loeve Transform", Mobile and Embedded Technology International Conference (MECON), January 17-18, 2013, pp 365-371.
[2] Joyeeta Singha, and Karen Das, "Recognition of Indian Sign Language in Live Video", International Journal of Computer Applications, Vol.70, No.19, May 2013. [3] T.Kapsciinski and M.Wysocki, "Hand Gesture
Recognition for Man-Machine interaction", Second Workshop on Robot Motion and Control, October 18-20, 2001, pp.91-96.
[4] I.G.Incertis, J.G.G.Bermejo, and E.Z.Casanova, "Hand Gesture Recognition for Deaf People Interfacing", The 18th International Conference on Pattern Recognition (ICPR), 2006.
[5] Nasser H.Dardas, Nicolas D.Georganas, "Real-Time Hand Gesture Detection and Recognition Using Bag-of-Features and Support Vector Machine Techniques", IEEE Transactions on Instrumentation and Measurement, Vol.60, No.11, November 2011.
[6] Jayashree R.Pansare, Sharavan H.Gawande, Maya Ingle, "Real-Time Static Hand Gesture Recognition for American Sign Language (ASL) in Complex Background", Journal of Signal and Information Processing, 2012, Vol.3, pp 364-367.
[7] Md.AtiqurRahman, Ahsan-Ul-Ambia,Md.Aktaruzzaman, "Recognition of Static Hand Gestures of Alphabet in ASL", IJCIT, Vol.2, Issue 1, 2011.
[8] Rajesh Mapari, Dr.Govind Kharat, "Hand Gesture Recognition using Neural Network", International Journal of Computer Science and Network, Vol.1, Issue 6, December 2012.
[9] A.A.Randive, H.B.Mali, S.D.Lokhande, "Hand Gesture Segmentation", International Journal of Computer Technology and Electronics Engineering, Vol.2, Issue 3, June2012.
[10]Vaishali S.Kulkarni, Dr.S.D.Lokhande, "Appearance Based Recognition of American Sign Language Using
Gesture Segmentation", International Journal of Computer Science and Engineering, Vol.2, No.3, 2010, pp 560-565.
[11]Deval G.Patel, "Point Pattern Matching algorithm for recognition of 36 ASL gestures", International Journal of Science and Modern Engineering, Vol.1, Issue 7, June 2013.
[12]Joyeeta Singha, Karen Das, "Indian Sign Language Recognition Using Eigen Value Weighted Euclidean Distance Based Classification Technique", International Journal of Advanced Computer Science and Applications, Vol.4, No.2, 2013.
[13]D.Y.Huang, W.C.Hu, and S.H.Chang, "Vision based Hand Gesture Recognition Using PCA+Gabor filters and SVM", IEEE Fifth International Conference on Intelligent Information Hiding and Multimedia Signal Processing, 2009, pp 1-4.
[14]Ali Karami, Bahman Zanj, Azadeh Kiani Sarkalesh, "Persian sign language (PSL) recognition using wavelet Transform and neural Networks", ELSEVIER Journal of Expert Systems with Applications 38, 2011, 2661-2667. [15]Manigandan. M, I. M. Jackin, "Wireless Vision based
Mobile Robot control using Hand Gesture Recognition through Perceptual Color Space", IEEE International Conference on Advances in Computer Engineering, 2010, pp.95-99.
[16]S.Saengsri, V.Niennattrakul, and C.A.Ratana mahatana, "TFRS: Thai Finger-spelling Sign Language Recognition System", IEEE, 2012, pp 457-462.
[17]ASL Dataset. http://personal.ee.surrey.ac.uk/
[18]Rafael C.Gonzalez, Richard E.Woods, "Digital Image Processing", Second Edition, 2005.
[19]Rafael C.Gonzalez, Richard E.Woods, Steven L.Eddins, "Digital Image Processing Using MATLAB", Pearson Education, 2007.
[20]V.Vapnik, "Statistical Learning Theory", Wiley, New York, 1998.
[21]SVM-Support Vector Machines: www.dtreg.com/SVM. htm
[22]Courant, Richard, and David Hilbert. "Methods of Mathematical Physics, Vol. I." Physics Today 7.5 (1954): 17-17.