http://dx.doi.org/10.4236/jep.2015.612120
How to cite this paper: Munguia, N., Velazquez, L., Perez, R., Rincón, D., Marin, M., Giannetti, B.F., Almeida, C.M.V.B. and Agostinho, F. (2015) Sustainability Assessment of Alternatives for Heat Generation and Transfer in Saunas. Journal of Envi-ronmental Protection, 6, 1378-1393. http://dx.doi.org/10.4236/jep.2015.612120
Sustainability Assessment of Alternatives
for Heat Generation and Transfer in Saunas
Nora Munguia1,2, Luis Velazquez1,2, Rafael Perez1, Daniel Rincón1, Martha Marin1,
Biagio F. Giannetti3, Cecília M. V. B. Almeida3, Feni Agostinho3
1Sustainability Graduate Program, Industrial Engineering Department, University of Sonora (UNISON), Hermosillo, Mexico
2Work Environment Department, University of Massachusetts Lowell, Lowell, MA, USA 3Production Engineering Graduate Program, Paulista University (UNIP), São Paulo, Brazil
Received 18 November 2015; accepted 13 December 2015; published 17 December 2015
Copyright © 2015 by authors and Scientific Research Publishing Inc.
This work is licensed under the Creative Commons Attribution International License (CC BY).
http://creativecommons.org/licenses/by/4.0/
Abstract
In the search for renewable energy sources, solar energy appears, among others, as a powerful al-ternative; mainly for those countries located at Earth’s equatorial region. This is the case of a Fresnel device that uses solar radiation to warm-up the air; for instance, within saunas. Authors coined the term sustainable technological innovation to refer to a technological innovation in ac-cordance to the principles of sustainability. The object of this research was comparing the sustai-nability of a Fresnel Lens Solar Concentration (FLSC) against the sustaisustai-nability of other twelve al-ternatives to generate heat. This article assesses the sustainability of fourteen technological op-tions for heat generation and transfer to saunas in the northwest region of Mexico where temper-atures often reach above 45 C and where there is a greater potential for exploiting solar energy. Emergy accounting, economic analysis, and global warming potential are the three indicators con-sidered in quantifying sustainability. Results show that infrared ceramic photovoltaic, infrared carbon photovoltaic and infrared metal photovoltaic are the most sustainable systems. The Fres-nel device reached the fourth and tenth position, using electricity from photovoltaic and from grid respectively, among all fourteen assessed devices, respectively. Although Fresnel equipment does not release any global warming gases into the atmosphere, or even it demands low amount of non- renewable resources, 1.40 and 4.47 E17 seJF/yr. it requires high economic investment, 20,800 and
79,600 USD/yr, for the implementation and operation phases, which decrease its sustainability performance compared to twelve other evaluated devices.
Keywords
1379
1. Introduction
Sustainable development is a very broad term often used which refers to current global issues such as excessive population growth, increasing regional famine, social inequality, water and energy, climate change and natural resources depletion [1]. Although this term was coined long time ago in 1987 [2], there is still a lot of debate about its real meaning [3].
Taking into account that sustainable development is based on social, economic and environmental pillars [4], which may lead toward a human development in a responsible manner [5]; energy must undoubtedly be one of its main questions. In fact, ensuring energy supply without the resulting environmental impacts is one of the greatest challenges in this century [6].
A secure, reliable, affordable, clean and socially energy supply is necessary to an economic growth and hu-man development [7]. However, most of the energy used nowadays is generated from non-renewable sources; by 2012, renewable energy constituted only 21% of the worldwide energy, although it is expected to increase to 33% by 2040 [8], [9]. Particularly in the case of Mexico, electricity generation relies heavily on the combustion of fossil fuels, 96% [10].
Renewable energy comes from sources that can be naturally replenished, this has a considerably lower impact on matters such as resource depletion and emissions when compared to traditional energy generation and con-sumption methodologies [11].
Solar energy has a huge potential to be used by society, since all energy available for use on Earth is direct or indirectly related to the sun [12]. This is particularly suitable along the Earth´s Sunbelt close to the Earth’s thermal equatorial region, which covers a vast amount of developing countries in central Africa and America
[13], [14].
The potential of the solar energy systems has opened new markets for sustainable entrepreneurs that seek to develop environmental sound technologies and with this, the emergence of solar technologies that are usually driven by technological innovations. Technological innovation refers to changes in the functionalities of the product; often, the change is not observable because it is internal to the product form [15]. However, they can be an efficient means of avoiding the pollution associated with conventional energy generation processes [16].
In many cases, sustainability is the mother lode of technological innovation [5]. This type of innovation can be radical, at new product level, or incremental and process oriented [17]. Often, radical innovation occurs be-fore incremental and process oriented innovation; this happened with solar concentrator technology that uses trackers with mirrors that follow the sun´s path and concentrate its heat. Actually, the most utilized technologi-cal approaches for small-stechnologi-cale applications are parabolic trough (PTSC) and Fresnel linear (FLSC) solar con-centrators; PTSC has the lead on the efficiency front [18]; on the other hand, FLSC might have had other ad-vantages in terms of mechanical difficulties and operation and maintenance expenses [19].
In any case, a sustainability appraisal system is necessary to assess its performance in each of the sustainabil-ity dimensions [20]. The appraisal system must have precise indicators to provide operational information in or-der to analyze trends and cause-and-effect relationships [21]. A complete quantitative assessment is necessary when it comes to finding alternatives that bring development to a more sustainable state.
Regarding electricity generation, the green-house-gas (GHG) emissions per kWh of generated energy is con-sidered a suitable parameter in defining the sustainability of the electricity system at different scales [22]. On the other hand, for a more grounded sustainable assessment, environmental considerations under a unique scale of analysis hardly will be enough to comprise all aspects related to a broader definition of sustainability [23].
As a complementary approach in quantifying electricity consumption to assess sustainability, the emergy me-thod appears to be very useful [24]. This is grounded in thermodynamic laws and a donor side perspective in quantifying value, which allows for taking into account natural resource use rates, efficient exploitation and waste carrying capacity [25].
The object of this research was to compare the sustainability of a Fresnel Lens Solar Concentration (FLSC) against the sustainability of twelve other alternatives to generate heat.
2. Methodology
1380
The sauna bathroom measures 2.3 by 1.8 meters with a total area of 4.15 m2 and a height of 2.1 meters. The total internal volume accounts for 8.69 m3. When in operation, the sauna is going to require a temperature of 75˚C for a capacity for up eight users. Sustainability was measured by means of the emergy accounting method, by an economic analysis, and by their global warming potential. More information on these methods is provided on the following sections.
2.1. Case Study
The premise of innovation is reinventing the means for completion of known goals, with existing knowledge and inputs recombined to enhance either the procedure itself or the resulting product as a new valuable output [27]. Innovation can take the form of a utility model that describes the capacity to improve a device, based on mar-ginal modifications. Usually, utility models have the potential for industrial application [28]. In developing countries, like Mexico, the utility model is recognized as a major constituent of environmentally related innova-tion [29].
For the purpose of this case study, authors coined the term sustainable technological innovation (STI) to refer to a technological innovation in accordance with the principles of sustainability. Traditionally, saunas use gas or electricity for heat generation; therefore, the use of solar energy would be a sustainable technological innovation (STI) that takes advantage of a renewable energy source. The main idea behind the STI is integrating the FLSC as a subsystem to the entire ecological environment of the sauna; taking into account that the natural environ-ment offers the conditions for the developenviron-ment of sports in harmony with nature [30]. Solar thermal concentra-tion techniques at small scale have been already tested [31].
Demonstrating its technical feasibility was not enough, for that reason, it was necessary to contrast the FLSC, in sustainability terms, against other heating alternatives. Figure 1 shows the heat sources considered in this re-search because they are the most widely adopted and sold in the market.
2.2. A Sustainability Assessment Model
[image:3.595.85.533.448.692.2]According to [33], ever since the use of thermodynamics in explaining ecosystem functioning, plenty of atten-tion has been given to the cause-effect relaatten-tion integrating input, state, and output for an evaluated system. Gen-erally, it is an open system where only matter and energy inputs are necessary to build and sustain the system’s
1381
functionality, including the internal structure, towards maximizing the conversion of energy and matter inputs into useful services and goods outputs.
The model on Figure 2 illustrates the representation of a production system, since its objective is using effi-ciently all system inputs from renewable resources by converting them into a network that maximizes produc-tion, which results in lower amounts of waste as output.
In relation to the “input”, the importance in quantity and quality of the resources as key elements on the sys-tem’s development is of recognition, where the use of environmental Emergy accounting [24] is noteworthy when compared to other approaches due to its systemic character, a donor side view in establishing value, and the recognition of energy quality. According to [33], although not having a strong anthropocentric relation with systems output, the use of Emergy on the “input” representation denotes a biophysical counterpart for this “out-put”; which then stands for the importance of environmental work, true wealth, needed for human action and acquisition of wellbeing. In this study, the non-renewable Emergy coming from economy “F” used by the sys-tem is considered an indicator for the distance between the syssys-tem itself and sustainability. It means that higher system dependence on “F” resources translates to higher distance to sustainability, because by definition “F” re-sources are classified as non-renewable rere-sources.
For the “state” aspect, [34] argue that an economy’s operation is based on the conversion from resources into goods and services useful to society; usually monetary value. Given the recognized importance and influence on decision making, monetary cost of implementing and maintaining the functioning of studied systems is consi-dered a measure of “state”.
As a measure of output, among several other alternatives, the global warming potential (GWP) indicator is being widely used and recognized as important due to climate change concerns around the world. In this sense, this work assumes that GWP is considered as representative for the “output” for the sustainability model adopted. For this purpose, the direct emissions of CO2, CH4 and NO2 are accounted for as byproducts of the
energy generation process supplying heat for the devices in Saunas.
Deeper details on the emergy accounting and economic approaches, as well as GWP indicator calculations used in this work are presented in the following sections.
2.2.1. Emergy Accounting
Emergy Accounting evaluates the environmental performance of the system on a global scale, accounting for all considered “free” environmental resources such as sunlight, wind, rain, soil, and the indirect environmental support embodied in human labor and services. This methodology has been used previously for decision making allowing efficient resource usage [35] since it considers the studied system’s energy flows [36] by integrating both a human and natural economies [37].
[image:4.595.232.394.552.618.2]The accounting is extended back in time to include the environmental work needed for resource formation, thus emergy is a measure of the past and present environmental support to any process occurring in the bios-phere [38]. According to the second law of classic thermodynamics, each transformation process degrades the available potential energy while the “quality” of the remaining energy in the product is increased. Energy quality is crucial when discussing emergy accounting, as expressed by the Emergy Intensity Values1.
Figure 2. Representation for the input-state-output model of a production system. Adapted from [34]. Legend: seJF = solar emjoules, a unit measure of emergy method; kgCO2-eq. = kilograms of carbon dioxide equivalent, an indicator of global warming potential.
State
Input Output
seJF $ USD kgCO2-eq.
1Emergy Intensity Value (also called the Unit Emergy Value—UEV) represents all emergy used to make a unit of product. The definition of
1382
Emergy accounting is organized as a top down approach. For its application, initially an energy system dia-gram using the symbols, proposed by [24] must represent the system under study. Subsequently, all raw values of energy and mass going into the system are multiplied by their respective emergy intensity values, resulting in flows represented with the same unit: solar emjoules (seJ). Finally, these flows are aggregated to calculate the emergy indices to draw conclusions about the system’s sustainability performance. Deeper understanding about Emergy Accounting rules, meanings and calculation procedure can be found mainly at [24] and [38].
Usually, the indices considered in emergy studies, shown in Figure 3, are UEV, Renewability (%R), Emergy Yield Ratio (EYR), Environmental Loading Ratio (ELR) and Sustainability Index (ESI), but sustainability in this analysis was characterized by the lowest possible dependency of resources from economy, usually labeled as non-renewable. Thus, the emergy indicator used to represent sustainability in this work is “F”, i.e. the feed-back from economy resources representing the sum of materials, energy, services and labor used by each indi-vidual heat supplier evaluated.
The feedback from economy indicator (“F”) was obtained by multiplying the raw data as presented in Ap-pendix B by its respective Unit Emergy Value as presented in Appendix A and by its respective partial renewa-bility as presented in Appendix B.
2.2.2. Economic Cost
Economic cost represents the market cost during implementation and maintenance phases for all 14 analyzed systems during a 20-year lifetime. After elaborating a database containing the quantitative amount of materials and services demanded for construction and maintenance of each heat system, the market values of each input into the system boundaries were obtained from regular market for the Mexican case in 2014. The Mexican cur-rency values, Mexican pesos, were converted to US dollars because it represents an international curcur-rency; for this, a conversion rate of 13.10 MXN/USD was used. All economic values are presented in Appendix B.
2.2.3. Direct Emissions
Emissions can be accounted for as direct (or local) and indirect (or global), according to different scales of anal-ysis. In this regard, see for instance [39]. For the purposes of this work, only the direct emissions are considered to evaluate the related emissions in using a particular energy source to obtain heat within sauna. For this, the following emission factors from [40] are considered: 1) wood and wood residuals = 1640 kgCO2/ton, 126
gCH4/ton, and 63gN2O/ton; 2) gas fuel = 7.76E−8 kgCO2/J, 3.94E−9 gCH4/J, and 7.89E−10 gN2O/J. To
[image:5.595.171.457.496.672.2]calcu-late the global warming potential (GWP) indicators, a 100-year time interval for impacts is considered under the following weight factors: 1) CO2 = 1; 2) CH4 = 25; 3) N2O = 298.
Figure 3. Generic energy diagram representing all energy sources involved in the transformation process. Symbols from [24]. Suffixes “n” and “r” stand for non- renewable and renewable respectively, referring to the renewable and nonrenew-able component of material and energy flows.
Transformation processes
Services from economy Materials
from economy
Renew-ables from
nature
Non-renewables from nature
Product S=Sn+Sr
M=Mn+Mr
R N
Total emergy: U=R+N+M+S
Emergy indices: UEV = U/system output %R=100(R+Mr+Sr)/U EYR=U/(M+S)
ELR=(N+Mn+Sn)/(R+Mr+Sr) ESI = EYR/ELR
System
F=M+S
1383
2.3. Graphical Representation of Results
Aiming to improve their interpretation, results are presented on a graphical design. All fourteen systems are plotted in the same graph, and for this, a linear normalization is considered to allow that all indicators ranges from zero (minimum value) to one (maximum value). This is done by setting the maximum value achieved by the highest rated system for a specific indicator to 1, while the lowest possible value is set to 0. Then, a linear proportion is used for all others indicators to make them comparable. The approach chosen provides two impor-tant pieces of information: 1) the hierarchy from better to worst system performance according to the three indi-cators of sustainability considered in this work; 2) the area obtained for each system by taking into account all three indicators represents the overall sustainability of that system, where a large area indicates worst compara-ble performance.
3. Results and Discussion
The energy diagrams of Figure 4 and Figure 5 show, through the use of a systemic perspective, all material and energy system’s inputs, internal relations, as well as the air heating outputs for the evaluated saunas. Due to si-milarity between some systems functioning, two representative diagrams were drawn by merging the electric heat source alternatives, including Fresnel, infrared ceramic, metal, carbon, and heater, in one diagram, while the other one represents firewood, pellets and gas technological options. The energy diagrams are representative models of reality as interpreted by the authors. One objective for these energy diagrams is to allow the reader a large-scale view, which can be considered useful to better understand the system’s functioning and potentials for improvement. Through these diagrams, both analysts and readers can understand the needed embodied energy by the systems to produce a good or service, even recognizing the importance of the so-called hidden energy flows that are usually disregarded from several sustainability analyses due to methodological constraints or also due to a lack of large-scale comprehension about the worldwide energy relationship.
Both energy diagrams provide information regarding the demand for external resources (indicated by circle components) and labor. Additionally, it can be seen how these external resources interact within systems boun-daries to produce a good or service, which are the warmed air to sauna and the sub-products as waste and emis-sions.
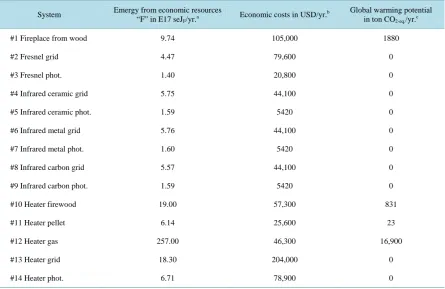
[image:6.595.159.467.474.681.2]After understanding the systems functioning including their dependence on external resources as well as their internal framework, the three methodologies considered in this work as representative of sustainability were ap-plied. Table 1 shows the three indicators obtained for the all fourteen assessed saunas heat sources. A high
Figure 4. Energy diagram of electric alternatives for heat source. It includes Fresnel, infrared ceramic, metal, carbon and heater evaluated systems as previously shown in Figure 1.
Infrared emitters Electricity
from grid
Blower Photovol-taic panel
Mirror, copper,
etc
Pipelines and oil
Water and rocks
Labor Services
Air
Sun
Warmed air to sauna
1384
Figure 5. Energy diagram of heat sources from natural gas and vegetal biomass burning. It includes heater (firewood, pellets, and gas) and fireplace from wood, as previously shown in Figure 1.
Table 1. Emergy, economic and emission flow analyses for the fourteen assessed heat suppliers. Values correspond to a 20- year lifetime per heater, including implementation and operation phases.
System Emergy from economic resources
“F” in E17 seJF/yr.a
Economic costs in USD/yr.b Global warming potential
in ton CO2-eq./yr.c
#1 Fireplace from wood 9.74 105,000 1880
#2 Fresnel grid 4.47 79,600 0
#3 Fresnel phot. 1.40 20,800 0
#4 Infrared ceramic grid 5.75 44,100 0
#5 Infrared ceramic phot. 1.59 5420 0
#6 Infrared metal grid 5.76 44,100 0
#7 Infrared metal phot. 1.60 5420 0
#8 Infrared carbon grid 5.57 44,100 0
#9 Infrared carbon phot. 1.59 5420 0
#10 Heater firewood 19.00 57,300 831
#11 Heater pellet 6.14 25,600 23
#12 Heater gas 257.00 46,300 16,900
#13 Heater grid 18.30 204,000 0
#14 Heater phot. 6.71 78,900 0
phot. = electricity from photovoltaic panels; aseJF/yr = (numbers from category column in Appendix B) × (UEVs presented in Appendix A) × (1-Par-
tial renewability); bEconomic costs available at Appendix B; GWP calculated by using raw data of Appendix Band coefficients presented in the pre-viously “2.2.3. Direct emissions” section.
Wood and pellets
Bricks and wool
Natural
gas Steel
Pipelines: copper,
plastic
Water and rocks
Labor Services
Air
Warmed air to sauna
Waste Solid and liquid waste
[image:7.595.92.538.401.690.2]1385
amount of non-renewable resources “F” is demanded by system #12 gas heater (257.00 E17 seJF/yr), which
represents about 10 times that of the second worst performance obtained by system #10 firewood heater (19.00 E17 seJF/yr), followed by system #13 heater grid (18.30 E17 seJF/yr). This is a very interesting result because it
was not expected since the economic cost of heater gas and firewood are not the most expensive devices. On the other hand, as emergy methodology considers a large-scale approach in its framework calculation, it means that both heaters (gas and firewood) demand indirectly, and usually not marketable, a large amount of global re-sources which implies in higher emergy for them. Due to this kind of result, the use of a multi-criteria approach instead of unique indicators to represent sustainability can be considered as more appropriate. All other systems demand non-renewable resources ranging from 1.40 to 9.74 E17 seJF/yr, placing systems #3 Fresnel photovol-taic, #5 infrared ceramic photovoltaic and #7 infrared metal photovoltaic as the best performers for this particu-lar sustainability indicator.
Different results were obtained when considering economic costs, in which case the worst performance was obtained by systems #13 heater grid with 204,000 USD/yr, followed by systems #1 fireplace from wood, #2 Fresnel grid, and #14 photovoltaic heater. For all other systems, the economic cost ranges from about 5,000 to 57,000 USD/yr, in which systems #5 infrared ceramic photovoltaic and #9 infrared carbon photovoltaic have the best overall performance with 5420 USD/yr.
Under this criterion, currency, only those resources that have market value are accounted for and valuated under an anthropocentric approach as willing-to-pay. Thus, free-of-charge resources are disregarded in the evaluation, and some are undervalued compared to an emergy perspective. For example, while natural gas or wood energy can reach high values under an emergy view, i.e. high transformity, their market value can be seen as low due to governmental subsidies. Emergy method does not allow this kind of subjectivity. Due to this main difference in the scientific bases for both metrics, results are also different when comparing economic versus emergy methods.
The third sustainability indicator considered in this work expressed by Global Warming Potential (GWP) showed that systems from #2 to 9, #13 and #14 are not CO2 emitters—at least not at local scale as considered in
this work—, thus those systems have the best performance for GWP. This behavior was already expected since the energy source supporting these systems comes from electricity (grid or photovoltaic) and not from burning vegetal biomass or fossil fuel—natural gas in this case. The worst performance was obtained by systems #12 gas heater with 16,900 tonCO2-eq./yr with considerable lead, followed by systems #1 fireplace from wood (1880
tonCO2-eq./yr), #10 firewood heater (831 tonCO2-eq./yr) and #11 pellet heater (23 tonCO2-eq./yr).
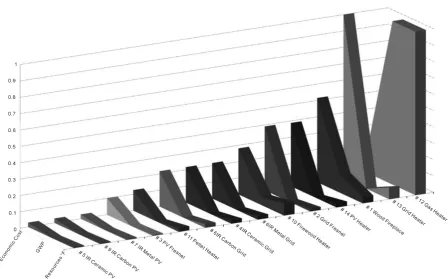
It is interesting to highlight that, according to Table 1, systems #5 infrared ceramic photovoltaic, #9 infrared carbon photovoltaic, and #7 infrared metal photovoltaic have the best performance for all three indicators of sustainability considered in this work, resulting in the first position for them regarding sustainability when com-paring all the fourteen systems evaluated. This is graphically expressed by Figure 6, which shows a normaliza-tion of all indicators provided in Table 1 for all fourteen analyzed systems. In this figure, systems are positioned in a sequence from better to worst general performances, where a larger area means worst overall performance considering all three indicators of sustainability at the same time. System #12 gas heater had the largest area and consequently the worst sustainability performance compared to all other systems. This occurs because, although system #12 has a moderate economic cost (46,300 USD/yr; occupying the ninth position among all systems), it has by far the highest GWP and dependence on non-renewable resources.
It is recognized that a sustainability assessment could include several other indicators under different scales and time approach aiming towards a multi-criteria perspective. However, the conceptual model considered in this work covers important biophysical and economic aspects strongly related to sustainability assessments, mainly for case studies under a very small-scale of attention as those ones evaluated in this work. Changes in the result data treatment from a linear normalization to a pondered scheme could be done to allow other interpreta-tions.
1386
Figure 6. Graphical representation in decreasing sequence of sustainability performance for the fourteen heat generation systems studied. Larger area means lower sustainability according to the evaluation criteria used in this work.
4. Conclusions
Considering the methodological approaches and assumptions made in this work, the following conclusions can be drawn:
1) The evaluated systems #5, #9, and #7, infrared ceramic photovoltaic, infrared carbon photovoltaic, and infrared metal photovoltaic, can be considered the most sustainable among all fourteen heat sources evaluated in this work, because they had the lowest economic cost, 5420 USD/yr, the absence of gas emissions causing glob-al warming potentiglob-al, and they demanded lower amount of non-renewable resources for their implementation and functioning, 1.59E17 seJF/yr;
2) The Fresnel equipment, originally alleged to be the most sustainable one, reached the fourth and tenth posi-tions, for electricity from photovoltaic and grid, systems #3 and #2 respectively, on the established sustainability hierarchy among all heat sources evaluated. Neither the absence of global warming potential nor their compara-tive low demand for non-renewable resources, 1.40 and 4.47 E17 seJF/yr, was able to classify them as the best
systems, because they require high investment and maintenance economic costs, 20,800 and 79,600 USD/yr re-spectively.
Acknowledgements
Authors are grateful for financial support from Vice-President of the Post-Graduate and Research Department of the Paulista University in Brazil and the National Council for Science and Technology (CONACYT) in Mexico. This publication was supported by the fund OP/PROFOCIE-2014-26MSU0015Z-12-01.
References
[1] United Nations Development Programme (UNDP) (2013) Annual Report 2013—Supporting Global Process. UNDP, New York.
1387
[3] Drexhage, J. and Murphy, D. (2010) Sustainable Development: From Brundtland to Rio 2012. In: United Nations Headquarters, 1st Meeting by the High Level Panel on Global Sustainability, United Nations, New York.
[4] Hassan, A.M. and Lee, H. (2015) The Paradox of the Sustainable City: Definitions and Examples. Environment, De-velopment and Sustainability, 17, 1267-1285.http://dx.doi.org/10.1007/s10668-014-9604-z
[5] Nidumolu, R., Prahalad, C.K. and Rangaswami, M.R. (2009) Why Sustainability Is Now the Key Driver of Innovation.
Harvard Business Review, September Issue, 57-64.
[6] Allouhi, A., El Fouih, Y., Kousksou, T., Jamil, A., Zeraouli, Y., and Mourad, Y. (2015) Energy Consumption and Effi-ciency in Buildings: Current Status and Future Trends. Journal of Cleaner Production, in Press, 1-13.
[7] World Energy Council (WEC) (2013) World Energy Insight 2013. WCE, Daegu.
[8] International Renewable Energies Agency (IRENA) (2015) Renewable Energy Capacity Statistics 2015.
http://www.irena.org/DocumentDownloads/Publications/IRENA_RE_Capacity_Statistics_2015.pdf
[9] International Energy Agency (IEA) (2014) World Energy Outlook 2014 Factsheet.
http://www.worldenergyoutlook.org/media/weowebsite/2014/WEO2014FactSheets.pdf
[10] International Renewable Energies Agency (IRENA) (2015) Renewable Energy Prospects: Mexico.
http://www.irena.org/DocumentDownloads/Publications/IRENA_REmap_Mexico_report_2015.pdf
[11] Intergovernmental Panel on Climate Change (IPCC) (2012) Renewable Energy Sources and Climate Change Mitiga-tion. https://www.ipcc.ch/pdf/special-reports/srren/SRREN_FD_SPM_final.pdf
[12] Ismail, Z. (2011) Opportunities for Further Renewable Energy Utilization in Malaysia. International Journal of Energy Science, 1, 144-150.
[13] United Nations Development Programme (UNDP) (2010) Energy Poverty: How to Make Modern Energy Access Uni-versal? OECD/IEA, Paris.
[14] World Alliance for Decentralized Energy (WADE) (2006) World Survey of Decentralized Energy 2006. WADE, Edinburgh.
[15] Griffith, D.A. and Rubera, G. (2014) A Cross-Cultural Investigation of New Product Strategies for Technological and Design Innovations. Journal of International Marketing, 22, 5-20. http://dx.doi.org/10.1509/jim.13.0082
[16] McElroy, M.B. (2010) Energy: Perspectives, Problems, and Prospects. Oxford University Press, Oxford.
[17] Eisenman, M. (2013) Understating Aesthetic Innovation in the Context of Technological Evolution. Academy of Man-agement Review, 38, 332-351. http://dx.doi.org/10.5465/amr.2011.0262
[18] Wirz, M., Petit, J., Haselbacher, A. and Steinfield, A. (2014) Potential Improvements in the Optical and Thermal Effi-ciencies of Parabolic Trough Concentrators. Solar Energy, 107, 398-414.
http://dx.doi.org/10.1016/j.solener.2014.05.002
[19] Zhu, G., Wendelin, T., Wagner, M.J. and Kutscher, C. (2014) History, Current State, and Future of Linear Fresnel Concentrating Solar Collectors. Solar Energy, 103, 639-652. http://dx.doi.org/10.1016/j.solener.2013.05.021
[20] Eales, R. and Sheatey, W. (2011) Effectiveness of Policy Level Environmental and Sustainability Assessment: Chal-lenges and Lessons from Recent Practices. Journal of Environmental Assessment Policy and Management, 13, 39-65.
http://dx.doi.org/10.1142/S146433321100378X
[21] Vasela, V. and Ellenbecker, M. (2001) Indicators of Sustainable Production: Framework and Methodology. Journal of Cleaner Production, 9, 519-549. http://dx.doi.org/10.1016/S0959-6526(01)00010-5
[22] Urbina, A. (2014) Solar Electricity in a Changing Environment: The Case of Spain. Renewable Energy, 68, 264-269.
http://dx.doi.org/10.1016/j.renene.2014.02.005
[23] Haapala, K.R., Zhao, F., Camelio, J., Sutherland, J.W., Skerlos, S.J., Dornfeld, D.A., Jawahir, I.S., Clarens, A.F. and Rickli, J.L. (2013) A Review of Engineering Research in Sustainable Manufacturing. Journal of Manufacturing Sci- ence and Engineering, 135, Article ID: 041013. http://dx.doi.org/10.1115/1.4024040
[24] Odum, H.T. (1996) Environmental Accounting: EMERGY and Environmental Decision Making. Wiley, New York.
[25] Giannetti, B.F., Barrella, F.A. and Almeida, C.M.V.B. (2006) A Combined Tool for Environmental Scientists and De-cision Makers: Ternary Diagrams and Emergy Accounting. Journal of Cleaner Production, 14, 201-210.
http://dx.doi.org/10.1016/j.jclepro.2004.09.002
[26] Woodrow Wilson International Center for Scholars (WWICS) (2012) Solar Energy Potential in Mexico’s Northern Border States. WWICS, Washington DC.
[27] Felin, T. and Zenger, T.R. (2014) Closed or Open Innovation? Problem Solving and the Governance Choice. Research Policy, 43, 914-925. http://dx.doi.org/10.1016/j.respol.2013.09.006
1388
[29] Lanjouw, J.O. and Mody, A. (1996) Innovation and the International Diffusion of Environmentally Responsive Tech-nology. Research Policy, 25, 549-571. http://dx.doi.org/10.1016/0048-7333(95)00853-5
[30] Zhu, X. (2013) Study on Natural Ecological Environment of Interior Design for Gyms. In: Wenjiang, D., Ed., Infor-matics and Management Science V, Springer, London, 567-574. http://dx.doi.org/10.1007/978-1-4471-4796-1_73
[31] Mussard, M. and Nydal, O.J. (2013) Charging of a Heat Storage Coupled with a Low-Cost Small-Scale Solar Parabolic Trough for Cooking Purposes. Solar Energy, 95, 144-154. http://dx.doi.org/10.1016/j.solener.2013.06.013
[32] Solar Energy for Homes (2010) How to Warm up Your Home Using Passive Solar Heating.
http://www.solar-energy-for-homes.com/passive-solar-heating.html
[33] Pulselli, F.M., Coscieme, L. and Bastianoni, S. (2011) Ecosystem Services as a Counterpart of Emergy Flows to Eco-systems. Ecological Modelling, 222, 2924-2928. http://dx.doi.org/10.1016/j.ecolmodel.2011.04.022
[34] Bastianoni, S., Coscieme, L. and Pulselli, F.M. (2014) The Input-State-Output Model and Related Indicators to Inves-tigate the Relationships among Environment, Society and Economy. Ecological Modelling. (in press)
http://www.sciencedirect.com/science/article/pii/S0304380014004840
http://dx.doi.org/10.1016/j.ecolmodel.2014.10.015
[35] Del Pozo, R.P.P., De Melo, C.V. and Rodriguez, E.O. (2014) El análisis emergético como herramienta para evaluar la sustentabilidad en dos sistemas productivos. Ciencias Técnicas Agropecuarias, 23, 59-63.
[36] Izursa, A.J.L. (2011) Emergía (con M), una herramienta nueva para estimar el valor de la madera en el bosque. Eco-logía en Bolivia, 46, 71-76.
[37] Brown, M.T. (1999) Emergy Synthesis: Theory and Applications of the Emergy Methodology.
http://www.cep.ees.ufl.edu/emergy/documents/conferences/ERC01_1999/ERC01_1999_Chapter_01.pdf
[38] Brown, M.T. and Ulgiati, S. (2004) Emergy Analysis and Environmental Accounting. Encyclopedia of Energy, 2, 329- 354. http://dx.doi.org/10.1016/B0-12-176480-X/00242-4
[39] Ulgiati, S., Raugei, M. and Bargigli, S. (2006) Overcoming the Inadequacy of Single-Criterion Approaches to Life Cycle Assessment. Ecological Modelling, 190, 432-442. http://dx.doi.org/10.1016/j.ecolmodel.2005.03.022
[40] United States Environmental Protection Agency (USEPA) (2014) Emission Factors for Greenhouse Gas Inventories.
http://www.epa.gov/climateleadership/documents/emission-factors.pdf
[41] Bastianoni, S., Marchettini, N., Panzieri, M. and Tiezzi, E. (2001) Sustainability Assessment of a Farm in the Chianti Area (Italy). Journal of Cleaner Production, 9, 365-373. http://dx.doi.org/10.1016/S0959-6526(00)00079-2
[42] Brown, M.T. and Buranakarn, V. (2003) Emergy Indices and Ratios for Sustainable Material Cycles and Recycle Op-tions. Resources Conservation & Recycling, 38, 1-22. http://dx.doi.org/10.1016/S0921-3449(02)00093-9
[43] Ulgiati, S. and Brown, M.T. (2002) Quantifying the Environmental Support for Dilution and Abatement of Process Emissions: The Case of Electricity Production. Journal of Cleaner Production, 10, 321-334.
http://dx.doi.org/10.1016/S0959-6526(01)00044-0
[44] Buenfil, A.A. (2001) Emergy Evaluation of Water. PhD Dissertation, University of Florida, Gainesville.
[45] Buranakarn, V. (1998) Evaluation of Recycling and Reuse of Building Materials Using the Emergy Analysis Method. PhD Dissertation, University of Florida, Gainesville.
[46] Haukoos, D.S. (1995) Sustainable Architeture and Its Relationship to Industrialized Building. Master Thesis, Univer-sity of Florida, Gainesville.
[47] Lapp, C.W. (1991) Emergy Analysis of the Nuclear Power System in the United States. A Master’s Paper, University of Florida,Gainesville.
[48] Nelson, M., Odum, H.T., Brown, M.T. and Alling, A. (2001) Living off the Land: Resource Efficiency of Wetland Wastewater Treatment. Advances in Space Research, 27, 1547-1556.
http://dx.doi.org/10.1016/S0273-1177(01)00246-0
1389
Appendix A. Unit Emergy Values (UEV) considered in this work. Source: Own elaboration, adapted from various sources. [24] [41]-[49].
Category and Item Unit seJ/Unit
Materials
Wiring (copper) g 1.14E11
Plastic g 9.86E9
Circuit (copper) g 1.14E11
Electricity J 2.90E5
Reflector frame g 4.65E9
Ceramic far infrared emitter g 5,14E9
Metal far infrared emitter g 4.65E9
Carbon far infrared emitter g 4.65E9
Steel structure g 2.77E9
Pipeline (steel) g 2.77E9
Pipeline (copper) g 1.14E11
Mirror glass g 1.32E10
Aluminum g 2.74E10
Aluminum concentrator g 4.65E9
Blowers g 4.65E9
Clay brick g 3.90E9
Cement g 6.40E7
Steel bars g 2.77E9
Wood pellets g 1.48E9
Wood g 6.79E8
Sauna stones g 1.00E9
Water m3 2.25E11
Natural gas J 1.18E5
Gas tank (steel) g 2.77E9
Energy generation equipment g 1.90E11
Labor
Installation hr 2.14E13
Operation hr 2.14E13
Maintenance hr 2.14E13
Services
Materials cost USD 4.90E12
Installation USD 4.90E12
Operation USD 4.90E12
1390
Appendix B. Raw data for all 14 saunas assessed considering a 20-year lifetime. Source: Own elaboration.
General observations: 1) renewable resources “R” are water, rocks, and wool; all other items were assumed as economic re-sources “F”; none natural non-renewable rere-sources “N” were identified in this study; 2) Services and labor have 2% of par-tial renewability (NEAD for Mexico in 2008); 3) Electricity has 8.8% parpar-tial renewability according to [43]; 4) Electricity from photovoltaic panel has 2% partial renewability according to Paoli et al. (2008); 5) by definition, all other “R” resources have 100% of renewability; 6) all other “F” resources have 0% of partial renewability.
Category and Item Unit Fireplace
(from wood)
Fresnel (grid)
Fresnel (photovoltaic)
Infrared ceramic (grid)
Materials
Wiring (cooper) g - 2.14E1 2.14E1 1.43E2
Plastic g - 2.18E2 2.18E2 2.18E2
Circuit (cooper) g - 5.08E2 5.08E2 5.08E2
Electricity J - 1.46E11 1.46E11 1.30E12
Reflector frame g - - - 4.19E5
Ceramic far infrared emitter g - - - 4.80E5
Metal far infrared emitter g - - - -
Carbon far infrared emitter g - - - -
Steel structure g - 5.00E3 5.00E3 -
Pipeline (steel)
Pipeline (cooper) g - 7.13E3 7.13E3 -
Mirror glass g - 5.00E3 5.00E3 -
Aluminum g - 1.00E2 1.00E2 -
Aluminum concentrator g - 2.50E3 2.50E3 -
Blowers g - 2.00E2 2.00E2 -
Clay brick g 2.10E5 - - -
Cement g 8.65E5 - - -
Steel bars g 1.01E3 - - -
Wood pellets g - - - -
Wood g 1.13E9 - - -
Sauna stones g 1.20E5 1.20E5 1.20E5 -
Water m3 9.12E1 9.12E1 9.12E1 -
Natural gas J - - - -
Gas tank (steel) g - - - -
Energy generat. equipment g - - - -
Labor
Installation hr 8.00E0 3.00E0 3.00E0 2.40E1
Operation hr 1.12E4 1.12E3 1.12E3 5.60E2
Maintenance hr 1.12E4 1.20E2 1.20E2 1.20E2
Services
Materials cost USD 9.05E4 7.61E4 2.00E4 4.37E4
Installation USD 5.12E0 1.92E0 1.92E0 1.54E1
Operation USD 7.16E3 7.17E2 7.17E2 3.58E2
1391
Category and Item Unit Infrared ceramic
(photovoltaic)
Infrared metal (grid)
Infrared metal (photovoltaic)
Infrared carbon (grid)
Materials
Wiring (cooper) g 1.43E2 1.43E2 1.43E2 1.43E2
Plastic g 2.18E2 2.18E2 2.18E2 2.18E2
Circuit (cooper) g 5.08E2 5.08E2 5.08E2 5.08E2
Electricity J 1.30E12 1.30E12 1.30E12 1.30E12
Reflector frame g 4.19E5 4.19E5 4.19E5 4.19E5
Ceramic far infrared emitter g 4.80E5 - - -
Metal far infrared emitter g - 8.00E5 8.00E5 -
Carbon far infrared emitter g - - - 6.00E5
Steel structure g - - - -
Pipeline (steel) g
Pipeline (cooper) g - - - -
Mirror glass g - - - -
Aluminum g - - - -
Aluminum concentrator g - - - -
Blowers g - - - -
Clay brick g - - - -
Cement g - - - -
Steel bars g - - - -
Wood pellets
Wood g - - - -
Sauna stones g - - - -
Water m3 - - - -
Natural gas J - - - -
Gas tank (steel) g - - - -
Energy generat. equipment g - - - -
Labor
Installation hr 2.40E1 2.40E1 2.40E1 2.40E1
Operation hr 5.60E2 5.60E2 5.60E2 5.60E2
Maintenance hr 1.20E2 1.20E2 1.20E2 1.20E2
Services
Materials cost USD 4.97E3 4.37E4 4.37E4 4.37E4
Installation USD 1.54E1 1.54E1 1.54E1 1.54E1
Operation USD 3.58E2 3.58E2 3.58E2 3.58E2
1392
Category and Item Unit Infrared carbon
(photovoltaic)
Heater
(fireplace) Heater (pellets) Heater (gas)
Materials
Wiring (cooper) g 1.43E2 - - -
Plastic g 2.18E2 3.00E4 2.18E2 2.18E2
Circuit (cooper) g 5.08E2 1.14E5 5.08E2 5.08E2
Electricity J 1.30E12 - - -
Reflector frame g 4.19E5 - - -
Ceramic far infrared emitter g - - - -
Metal far infrared emitter g - - - -
Carbon far infrared emitter g 6.00E5 - - -
Steel structure g - 3.00E4 3.00E4 1.30E6
Pipeline (steel) g - 1.14E5 1.14E5 1.14E5
Pipeline (cooper) g - - - 3.76E3
Mirror glass g - - - -
Aluminum g - - - -
Aluminum concentrator g - - - -
Blowers g - - - -
Clay brick g - - - -
Cement g - - - -
Steel bars g - - - -
Wood pellets g - 1.40E7 -
Wood g - 5.08E2 - -
Sauna stones g - 1.20E5 1.20E5 1.20E5
Water m3 - 9.12E1 9.12E1 9.12E1
Natural gas J - - - 2.17E14
Gas tank (steel) g - - - 4.42E6
Energy generat. equipment g - - - -
Labor
Installation hr 2.40E1 3.00E0 3.00E0 3.00E0
Operation hr 5.60E2 1.12E4 1.12E4 2.80E1
Maintenance hr 1.20E2 1.12E4 1.12E4 6.00E0
Services
Materials cost USD 4.97E3 4.30E4 1.13E4 4.63E4
Installation USD 1.54E1 1.92E0 1.92E0 1.92E0
Operation USD 3.58E2 7.17E3 7.17E3 1.79E1
1393
Category and Item Unit Heater (grid) Heater
(photovoltaic) - -
Materials
Wiring (cooper) g 6.42E0 6.42E0 - -
Plastic g 4.35E2 2.18E2 - -
Circuit (cooper) g 1.02E3 5.08E2 - -
Electricity J 3.15E12 3.15E12 - -
Reflector frame g - - - -
Ceramic far infrared emitter g - - - -
Metal far infrared emitter g - - - -
Carbon far infrared emitter g - - - -
Steel structure g 8.27E3 4.14E3
Pipeline (steel) g - - - -
Pipeline (cooper) g - - - -
Mirror glass g - - - -
Aluminum g - - - -
Aluminum concentrator g - - - -
Blowers g - - - -
Clay brick g - - - -
Cement g - - - -
Steel bars g - - - -
Wood pellets g - - - -
Wood g - - - -
Sauna stones g 1.20E5 1.20E5 - -
Water m3 9.12E1 9.12E1 - -
Natural gas J - - - -
Gas tank (steel) g - - - -
Energy generat. equipment g 1.93E4 9.56E3 - -
Labor
Installation hr 3.00E0 3.00E0 - -
Operation hr 5.60E2 5.60E2 - -
Maintenance hr 1.20E2 1.20E2 - -
Services
Materials cost USD 2.03E5 7.85E4 - -
Installation USD 1.92E0 1.92E0 - -
Operation USD 3.58E2 3.58E2 - -
![Figure 1. Heat source classification according to its origin, adapted from [32]. Gray rectangles indicate the alternatives technologies assessed in this study considering their different heat sources](https://thumb-us.123doks.com/thumbv2/123dok_us/8033857.769643/3.595.85.533.448.692/classification-according-rectangles-indicate-alternatives-technologies-considering-different.webp)
![Figure 2. Representation for the input-state-output model of a production system. Adapted from [34]](https://thumb-us.123doks.com/thumbv2/123dok_us/8033857.769643/4.595.232.394.552.618/figure-representation-input-state-output-model-production-adapted.webp)