Munich Personal RePEc Archive
The earnings losses of injured men:
Accounting for injuries outside the
Workers’ Compensation system
Woock, Christopher
December 2007
Online at
https://mpra.ub.uni-muenchen.de/14688/
THE EARNINGS LOSSES OF INJURED MEN: ACCOUNTING FOR INJURIES OUTSIDE THE WORKERS’ COMPENSATION SYSTEM
CHRISTOPHER R. WOOCK* The Conference Board
845 Third Avenue New York, NY 10022 christopher.woock@tcb.org
212-339-0415
* The author would like to thank Jim Ziliak, Aaron Yelowitz, John Garen, Chris Bollinger, Chris Clark, Vera Brencic, Arthur Goldsmith, and seminar participants at the 2005 Southern Economics Association meetings. The data and programs used in this article can be obtained from Christopher Woock, The Conference Board, 845 Third Avenue, New York, NY 10022; or by email:
THE EARNINGS LOSSES OF INJURED MEN: ACCOUNTING FOR INJURIES OUTSIDE
THE WORKERS’ COMPENSATION SYSTEM
ABSTRACT:
Using individual reports of workplace injuries, I estimate the effect of injuries on the labor market
earnings of men. Injured workers suffer large and persistent annual earnings losses, an average of
$2,200 per year following injury. Moreover, data restrictions on previous studies resulted in
earnings losses 1.2 to 3 times larger than those found when all injured workers are compared to
uninjured workers. Largest losses occur when a work limiting disability follows injury, with
average losses from $4,000 to $8,000. The findings suggest a more nuanced picture than previously
I. Introduction
Injuries that arise through the course of employment are an unfortunate side effect of a
productive society. These injuries, along with work limiting disabilities and other health issues,
affect many labor market outcomes. In some regards, the workplace injury is not unlike any
work limiting disability; the individual suffers from some physical limitation that limits his
ability to provide gainful services to an employer. Both the workplace injury and other injuries
and disabilities affect the labor market productivity of the worker, yet workplace injuries are not
necessarily a subset of work limiting disabilities. In the National Longitudinal Survey of Youth
1979 (the dataset used in this paper) only 20% of workers who reported an on-the-job injury
report a health limitation at least once after the injury occurred. In this paper I estimate the
earnings losses for men who suffer a workplace injury, and demonstrate the information lost
when analyses are restricted to Workers’ Compensation claims data. I then extend the analysis
to address whether losses are contingent upon the injury resulting in a work limiting disability.
In 2000 the Bureau of Labor Statistics reported 5,650,000 work related injuries and illnesses,
of which 1,664,000 resulted in days away from work. By comparison, there were 750,000 new
SSDI benefit awards and 818,050 new SSI benefit awards in 2002 (US House of
Representatives, 2004). The occurrence of a workplace injury has been shown to result in
earnings losses between 10% and 25%. However, previous studies addressing the earnings
losses of injured workers have relied on administrative data. As a result, they have been limited
to injured workers who apply for and receive Workers’ Compensation (WC) benefits (ignoring
injured workers who do not apply for WC), and in some cases have chosen a comparison group
from this set of injured workers. Administrative data has also limited previous researchers to
these studies have been unable to identify the separate influences of hours and wages on the
earnings losses.
As explained in Charles (2003), the onset of an injury or disability can result in the loss of
human capital. If the reduction in human capital is significant, but the worker can continue to
work his normal hours, then the losses in annual earnings should show up in a reduction in the
hourly wage. Alternatively, the worker may decide not to work following injury, or to reduce his
hours worked – perhaps switching from fulltime to part-time to accommodate his physical
limitations and/or rehabilitation. If the injured worker chooses rehabilitation, but some aspect of
the injury/disability is permanent, he could invest in "disability capital" – human capital that is
particularly useful when the person is disabled. Because of the multitude of options facing the
injured worker, it is less clear what to expect for his earnings in the later years following the
injury. Through employer accommodations, rehabilitation, and/or investment in disability
capital, the injured worker may be able to “recover” from the injury and see his earnings
converge towards his pre-injury growth path. However, the disability capital could be less
productive, and although the injured worker sees his wage increase following the initial loss he
would be on a flatter earnings profile. Thus, the gap would actually be widening between where
his is, and where he would have been had the injury not occurred.
In this paper I use an unique set of questions from the National Longitudinal Survey of Youth
1979 (NLSY79) which identify an on-the-job injury separately from a self reported work
limiting disability to construct a 13 year profile of the earnings differences between male
workers who suffer an on-the-job injury and similar men who do not suffer an on the job injury.
Two unique features of the NLYS79 allow for an examination of the causes of the earnings
(self-reported) workplace injuries, not just those that result in the receipt of WC benefits. The
omission of those who suffer workplace injuries but do not receive WC benefits is often justified
by suggesting that the “most severe” injuries will receive WC benefits. I find that average
annual losses for all injured workers are about $1,700 the year after injury, and average about
$2,200 in the six years immediately following injury. However, restricting the sample to WC
recipients results in earnings losses 1.5 to 3 times larger than when injured workers who do not
receive WC are included.
In addition, the use of WC administrative data has forced some previous researchers to
choose a comparison group of less severely injured workers to compare the post-injury earnings
of the injured workers. However, the relative meaning of both earnings “losses” and “injured
workers” depends on how these groups are defined. To ask how much earnings an individual
loses as a result of a workplace injury, we need to know how much he would have made had the
injury not occurred. Unfortunately, this missing counterfactual cannot be observed. Instead, the
earnings of the injured worker in the absence of injury must be approximated using the earnings
of a similar individual who does not suffer the injury. The richness of the NLSY79 permits the
construction of a comparison group of uninjured workers. Making this distinction, I find that the
losses for WC recipients relative to uninjured workers is 20%-50% larger than when evaluated
relative to a comparison group of less injured workers.
Finally, the NLSY79 asks about both workplace injuries and work limiting disabilities.
Using the work limiting disability questions I can differentiate between those workplace injuries
that preceded the first report of a disability and those that did not. A priori an individual who
suffers a workplace injury but does not report a work limiting disability should be expected to
report a work-limiting disability suffer significantly larger earnings losses than those who do not
report a work-limiting disability after injury. Average post-injury losses are nearly 6 times larger
for those who report a work limiting disability.
II. Previous Findings
There are two recent papers by Boden and Galizzi (1998, 2003) in which they matched
workers' compensation (WC) claims with unemployment records from Wisconsin to estimate
lost earnings as a result of on-the-job injuries. Looking at Wisconsin workers who receive WC
payments between April 1989 and September 1990 Boden and Galizzi (2003) find that, on
average, injured men lose about $3,500 during the first two quarters following injury. Looking
at a longer term recovery they find that over a 4 year period men who are injured at work lose in
total about $10,500 in earnings. Like Boden and Galizzi (1998, 2003), Biddle (1998) used state
WC claims data from the state of Washington (July 1993 through June 1994), and Reville and
Schoeni (2001)use California administrative data. Both studies find a similar pattern, with
injured workers suffering earnings losses that peak shortly after injury followed by a recovery.
A second group of studies look at the impacts of a disability, regardless of its source,
generally relying on a self reported measure of disability (see Bound and Burkhauser 1999 for a
review). While most studies focused on the contemporaneous impact of disabilities, Charles
(2003) uses the Panel Study of Income Dynamics to examine the earnings profile of an
individual who incurs a work-limiting disability at some point during his work years.
Individuals are grouped based on their responses to whether they “suffered from a physical
impairment that limited the kind or amount of work they could do” (Charles 2003: 622). Fixed
effects methods (similar to those used in this paper) are used to estimate an earnings equation
the individual. Among the results, Charles finds that workers in each of his three work-limiting
disability groups experience a contemporaneous drop in earnings. The workers who only report
a disability once experience a subsequent recovery near pre-report earnings, while workers who
report having a work limiting disability in some years after initial report and in all years after
initial report experience some small recovery followed by persistent earnings losses.
III. Data: The National Longitudinal Survey of Youth 1979
The initial NLSY79 sample consisted of a sample of all American men and women born in
the late 1950's and early 1960's that was nationally representative as of 1979, as well as an
over-sample of black, Hispanic, and economically disadvantaged non-black/non-Hispanic youth. In
constructing the sample used, female respondents as well as individuals who were in the military,
farmers, or self employed at any time between 1987 and 2000 were excluded. Annual earnings
and annual hours used are reported values for the last calendar year (all dollar values used are
adjusted to 2002 dollars using the Current Price Index). In addition, the individuals must have
valid responses (which includes zero) for annual earnings and annual hours, along with valid
responses for industry, occupation, union status, age, marital status, region of residence, tenure
with current employer, and the workplace injury variables. The working sample is 3,564 men, of
which about 27% experience an on-the-job injury at some point during the years 1987-1999.
In this paper, responses to the question "have you had an incident at any job we previously
discussed that resulted in an injury or illness to you?" identify the injured population. From 1988
to 2000 the NLSY79 asked a series of questions about the respondent's most recent on-the-job
injury or illness, including information about what month and year it occurred, what the
respondent was doing, the type of injury, whether (and how many) days of work were missed,
NLSY79 apart from other panel datasets such as the SIPP and PSID as well as many of the cross
sectional datasets. Unlike the NLSY79, most datasets' extent of questions on work related injury
or illness focuses on work-limiting disabilities. Asking a question like "Do you have any
nervous or physical condition that limits the type or amount of work you can do?" (also asked in
the NLSY79), these datasets are not able to separate out on-the-job injuries and illnesses from
injuries and illnesses that occur away from work.
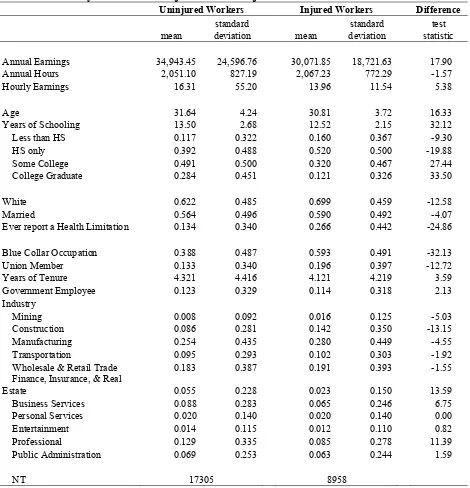
Some important differences arise when comparing the summary statistics of the uninjured
and injured men (Table 1). Most notable is the differences in the types of jobs they hold. Not
too surprising, the uninjured group is more heavily located in the F.I.R.E., business services, and
professional industries, while the injured group is more heavily located in the mining,
construction, and manufacturing industries. A significantly larger proportion of the injured
group can be found in the blue collar occupations and the injured group has a larger fraction
union members. The injured group is also more likely to have a high school diploma or less, is
about one year younger in age, and almost twice as likely to ever report a health limitation. As
for the outcome variable of interest the average annual earnings for the uninjured group is about
$4,900 per year more than the injured group. However, these gaps likely understate the average
differences between the injured and uninjured, as the average earnings for the injured group are
constructed from earnings both before and after the injury.
IV. The Earnings Losses Model
Differences in the summary statistics for the injured and uninjured workers fail to make a
case for causality. As was mentioned before, in addition to the differences in the earnings of the
injured and uninjured groups there are also other differences. It is possible that the gap between
group characteristics. Perhaps the industry and occupational choices cause the earnings gap, and
the injury has little impact on the difference between the two groups. Conversely, it may be that
the impact of the injury is muted by differences between the two groups which affect earnings in
the opposite direction.
An oft used method in the policy analysis literature and program evaluation literature is to
treat the problem as a natural experiment and use a difference-in-differences estimator. In this
experiment, the researcher uses observations from a treatment group (those who receive the
policy or program) and a comparison group (similar individuals who do not receive the policy or
program) at two points in time, once before the treatment group receives the policy or program,
and once after. The researcher constructs the difference in the outcome variable of interest at the
two points in time for each group (possibly controlling for observable characteristics). The
difference between the change over time in the outcome variable for the treatment group and the
control group is interpreted as the impact of the policy or program.
The empirical framework used in this analysis follows closely from the estimation approach
developed by Jacobson, LaLonde, and Sullivan (1993), which “generalizes the
difference-in-differences technique” (pp. 693). As outlined in Jacobson, LaLonde, and Sullivan (1993), there
are several reasons to prefer their method to the simpler difference-in-differences method. Most
important in this paper are that (1) the simpler diff-in-diff methods do not account for earnings
growth that would have occurred in the absence of injury, and (2) the simple diff-in-diff methods
do not provide a longitudinal structure of post-injury earnings, both of which are crucial
elements in evaluating the long term recovery of the injured workers’ earnings. The outcome
measure, yit, depends upon the time relation to the occurrence of injury. Because the year in
identify the time period k relative to the period in which the injury occurred, k = 0. The k
superscript then identifies the number of years since the injury occurred, with k = -6, …,-1
representing the years prior to injury.
A thirteen year interval has been created from the NLSY79 data (k = [-6, 6]). Observations
for injured workers seven or more years after injury are dropped from the sample.1 The time
horizons are not extended longer for two reasons: first, the NLSY79 data will not be drawn from
the survey years 1979-1987 since a majority of the individuals in the sample were in formal
schooling during most of the time period and the on-the-job injury questions were not added
until the 1988 survey year. Second, the sample size of people who had information 7 or more
years prior to report, or 7 or more years after report grew increasingly small and produced vary
large standard errors. Injured workers are not required to have all six years of pre-injury data or
all six years of post-injury data. For example, a worker injured in 1990 would have three years
of pre-injury data (calendar years 1987-1989), while a worker who suffers an injury in 1998
would have all six pre-injury years but only one year of post-injury data.
Controlling for individual specific effects, αi, calendar year effects, γt, observed worker
characteristics, Xitβ, and dynamic returns to education, Eiγt, the model of annual earnings2 is:
it k k k it t i it t i
it X E I
y =α +γ + β+ γ +
∑
η +ε− =
5
5
. (1)
The control vector, Xit, includes age, age squared, region of residence, marital status, tenure,
a union dummy, a blue collar occupation dummy, and a set of major industry dummies. The γt’s
capture the overall time patterns of earnings in the economy through a set of calendar year
dummies and αi captures the impact of time invariant differences between workers. While the
individual specific component, αi, captures time constant characteristics such as education and
inclusion of Eiγt allows for the growth rate of earnings to vary by education levels, netting out
any differences between the injured and uninjured groups over time.3 The mean zero, constant
variance error term in the model is assumed to be uncorrelated across individuals and time.
Because αi is assumed to be correlated with Xit, I estimate the time demeaned version of equation
(1) by ordinary least squares. The focus in this paper is on the ηk’s, which combine to map out
any differences in the earnings (or hours or wages) history of injured workers relative to similar
uninjured workers in the years surrounding the injury.4
This framework is more flexible than those used by Boden and Galizzi (1998, 2003), Biddle
(1998), and Reville and coauthors (Reville 1999, Reville and Schoeni 2001, Reville, Schoeni,
and Martin 2002). Both Boden and Galizzi and Biddle employ a pre-injury trend variable
instead of the series of pre-injury dummy variables in equation (1), and a post injury trend for the
latter periods following injury. For Biddle’s (1998) analysis using quarterly earnings, injury
dummies are included for the quarter of injury and the five quarters immediately following injury
while the post-injury trend variable beings in the fifth quarter after injury. Similarly, Boden and
Galizzi (1998, 2003) include injury dummies for the quarter of injury and the four quarters
immediately following injury, with a post injury trend variable beginning the fourth quarter after
injury.
Reville and coauthors (Reville 1999, Reville and Schoeni 2001, Reville, Schoeni, and Martin
2002) eschew the standard regression approach in favor of matching injured WC claimants to a
group of uninjured workers. While these studies make use of a very flexible form for comparing
pre-injury earnings, the estimated model forces a strict structure on the post-injury earnings
differences. Earnings for injured workers relative to uninjured workers are expected to dip the
uninjured levels in the following periods. In this analysis, the use of a more flexible form
provides a more detailed description of both the pre-injury trends and the post-injury trends.5
The argument for using trend variables generally hinge on longitudinal patterns of the
unconditional averages for the injured and uninjured groups. However, as previously mentioned,
certain differences between the two groups, such as educational attainment, union status, or
occupation/industry sorting can influence the differences between the unconditional means, and
mask the true differences between the injured and uninjured.
V. Homogeneous Treatment of Injured Workers
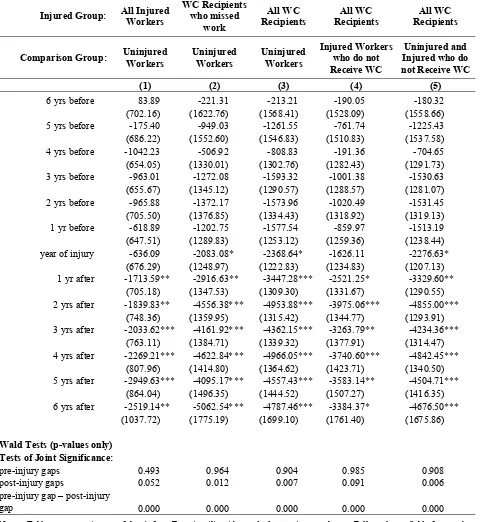
The results from estimating equation (1), with annual earnings as the dependent variable, are
presented in column 1 of Table 2. The differences in the six years prior to injury are neither
individually nor jointly significant, consistent with the injured group looking like the uninjured
group in the years prior to injury. In the years following the injury the injured workers
experience significant losses in annual earnings relative to the uninjured worker.
The first year after injury the injured workers are earning about $1,700 less than the
uninjured. The gaps increase in each of the following years through the fifth year after injury,
where annual earnings losses reach almost $3,000, before a slight recovery to $2,500 less (still
larger than all post injury gaps except the fifth year after injury). While average losses after
injury are around $2,200 per year (about 6% of the average annual income of the uninjured
workers in Table 1), total losses for the first six years after injury exceed $13,000 (over 1/3 of the
average annual income of the uninjured workers).
In any given year the losses could be considered manageable enough to overcome,
accumulated over time they can become a significant loss to the individual. The lack of recovery
the same earnings growth path as the uninjured workers. The downward trend is particularly
troublesome since the sample follows workers in their mid-20’s to mid-30’s up through their
mid-30’s to mid-40’s. This is a period in which substantial wage growth occurs (annual earnings
for uninjured workers in the NLSY79 increases from approximately $30,000 in 1987 to almost
$45,000 in 1999), and for the injured workers the earnings growth has been slowed relative to the
uninjured workers.
The initial losses are much smaller than the approximately $5,000 annualized losses in Boden
and Galizzi (2003) and $8,700 annualized losses in Reville and Schoeni (2001). The 6-year
cumulative losses of $13,000, on the other hand, are closer to the $11,500 cumulative losses
derived from Boden and Galizzi (2003). In contrast the cumulative losses herein are much
smaller than those found by Reville and Schoeni (2001), who use California administrative data
to find 5 year cumulative losses equal to $37,046, and within the lower end of the range of losses
found by Biddle (1998), who uses Washington administrative data and finds 3½ year cumulative
losses between $2,990 and $33,915.
However, the results are at odds with the post-injury trends found in previous studies of
workplace injuries. Boden and Galizzi (2003) find earnings losses of injured male workers who
receive WC payments in the first two quarters following injury followed by a substantial
recovery in the 3rd and 4th quarters after injury, while Biddle (1998) finds losses in the quarter of
injury and the first quarter after injury, but the losses are smaller by the fourth quarter after
injury. Reville and Schoeni (2001), allowing only for a linear trend following the quarter of
injury, find a small, marginally significant positive post injury trend. Here, not only is there no
strong evidence of a recovery, but the difference between the annual earnings of the injured
with previous studies, the increase in the gap between the injured workers and the uninjured
control group suggests that amongst all injured workers there are small but lasting effects of an
on-the-job injury.
VI. Reconciliation with Studies using Administrative Data
The results in column 1 of Table 2 take advantage of the information in the NLSY79 and
includes all reported workplace injuries, regardless of whether the injured workers received WC
benefits. This differs from previous studies, which have used WC administrative data to identify
injured workers, thus excluding anyone who suffers a workplace injury and does not apply for
and receive WC benefits. In addition, the comparison group of uninjured workers used differs
from several previous studies, which have been constrained by their data sources to using a
sample of injured workers that are assumed to have suffered less severe injuries. The inclusion
of injured workers not receiving WC, who are potentially less severely injured, may explain the
smaller losses found in this study, and potentially provide some insights into the lack of recovery
found here. In contrast, using uninjured workers as a comparison group, instead of a group of
“less severe” injured workers, likely results in larger earnings losses.
The next two sections estimate earnings losses for several different injury and comparison
groups to determine the influence of data limitations faced by previous researchers. I find that
restricting the injured group to WC recipients only results in significantly larger losses, while
using an alternate group of injured workers as a comparison group results in smaller losses.
Using the NLSY79 sample, post-injury earnings losses for WC recipients relative to injured
workers who do not receive WC benefits are 1.2 to 2.1 times larger than post-injury losses for all
A. Defining the “Injured Workers”
How one defines the “injured workers” is important. Restricting the sample to those who
receive WC eliminates workplace injuries that do not meet the WC criteria, and a number of
injured workers who meet the WC criteria but choose to not apply. There exists considerable
evidence that the decision to apply for WC is influenced by more than just the severity of the
injury: higher claims rates are positively correlated with more generous benefits (e.g. Krueger
1990, Butler, Gardner, and Gardner 1997, and Ruser, Pergamit, and Krishnamurty 2004), union
representation (Hirsch, Macpherson, and DuMond 1997), employer-provided health insurance
(Lakdawalla, Reville, and Seabury, 2007), past claim-denial rates (Biddle 2001), establishment
characteristics (Biddle and Roberts 2003), and marital status (Fan et al. 2006). Additionally,
using WC administrative data combined with physician assessments of the injured workers,
Biddle and Roberts (2003) conclude that even amongst “workers legitimately injured in the
course of work, all of those who are eligible do not file” (p. 776). If injured workers are not
applying for WC, but are suffering significant losses, then estimates of earnings losses using WC
administrative data may be over-estimating, or under-estimating, the average earnings losses due
to a workplace injury. However, without data on these injured workers who do not apply for
WC, these issues cannot begin to be addressed.
Because their data are drawn from Workers’ Compensation claims, Boden and Galizzi (1998,
2003), Biddle (1998), and Reville and Schoeni (2001) lack information on workers who suffer a
workplace injury but do not apply for WC (32% of injured workers in the NLSY79 sample). As
a result, Boden and Galizzi’s injured workers are only those “who received workers’
compensation permanent partial disability benefits or temporary benefits lasting at least eight
those WC recipients with lost work time; and Reville and Schoeni’s (2001) injured group
contains only those injured workers who file WC claims for a permanent partial disability. The
National Council on Compensation Insurance reports that from 1997 to 1999, 78% of WC claims
are medical-only cases (no cash benefits are paid). Of the remaining 22% of cases,
approximately 2/3 are permanent partial disabilities while nearly 1/3 are temporary disabilities
(about 1% are permanent total disabilities and fatalities) (Williams, Reno, and Burton 2001).
These previous studies, then, have omitted nearly 80% of injured workers who file a WC claim
from their injured groups.
Since the NLSY79 does not include information about the type of benefits paid I cannot
perfectly replicate the injured groups defined in Boden and Galizzi (1998, 2003), Biddle (1998),
or Reville and Schoeni (2001). The NLSY79 does ask about the number of days missed, so I
begin by defining the injured group as injured workers who received WC benefits and missed at
least one day of work due to injury. Equation (1) is estimated using this restricted injury group,
with uninjured workers as the comparison group. Then, Equation (1) is re-estimated with all
other WC recipients included in the injured group. Columns 2 and 3 of Table 2 reveal that when
the sample of injured workers are restricted to those who receive WC benefits, there is little
difference in the post-injury losses between the sample with the lost workdays restriction and the
sample including all WC benefit recipients. Moreover, these small differences (around $250) are
similar both before and after the injury.
While the lost workdays restriction does not significantly alter the earnings losses among
those injured workers who receive WC benefits, the decision to omit those injured men who do
not receive WC results in substantially larger estimated losses. Comparing columns (1) and (3),
that are 1.5 to 3 times as large as the losses obtained when all injured workers are included. Due
to the varying influences on the decision to apply mentioned earlier it was not clear, a priori,
whether adding these injured workers who did not receive WC benefits would result in smaller,
or larger, estimates. The results in columns 1-3 of Table 2, however, show that these injured
workers suffer substantially smaller earnings losses (a result confirmed by repeating the analysis
only on this subset of injured workers), suggesting that they are a less severely injured group.
B. Defining the Comparison Group
Because the bulk of their individual characteristics are obtained through WC administrative
data, the sample is limited to workers who file a claim. As a result, Boden and Galizzi (1998,
2003) construct a comparison group from those workers who miss 8-10 days then return to work,
do not suffer a subsequent injury, and do not receive any permanent disability payments.
Similarly, Biddle (1998) uses WC recipients who file medical claims only as a comparison
group. While their comparison groups may likely resemble a group of uninjured workers at the
time of injury and immediately following, there is less assurance that they continue to resemble
an uninjured worker in the years following injury. Previous studies have shown that an initial
return to work does not necessarily denote the end of the effects of the injury. Both Butler,
Baldwin, and Johnson (2006) and Butler, Johnson, and Baldwin (1995) find significant numbers
of injured workers who are in and out of work at various spell lengths following injury.
Although these two studies look at permanent partial injuries, it should raise caution about using
any “less injured” group who returns to work as a baseline to measure the losses of a more severe
injured group against.6
The choice of a comparison group for both Boden and Galizzi (1998, 2003) and Biddle
of data on uninjured workers… does not provide information about gender (as well as age,
occupation, and tenure)” (pp. 731). As a result of the lack of information, Boden and Galizzi
(1998, 2003) and Biddle (1998) chose both their comparison group and their injured group from
a pool of WC recipients. Boden and Galizzi (2003) argue in favor of using WC recipients who
miss 8-10 days then return to work as a comparison group because, “workers with short-term
injuries are more like other injured workers on both observed and unobserved characteristics
than are uninjured workers” (pp. 731). Certainly injured workers do not look identical to
uninjured workers (see Table 1). However, the central question in this analysis is how much
earnings an individual loses as a result of a workplace injury. In order to answer this we need to
know how much he would have made had the injury not occurred. Because this missing
counterfactual cannot be observed, the earnings of the injured worker in the absence of injury is
best approximated using the earnings of a similar individual who does not suffer the injury.
Since workplace injuries are already a rare event, and the NLSY79 was not designed
specifically with this question in mind, creating an exact duplication of either Boden and
Galizzi’s (1998, 2003) or Biddle’s (1998) comparison groups would result in a prohibitively
small sample of comparison workers. Therefore, in order to maintain tractability I consider three
different comparison groups: (i) uninjured men, (ii) injured men who do not receive WC
benefits, and (iii) both uninjured men and injured men who do not receive WC benefits.
The results in columns 3-5 of Table 2 reveal the importance of choosing the appropriate
comparison group. When the comparison group is comprised of “less severe” injured workers
(column 4), we see the recovery pattern present in previous studies using WC administrative
data. However, this recovery disappears when the comparison group is comprised of uninjured
nearly 80% of the comparison group is uninjured). Moreover, using uninjured workers as a
comparison group instead of the “less severe” injured group results in post-injury losses that are
between 1.2 and 1.5 times larger.
C. Net Results of Mirroring Administrative Data
Comparing the earnings losses for the various choices of injured and comparison groups
within the NLSY79 reveals that constraining the injured group to WC recipients results in
estimates that are substantially larger than those found using all injured. In addition, creating a
comparison group from a sample of (less severe) injured workers results in underestimating the
earnings losses if the desired counterfactual is their earnings in the absence of injury. The
implications for the previous studies by Boden and Galizzi (1998, 2003) and Biddle (1998) are
unclear. Their limitations brought about by their use of WC administrative data result in both
biases being present, and determining which dominates is an empirical question. On the other
hand, the earnings losses found in Reville and Schoeni (2001) are likely an upper bound on the
actual losses.
In addition comparing columns 1 and 3 of Table 2, or columns 3 and 4 of Table 2, reveals
that within the NLSY79 the “drop and recovery” pattern found in previous studies is the result of
comparing two groups of injured workers. It appears that the “more severe” injured workers are
able to close some of the gap between their earnings and the earnings of the “less severe” injured
workers. However, there are no signs of closing the post-injury earnings gap between the injured
workers and the uninjured workers. This casts a more discouraging outlook for injured workers,
VII. Differentiating Injured Workers by Work Limiting Disability Reports
The previous analyses treat all injured workers as a single group. It is likely, though, that
injuries vary in severity and not all people have the same responses to an injury. Arguably,
workplace injuries that are more severe could be expected to result in a work limiting disability,
which previous studies have shown to negatively impact earnings. An alternative method for
disentangling the earnings losses of injured workers is to account for their disability status.
In this section I split the injured workers into two groups: (1) those who report a work
limiting disability following the workplace injury, and (2) injured workers who do not report a
work limiting disability after the injury. In theory one would expect more severe or permanent
injuries to result in a work limiting disability. Prior to injury, these workers should look similar
to the injured workers who never report a work limiting disability and to the uninjured workers.
Following injury, injured workers who subsequently report a work limiting disability should
have (possibly larger) more persistent earnings losses relative to the injured workers who do not
report a work limiting disability. On the surface, we should expect injured workers who do not
report a work limiting disability to experience, at worst, a temporary earnings loss followed by a
quick and complete earnings recovery. However, larger losses may be possible if the worker, as
a result of the injury, finds a new, lower paying job that accommodates his disability. In this
case, although a disability is present, the individual may not report it since it does not limit him
in his current job.
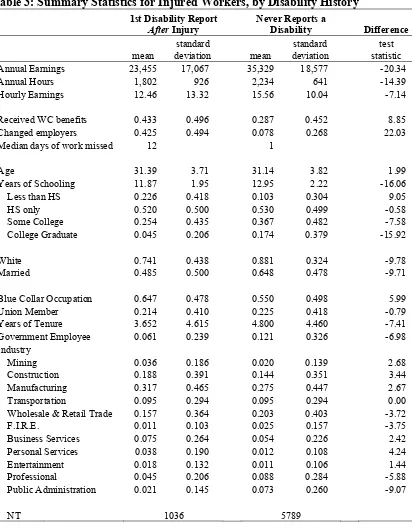
The summary statistics in Table 3 highlight the differences between the injured workers with
work limiting disabilities and those without. Those injured workers who first report of a
disability following injury earn significantly less, about 2/3, than the injured men who never
significantly lower than the injured workers who do not report a work limiting disability
following the injury. These men who report a work limiting disability are more likely to receive
WC benefits, report leaving their employer as a result of injury, and report missing more
workdays as a result of injury. Those who suffer a workplace injury and then report a work
limiting disability appear to suffer more severe injuries. Finally, the injured men who first report
a work limiting disability after the injury are less educated, more likely to be working in a blue
collar job, and have fewer years of tenure.
To account for the differences amongst the disability histories, each injury dummy variable
Ikit in equation (1) is interacted with the characteristics of interest:
it jk j k
k it j t
i it i
it t X E Z I
y =α +γ + β+ γ +
∑ ∑
ϕ +ε− =
6
6
ln (2)
with the Zj characteristics denoting the three mutually exclusive disability histories: (j=1) those
who report a work limiting disability after injury, and (j=2) those who never report a work
limiting disability.
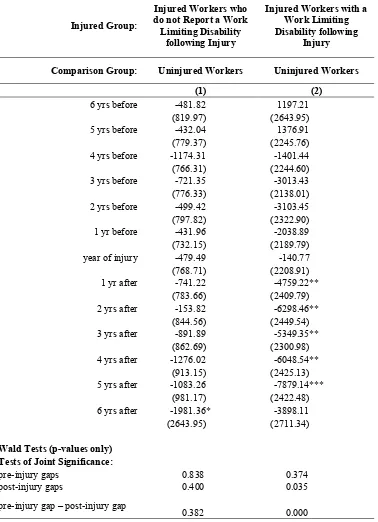
The annual earnings results from estimating equation 2 reveals that once disability is
accounted for, the injury has little impact on the worker (Table 4). For those injured workers
who do not subsequently report a work limiting disability (column 1 of Table 4), post injury
losses are small ($150-$2000) and neither individually nor jointly significant. In contrast, the
year after injury those who first report a disability following injury (column 2 of Table 4) are
earning almost $5,000 less than the uninjured men. This gap increases to over $6,000 the second
year after injury. In the following years the earnings gap fluctuates around the post-injury
average loss of $5700, but shows no signs of a persistent trend upwards or downwards. This is
for the injured men who first report a work limiting disability after the injury is over $34,000;
nearly the average annual earnings of the uninjured men.
VII. Conclusions
In this paper I have revisited the earnings losses as a result of a workplace injury. I have
expanded upon previous work by including injured workers who did not receive WC benefits
and using a comparison group of uninjured workers. After treating all injured workers
collectively, I show that choice of a comparison group and choice of an injured group is
important. Previous studies using workers’ compensation administrative data have omitted a
substantial number of workplace injuries. These omissions result in estimated annual earnings
losses ranging from 1.2 to 3 times larger than the losses for all injured workers relative to a
comparison group of uninjured workers.
A heterogeneous treatment of the injured men reveals that different subgroups of the injured
sample experience different earnings losses. Restricting the sample to WC recipients I found
annual earnings losses ranging from $3,400 to $5,000 following injury. While these losses are
substantially larger than those found for all injured men, differentiating along the presence of a
work limiting disability results in a larger gap. The injured men who first report a work limiting
disability after the injury suffer the largest losses, between $5,000 and $8,000 per year, while
those injured men who never report a work limiting disability do not suffer significant losses.
This is consistent with an important distinction: it is not the injury “event,” but rather the work
Endnotes
1
As noted in footnote 16 in Jacobson, LaLonde, and Sullivan (1993), in order to identify the years relative to injury parameters some injured workers must be observed outside of the injury window. As a result, injured workers 7 or more years before injury are included but treated as uninjured.
2
Annual earnings, in levels, are used here to be consistent with previous studies of workplace injuries that used WC administrative data. Using log(earnings), as Charles (2003) did, results in similar longitudinal patterns.
3
This period, 1987-1999, saw a polarization of wage growth within the US, as earnings for the more educated increases at faster rates than earnings for the less educated (Autor, Katz, and Kearney 2006). Because injured workers are less educated than uninjured workers (see Table 1), the increasing wage growth gap due to education levels could artificially create an “earnings loss” for injured workers. The inclusion of education interacted with time dummies effectively nets out the role of education in the longitudinal patterns of relative earnings.
4
This model also raises concerns about selection bias. Following Wooldridge (2002), I extend the Heckman (1976) selection correction to the panel data setting. The selection correction does not significantly alter the results.
5
In results not presented here, I estimate specifications similar to Boden and Galizzi 1998, 2003), Biddle (1998), or Reville and Schoeni (2001). While the magnitudes of the losses are sensitive to the exact specification, the overall patterns do not change. 6
The central focus of Boden and Galizzi (2003) was on the differences in recovery for injured men and injured women. Their choice of a comparison group should not significantly influence their findings that both men and women suffer similar initial losses, but women experience greater long term losses.
7
References
Autor, David, Lawrence Katz, and Melissa Kearney. 2006. “The Polarization of the U.S. Labor
Market,” American Economics Review Papers and Proceedings 96(May): 189-194.
Biddle, Jeff. 1998. “Estimation and Analysis of Long Term Wage Losses and Wage
Replacement Rates of Washington State Workers’ Compensation Claimants,” working paper.
_____. 2001. “Do High Claim-Denial Rates Discourage Claiming? Evidence from Workers
Compensation Insurance,” Journal of Risk and Insurance 68(December): 631-658.
_____, and Karen Roberts. 2003. “Claiming Behavior in Workers’ Compensation,” Journal of
Risk and Insurance 70(December): 759-780.
Boden, Leslie I. and Monica Galizzi. 1998. Measuring Income Losses of Injured Workers: a
Study of the Wisconsin System. Cambridge MA: Workers Compensation Research.
_____. 2003. "Income Losses of Women and Men Injured at Work." Journal of Human
Resources 38(Summer): 722-757.
Bound, John and Richard V. Burkhauser. 1999. "Economic Analysis of Transfer Programs
Targeted on People with Disabilities." In O. Ashenfelter and D. Card, eds., Handbook of
Labor Economics 3, 1999.
Butler, Richard J., Marjorie L. Baldwin, and William G. Johnson, 2006. “The Effects of
Occupational Injuries After Returns to Work: Work Absences and Losses of On-The-Job
Productivity,” The Journal of Risk and Insurance 73(June): 309-334.
_____, William G. Johnson, and Marjorie L. Baldwin, 1995. “Managing Work Disability: Why
First Return to Work is Not a Measure of Success,” Industrial and Labor Relations Review
____, B. Delworth Gardner, and Harold H. Gardner. 1997. “Workers' Compensation Costs When
Maximum Benefits Change." Journal of Risk and Uncertainty 15(December): 259-269.
Charles, Kerwin Kofi. 2003. "The Longitudinal Structure of Earnings Losses among
Work-Limited Disabled Workers." Journal of Human Resources 38 (Summer): 618-646.
Fan, Z. Joyce, David K. Bounauto, Michael P. Foley, and Barbara A. Silverstein. 2006.
“Underreporting of Work-Related Injury or Illness to Workers’ Compensation: Individual
and Industry Factors,” Journal of Occupational and Environmental Medicine 48(September):
914-922.
Heckman, James J. 1976. “The Common Structure of Statistical Models of Truncation, Sample
Selection, and Limited Dependent Variables and a Simple Estimator of Such Models,”
Annals of Economic and Social Measurements 5: 475-492.
Hirsch, Barry T., David A. Macpherson, and J. Michael DuMond. 1997. “Workers’
Compensation Recipiency in Union and Nonunion Workplaces,” Industrial and Labor
Relations Review 50(January): 213-236.
Jacobson, Louis S., Robert J. LaLonde, and Daniel G. Sullivan. 1993. "Earnings Losses of
Displaced Workers." American Economic Review 83 (September): 685-709.
Krueger, Alan B. 1990. "Incentive Effects of Workers' Compensation Insurance." Journal of
Public Economics 41(February): 73-99.
Lakdawalla, Darius N., Robert T. Reville, and Seth A. Seabury. 2007. “How Does Health
Insurance Affect Workers’ Compensation Filing?” Economic Inquiry 45 (April): 286-303.
Reville, Robert T. 1999. “The Impact of a Disabling Workplace Injury on Earnings and Labor
Force Participation,” in J.C. Haltiwanger et al., eds., The Creation and Analysis of
_____ and Robert F. Schoeni. 2001. “Disability from Injuries at Work: The Effects on Earnings
and Employment,” RAND Labor and Population Program Working Paper Series, DRU-2554.
_____, Robert F. Schoeni, and Craig W. Martin, 2002. Trend in Earnings Losses from Disabling
Workplace Injuries in California: The Role of Economic Conditions, Santa Monica CA:
RAND Institute for Civil Justice.
Ruser, John W., Michael R. Pergamit, and Parvati Krishnamurty. 2004. "Workers' Compensation
'Reforms' and Benefit Claiming," Working Paper: U.S. Bureau of Economic Analysis,
Washington DC, April 2004.
U.S. House of Representatives, Committee on Ways and Means, 2004. 2004 Green Book, U.S.
Government Printing Office Online via GPO Access.
Wooldridge, Jeffrey M., 2002. Econometric Analysis of Cross Section and Panel Data,
Table 1: Summary Statistics for Injured and Uninjured Workers
Uninjured Workers Injured Workers Difference
mean
standard
deviation mean
standard deviation
test statistic
Annual Earnings 34,943.45 24,596.76 30,071.85 18,721.63 17.90
Annual Hours 2,051.10 827.19 2,067.23 772.29 -1.57
Hourly Earnings 16.31 55.20 13.96 11.54 5.38
Age 31.64 4.24 30.81 3.72 16.33
Years of Schooling 13.50 2.68 12.52 2.15 32.12
Less than HS 0.117 0.322 0.160 0.367 -9.30
HS only 0.392 0.488 0.520 0.500 -19.88
Some College 0.491 0.500 0.320 0.467 27.44
College Graduate 0.284 0.451 0.121 0.326 33.50
White 0.622 0.485 0.699 0.459 -12.58
Married 0.564 0.496 0.590 0.492 -4.07
Ever report a Health Limitation 0.134 0.340 0.266 0.442 -24.86
Blue Collar Occupation 0.388 0.487 0.593 0.491 -32.13
Union Member 0.133 0.340 0.196 0.397 -12.72
Years of Tenure 4.321 4.416 4.121 4.219 3.59
Government Employee 0.123 0.329 0.114 0.318 2.13
Industry
Mining 0.008 0.092 0.016 0.125 -5.03
Construction 0.086 0.281 0.142 0.350 -13.15
Manufacturing 0.254 0.435 0.280 0.449 -4.55
Transportation 0.095 0.293 0.102 0.303 -1.92
Wholesale & Retail Trade 0.183 0.387 0.191 0.393 -1.55 Finance, Insurance, & Real
Estate 0.055 0.228 0.023 0.150 13.59
Business Services 0.088 0.283 0.065 0.246 6.75
Personal Services 0.020 0.140 0.020 0.140 0.00
Entertainment 0.014 0.115 0.012 0.110 0.82
Professional 0.129 0.335 0.085 0.278 11.39
Public Administration 0.069 0.253 0.063 0.244 1.59
Table 2: Earnings Losses by Select Injured and Comparison Groups
Injured Group: All Injured Workers WC Recipients who missed work All WC Recipients All WC Recipients All WC Recipients
Comparison Group: Uninjured Workers Uninjured Workers Uninjured Workers Injured Workers who do not Receive WC
Uninjured and Injured who do not Receive WC
(1) (2) (3) (4) (5)
6 yrs before 83.89 -221.31 -213.21 -190.05 -180.32 (702.16) (1622.76) (1568.41) (1528.09) (1558.66) 5 yrs before -175.40 -949.03 -1261.55 -761.74 -1225.43
(686.22) (1552.60) (1546.83) (1510.83) (1537.58) 4 yrs before -1042.23 -506.92 -808.83 -191.36 -704.65
(654.05) (1330.01) (1302.76) (1282.43) (1291.73) 3 yrs before -963.01 -1272.08 -1593.32 -1001.38 -1530.63
(655.67) (1345.12) (1290.57) (1288.57) (1281.07) 2 yrs before -965.88 -1372.17 -1573.96 -1020.49 -1531.45
(705.50) (1376.85) (1334.43) (1318.92) (1319.13) 1 yr before -618.89 -1202.75 -1577.54 -859.97 -1513.19
(647.51) (1289.83) (1253.12) (1259.36) (1238.44) year of injury -636.09 -2083.08* -2368.64* -1626.11 -2276.63*
(676.29) (1248.97) (1222.83) (1234.83) (1207.13) 1 yr after -1713.59** -2916.63** -3447.28*** -2521.25* -3329.60**
(705.18) (1347.53) (1309.30) (1331.67) (1290.55) 2 yrs after -1839.83** -4556.38*** -4953.88*** -3975.06*** -4855.00***
(748.36) (1359.95) (1315.42) (1344.77) (1293.91) 3 yrs after -2033.62*** -4161.92*** -4362.15*** -3263.79** -4234.36***
(763.11) (1384.71) (1339.32) (1377.91) (1314.47) 4 yrs after -2269.21*** -4622.84*** -4966.05*** -3740.60*** -4842.45***
(807.96) (1414.80) (1364.62) (1423.71) (1340.50) 5 yrs after -2949.63*** -4095.17*** -4557.43*** -3583.14** -4504.71***
(864.04) (1496.35) (1444.52) (1507.27) (1416.35) 6 yrs after -2519.14** -5062.54*** -4787.46*** -3384.37* -4676.50***
(1037.72) (1775.19) (1699.10) (1761.40) (1675.86)
Wald Tests (p-values only) Tests of Joint Significance:
pre-injury gaps 0.493 0.964 0.904 0.985 0.908
post-injury gaps 0.052 0.012 0.007 0.091 0.006
pre-injury gap – post-injury
gap 0.000 0.000 0.000 0.000 0.000
Notes: Table presents estimates of the η's from Equation (1), with standard errors in parentheses. Full results available from author upon request.
Table 3: Summary Statistics for Injured Workers, by Disability History
1st Disability Report
After Injury
Never Reports a Disability Difference mean standard
deviation mean
standard
deviation test statistic Annual Earnings 23,455 17,067 35,329 18,577 -20.34
Annual Hours 1,802 926 2,234 641 -14.39
Hourly Earnings 12.46 13.32 15.56 10.04 -7.14
Received WC benefits 0.433 0.496 0.287 0.452 8.85
Changed employers 0.425 0.494 0.078 0.268 22.03
Median days of work missed 12 1
Age 31.39 3.71 31.14 3.82 1.99
Years of Schooling 11.87 1.95 12.95 2.22 -16.06
Less than HS 0.226 0.418 0.103 0.304 9.05
HS only 0.520 0.500 0.530 0.499 -0.58
Some College 0.254 0.435 0.367 0.482 -7.58
College Graduate 0.045 0.206 0.174 0.379 -15.92
White 0.741 0.438 0.881 0.324 -9.78
Married 0.485 0.500 0.648 0.478 -9.71
Blue Collar Occupation 0.647 0.478 0.550 0.498 5.99
Union Member 0.214 0.410 0.225 0.418 -0.79
Years of Tenure 3.652 4.615 4.800 4.460 -7.41
Government Employee 0.061 0.239 0.121 0.326 -6.98 Industry
Mining 0.036 0.186 0.020 0.139 2.68
Construction 0.188 0.391 0.144 0.351 3.44
Manufacturing 0.317 0.465 0.275 0.447 2.67
Transportation 0.095 0.294 0.095 0.294 0.00
Wholesale & Retail Trade 0.157 0.364 0.203 0.403 -3.72
F.I.R.E. 0.011 0.103 0.025 0.157 -3.75
Business Services 0.075 0.264 0.054 0.226 2.42 Personal Services 0.038 0.190 0.012 0.108 4.24
Entertainment 0.018 0.132 0.011 0.106 1.44
Professional 0.045 0.206 0.088 0.284 -5.88
Public Administration 0.021 0.145 0.073 0.260 -9.07
Table 4: Earnings Losses by Disability History
Injured Group:
Injured Workers who do not Report a Work Limiting Disability
following Injury
Injured Workers with a Work Limiting Disability following
Injury
Comparison Group: Uninjured Workers Uninjured Workers
(1) (2)
6 yrs before -481.82 1197.21
(819.97) (2643.95)
5 yrs before -432.04 1376.91
(779.37) (2245.76)
4 yrs before -1174.31 -1401.44
(766.31) (2244.60)
3 yrs before -721.35 -3013.43
(776.33) (2138.01)
2 yrs before -499.42 -3103.45
(797.82) (2322.90)
1 yr before -431.96 -2038.89
(732.15) (2189.79)
year of injury -479.49 -140.77
(768.71) (2208.91)
1 yr after -741.22 -4759.22**
(783.66) (2409.79)
2 yrs after -153.82 -6298.46**
(844.56) (2449.54)
3 yrs after -891.89 -5349.35**
(862.69) (2300.98)
4 yrs after -1276.02 -6048.54**
(913.15) (2425.13)
5 yrs after -1083.26 -7879.14***
(981.17) (2422.48)
6 yrs after -1981.36* -3898.11
(2643.95) (2711.34)
Wald Tests (p-values only) Tests of Joint Significance:
pre-injury gaps 0.838 0.374
post-injury gaps 0.400 0.035
pre-injury gap – post-injury gap
0.382 0.000
Notes: Table presents estimates of the φ's from Equation (2), with standard errors in parentheses. Full results available from author upon request.