http://dx.doi.org/10.4236/jsemat.2014.44022
How to cite this paper: Abdel-Samad, A., Soud, Y. and Zaki, M. (2014) Influence of Paint on Steel Corrosion for Marine Ap-plications. Journal of Surface Engineered Materials and Advanced Technology, 4, 189-195.
http://dx.doi.org/10.4236/jsemat.2014.44022
Influence of Paint on Steel Corrosion for
Marine Applications
Abdou Abdel-Samad1*, Yaser Soud1, M. Zaki2
1Department of Production Engineering and Mechanical Design, Faculty of Engineering, Mansoura University,
Mansoura, Egypt
2Department of Production Engineering and Printing Technology, Akhbar El-Yom Academy, 6th of October,
Egypt
Email: *asamad@mans.edu.eg
Received 20 April 2014; revised 15 May 2014; accepted 10 June 2014
Copyright © 2014 by authors and Scientific Research Publishing Inc.
This work is licensed under the Creative Commons Attribution International License (CC BY). http://creativecommons.org/licenses/by/4.0/
Abstract
The majority of naval ships are constructed of mild steel. Corrosion is a major concern in a mari-time environment. This particular type of material degradation has recently received more atten-tion by the marine industry. The present work aims to investigate the effect of recent coatings used in marine ship surfaces for preventing corrosion. Experiments were performed according to standard tests to evaluate and measure the coating adhesion to steel and to measure the corrosion wear rate if any for three types of coatings. An accelerated corrosion test was conducted to dupli-cate in the laboratory the field corrosion performance of a product. The results indidupli-cate that all tested types of paint have resulted in a reduction in the corrosion rate compared with the un-coated steel. A minimum corrosion rate of 0.8 mm/year for the coat “Hempadur 52,140” was ob-tained compared to 2.1 mm/year for the uncoated steel. A microscopic examination of the cor-roded steel surfaces was conducted which prevailed pitting behavior with different degree. The minimum corroded surface exhibited few pitting attack in comparison to other specimens. Al-though the pitting attack of the surface layer (paint), one can drive a conclusion that sample sur-face without coating is aggressively attacked by pits.
Keywords
Corrosion, Marine Paint, Adhesion, Salt Spray Test, DC Electrochemical Polarization Test
1. Introduction
Marine atmosphere with its high level of salinity and humidity is very corrosive, and the effects of corrosion are
allegedly responsible for 30% of failures on ships and other marine equipment. It has been estimated that the to-tal cost of marine corrosion worldwide is between $50 - 80 billion every year [1]. The coating industry is almost 40% of the total direct costs, and the largest portion of this cost (88%) is attributed to organic coatings [2].
The corrosion rate in an open natural system is controlled by the diffusion rate of oxygen from the bulk solu-tion to the steel surface and the composisolu-tion of the carbon steel that is being attacked has no effect on rates [3]. The level of dissolved salts of the exposure environment had an effect on the properties of coatings, initially the corrosion rates are higher and are at least 2.5 times the subsequent steady state rate that begins earlier than one month following exposure according to some studies [4].
Accidents involving ships that carry environmentally dangerous cargo, such as oil tankers, can have severe consequences for the environment. In many accidents, the ship structure had been weakened by corrosion [5]-[7]. Maritime safety and the prevention of accidents require a sound ship structure. As such, the prevention of corro-sion is a key priority for safe shipping. Today’s coating systems work well and have a sufficient lifetime when they are applied according to the coating producer’s specifications [8]-[10].
There are organic and metallic protective coatings, other common methods for preventing and controlling corrosion include: corrosion-resistant alloys, plastics and polymers; corrosion inhibitors; and cathodic protection. Coatings used for maintenance purposes on vessels will account for 65%, and 20% for offshore drilling and platforms [11]. The effects of corrosion are expensive costs to vessel, structural and equipment operations, com- pounded by the financial penalties on breakdowns, outages, and repairs. These problems have challenged the industry for years, but it needs to remain proactive in preventing in controlling marine corrosion. The many types of marine corrosion, their possible interaction, and the need to review the entire system when considering changes highlight the importance of tackling the problem through design, selection of materials, construction, use and maintenance. Sharing knowledge of research findings and the expertise of those developing modern en-gineering systems are vital to controlling the damaging effects of the marine environment [12] [13].
Paints used in marine environments are usually constituted by a polymeric resin (typically epoxy, alkyd or polyurethane), organic solvents and wide variety of organic and inorganic additives (as pigments, biocide, fillers, etc.) [14]-[17]. Active anticorrosive pigments like metallic chromates passivate metal surface by covering it with an oxide film. However, these agents are preferably kept out of the environment due to the toxicity of heavy metals.
On the other hand, metals like zinc, which are usually employed as anticorrosive additive in epoxy paints, prevent discharge of current from substratum (naval steel) to electrolyte by electrochemical attachment of a less passive anode, i.e. it covers the paint into a sacrificial coating. In recent years a new generation of paints that employ water as solvent has emerged. However, their anticorrosive performance is poor with respect to that of the organic-based paints they intend to replace. This is a critical problem for the shipbuilding industry, which requires high specifications due to the aggressive marine environment. In spite of this, promising results have been reported for different ecological water-based paints that incorporate zinc phosphates as non-contaminant anticorrosive additive. Thus, the entry of water through the coating produces a zinc film that passivates the me-tallic substratum. However, once the anticorrosive additive has been exhausted, there is a complete loss of the protective properties of the paint because of its high porosity making difficult the practical use of this type of paints in aggressive environments. Regarding to the barrier protection, this consists in protecting the metal sur-face blocking the passage of oxygen and water. Usually, the protection by barrier effect provided by a coating is evaluated using immersion assays, in which both the volume of water and oxygen that enters into the system and the rate of penetration are measured [18] [19]. The structure of the polymers is essential to decide the extent of permeation through it. Indeed, the relationship between structure of polymers and their permeability has been successfully exploited in applications like membranes and packaging. However, in coating applications the presence of pigments and additives can alter the porosity and adherence of the films modifying their protective action. For instance, pigments reduce the porosity of the coatings; the smaller the pigment particles, the lower the porosity.
2. Experimental Procedure
2.1. MaterialsTable 1. Tested paint types
Coat No. Name Description
1 HEMPADUR MASTIC 45880 Two-component polyamide adduct cured, high solids, high build epoxy paint.
2 HEMPALIN ENAML 52140 Glossy alkyd
3 HEMPATHANE TOPCOAT 55210 Two-component glossy acrylic polyurethane
Table 2. Chemical composition of the steel substrate (wt %).
Element C Si S P Mn Ni Cr Al Cu
wt % 0.06 0.01 0.010 0.015 0.49 0.016 0.009 0.049 0.02
2.2. Experimental Tests 2.2.1. Adhesion Test
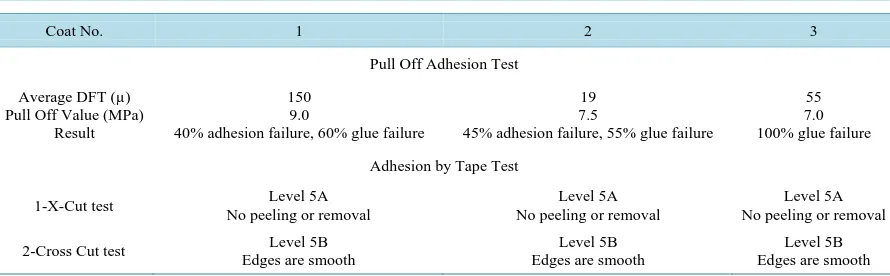
Adhesion Pull-Off and Tape (X-Cut test + Cross Cut test) tests were measured according to ASTM D 4541 and ASTM D 3359 standard tests respectively (ISO 4624 and ISO 2409 tests). The results of the adhesion test are il-lustrated in Table 3.
2.2.2. Salt Spray Test
To evaluate surface layer for the three different painted samples, unpainted sample as reference Gravimetric test and Visual and optical inspection were done. Atmospheric marine test (ASTM B287-62) is used (Figure 1), where chloride atmosphere attack the samples. Chloride atmosphere mainly comes from the reaction between acetic acid and Sodium chloride with different concentration (as standard), at 40˚C and aeration. Duration of the test is about 54 hours; each 2 hrs a weight change (ΔW) was estimated. Finally, the change in the weight was plotted versus time. Visual inspection and optical microscopy was done to investigate the surface layer attack and the formed corrosion product. As well as, pitting initiation and propagation was inspected.
2.2.3. DC Electrochemical Polarization Tests
All tests were carried out using Autolab Potentiostat/Galvanostat (PGSTAT 30) specified for electrochemical measurements Figure 2. A conventional three-electrode cell, (a single compartment-glass cell of 250 ml capaci-ty was used with stainless steel as counter electrode). The working electrodes were the coated specimens with an exposed area of 0.785 cm2. All potentials were measured with respect to saturated calomel electrode (SCE). The electrolyte consisted of 3.5% NaCl solution made up from distilled water and reagent grade NaCl (Fisher scien-tific). Experiments were carried out at room temperature. Linear polarization technique was carried out by sub-jecting the working electrode to a potential range of 20 mV below and above corrosion potential (Ecorr) at a scan rate of 0.0125 mV/sec. The current within this range varied linearly with applied potential. The polarization resistance, Rp (Ω), was determined from the slope of the plots of the applied potential against the measured cur-rent. The corrosion current Icorr (A) can be calculated using the Stern-Geary relationship:
Icorr=B Rp
where
(
)
2.3
B=β βa⋅ c βa+βc
where, βa and βc are the anodic and cathodic Tafel constants in (v/decade).
By this technique, controlled potential scan (0.5 mv/s) was typically applied to the sample starting at Ecorr and extending in both anodic and cathodic directions for a few hundred millivolts (about ± 250 mv from Ecorr). When the resultant potential-current data were plotted as shown in Figure 3, it characteristically exhibited linear regions on both anodic and cathodic branches. The slope of these linear regions in v/decade of current is known as the Tafel constants βa and βc respectively. The corrosion rate C.R. in mpy (millimeter per year) can then be calculated from Faradays law by:
. 0.13 icorr
Figure 1.Salt spray test cabinet.
Figure 2. Autolab potentiostat/galvanostat.
[image:4.595.91.536.584.722.2]Figure 3. Results of potential-current data.
Table 3. Adhesion test results.
Coat No. 1 2 3
Pull Off Adhesion Test
Average DFT (µ) Pull Off Value (MPa)
Result
150 9.0
40% adhesion failure, 60% glue failure
19 7.5
45% adhesion failure, 55% glue failure
55 7.0 100% glue failure
Adhesion by Tape Test
1-X-Cut test No peeling or removal Level 5A No peeling or removal Level 5A No peeling or removal Level 5A
where, EW and d are the equivalent weight (g) and density (g/cm3) of steel and icorr is the corrosion current density (mA/cm2) that obtained from icorr = Icorr/exposed area.
3. Results and Discussion
The results of the adhesion tests are shown in Table 3.
DC electrochemical polarization test results are shown in Table 4 and the corrosion rate of the samples are shown in Figure 4.
In general coating improves the corrosion resistance of uncoated steel. It is clear that coat number 2 and 3 show much lower corrosion resistance then coat number 1.
The weight change (mg/cm2) of the three samples coated with different types of paint was measured in chlo-ride atmosphere at 40˚C for about 54 hrs. These results are plotted in Figure 5. As seen one can drive a conclu-sion that sample 2 could withstand 54 hours without aggressive attack, the other two samples 1 and 3 show sig-nificant changes in the weight gain. Higher weight gain was obtained for samples 3 and 1 than sample 2. In comparison to the reference sample (without surface coating), lower weight gain was recorded. The values of the corrosion rates in mm/yr after 54 hours from the experiment time is calculated from the relation (Corrosion rate = K W/ρAt) as shown in Table 5. Where W is the weight loss after exposure time t; ρ and A represent the
density and exposed specimen area, respectively, and K is a constant, its magnitude depending on the system of units used (K = 87.6 and W, ρ, A, and t are specified in units of milligrams, grams per cubic centimeter, square inches, and hours, respectively).
[image:5.595.187.412.411.501.2]To support our result, visual inspection as well as optical micrographs was carried out during exposure time. In general, all the samples illustrate pitting behaviour with different degree according to its surface layer, weak-ness and strength. However, micrographs of sample 2 represent few pitting attack in comparison to sample 1 and 3 and also the reference. Although the pitting attack of the surface layer (paint), one can drive a final conclusion that sample surface without coating is aggressively attacked by pits. Larger and wider pits are formed on that surface. In all cases dark brown corrosion product was formed around the pits. Some selected micrographs are shown in Figure 6 for sample 1, 2 and 3 and also for comparison, reference sample (without coating) after 54 hrs.
Figure 4.Corrosion rate of coated and uncoated samples.
Table 4. DC electrochemical polarization test results.
Coat No. 1 2 3 uncoated
I corrosion (A) 1.168E−6 5.861E−7 4.98E−7 3.687E−6
I corrosion (A/cm2) 1.488E−6 7.466E−7 6.345E−7 4.697E−6
Bc (V/dec) 0.163 0.068 0.216 0.05
Ba (V/dec) 0.141 0.113 0.18 0.103
Rp (Ohm) 8.515E+3 5.699E+3 3.397E+4 6.006E+2
E corr, abs (V) −0.554 −0.516 −0.496 −0.699
E corr, calc (V) −0.556 −0.519 −0.502 −0.696
E-begin (V) −0.605 −0.548 −0.558 −0.722
E-end (V) −0.501 −0.475 −0.421 −0.675
Corrosion rate (mm/year) 1.115E−2 5.595E−3 4.754E−3 3.52E−2 0.00 0.50 1.00 1.50 2.00 2.50 3.00 3.50 4.00 Co rr osi on ra te x 10 -2 (mm/ yea r)
[image:5.595.104.496.538.721.2]Figure 5. Salt spray corrosion rates corrosion.
[image:6.595.93.502.80.489.2]
Sample 1 Sample 2 Sample 3 Reference sample
Figure 6.Optical micrographs for salt sprayed surfaces after 54 hours.
Table 5. Salt spray test results.
Sample no. 1 2 3 Blank
Corrosion rate (mm/yr) 1.4 0.8 1.2 2.1
4. Conclusions
From the present experimental study and the obtained results, it can be concluded that:
1) Polymeric coating for steel structure for marine application is essential to reduce salt water corrosion. A corrosion rate reduction of about 77% was realized for coated surfaces compared to uncoated steel surface.
2) Minimum corrosion rate of 0.8 mm/year was exhibited by the coat “HEMPALIN ENAML 52140” over a salt spray test duration of 54 hours.
3) Optical micrographs have shown that oxidation and pitting dominate the corroded surfaces.
References
[1] NACE Int’l Co C Study (2001) Costs of Corrosion Control Methods Include Services, R&D, Education and Training, Implementation of Corrosion Prevention Systems—A Major Expense for the Owner/Operator. National Oceanic and Atmospheric Administration (NOAA), Silver Spring.
[2] Greenfield, D. and Scantlebury, D. (2000) The Protective Action of Organic Coatings on Steel: A Review. Journal of Corrosion Science and Engineering, 3, 5.
[3] Gudzea, M.T. and Melchersb, R.E. (2009) Operational Based Corrosion Analysis in Naval Ships. Journal of Corrosion Science, 50, 3296-3307.
[4] Fang, H.T. (2006) Low Temperature and High Salt Concentration Effects on General CO2 Corrosion for Carbon Steel.
Electronic Thesis or Dissertation, Ohio University. https://etd.ohiolink.edu/
0 20 40 60
-2 0 2 4 6 8 10 12 14
sample 1 sample 2 sample 3 Ref.
W
ei
ght
c
hange w
/A
(
m
g/
c
m
2 )
[5] Shi, W. (1992) In-Service Assessment of Ship Structures: Effects of General Corrosion on Ultimate Strength. Transac-tions of the Royal Institution of Naval Architects, 135, 77-91.
[6] Kima, W.K., Kohb, S.U., Yangb, B.Y. and Kima, K.Y. (2008) Effect of Environmental and Metallurgical Factors on Hydrogen Induced Cracking of HSLA Steels. Progress in Organic Coatings, 50, 3336-3342.
[7] Fredja, N., Cohendoza, S., Feaugasa, X. and Touzain, S. (2008) Effect of Mechanical Stress on Kinetics of Degrada-tion of Marine Coatings. Progress in Organic Coatings, 63, 316-322. http://dx.doi.org/10.1016/j.porgcoat.2008.05.001
[8] See, S.C., Zhanga, Z.Y. and Richardsona, M.O.W. (2009) A Study of Water Absorption Characteristics of a Novel Nano-Gelcoat for Marine Application. Progress in Organic Coatings, 65, 169-174.
http://dx.doi.org/10.1016/j.porgcoat.2008.11.004
[9] Mehtaa, N.K. and Bogere, M.N. (2009) Environmental Studies of Smart/Self-Healing Coating System for Steel. Prog- ress in Organic Coatings, 64, 419-428. http://dx.doi.org/10.1016/j.porgcoat.2008.08.007
[10] Tadros, A.B. and Abd El-Nabey, B.A. (2000) Marine Anti-Corrosion Paints Based on Thiouracil Compounds. Anti- Corrosion Methods and Materials, 47, 211-214. http://dx.doi.org/10.1108/00035590010344303
[11] Oakley, R. and Qineti, Q. (2009) Corrosion Testing in Support of Marine Applications’ Technical Presentations at the April 2009 Meeting, Marine Corrosion Forum (MCF). http://www.marinecorrosionforum.org/tpapr09.htm
[12] Guedes Soares, C., Garbatov, Y., Zayed, A. and Wang, G. (2009) Influence of Environmental Factors on Corrosion of Ship Structures in Marine Atmosphere. Corrosion Science, 51, 2014-2026.
http://dx.doi.org/10.1016/j.corsci.2009.05.028
[13] Abd El Aal, E.E., Abd El Wanees, A., Diab, A. and Abd El Haleem, S.M. (2009) Environmental Factors Affecting the Corrosion Behavior of Reinforcing Steel III. Measurement of Pitting Corrosion Currents of Steel in Ca(OH)2 Solutions
under Natural Corrosion Conditions. Corrosion Science, 51, 1611-1618. http://dx.doi.org/10.1016/j.corsci.2009.04.006
[14] Al-Turaif, H. (2009) Surface Coating Properties of Different Shape and Size Pigment Blends. Progress in Organic Coatings, 65, 322-327. http://dx.doi.org/10.1016/j.porgcoat.2009.01.001
[15] Akbarinezhad, E., Ebrahimi, M. and Faridi, H.R. (2009) Corrosion Inhibition of Steel in Sodium Chloride Solution by Undoped Polyaniline Epoxy Blend Coating. Progress in Organic Coatings, 64, 361-364.
http://dx.doi.org/10.1016/j.porgcoat.2008.07.018
[16] Kalendová, A., Sapurina, I., Stejskal, J. and Veselý, D. (2008) Anticorrosion Properties of Polyaniline-Coated Pig-ments in Organic Coatings. Corrosion Science, 50, 3549-3560. http://dx.doi.org/10.1016/j.corsci.2008.08.044
[17] Bierwagen, G.P. (1992) Critical Pigment Volume Concentration (CPVC) as a Transition Point in the Properties of Coatings. The Journal of Coatings Technology, 64, 71-75.
[18] Skoulikidis, T. and Ragoussis, A. (1992) Diffusion of Iron Ions through Protective Coatings on Steel. Corrosion, 48, 666-670. http://dx.doi.org/10.5006/1.3315987
[19] Deflorian, F. and Rossi, S. (2006) An EIS Study of Ion Diffusion through Organic Coatings. Electrochimica Acta, 51, 1736-1744.
currently publishing more than 200 open access, online, peer-reviewed journals covering a wide range of academic disciplines. SCIRP serves the worldwide academic communities and contributes to the progress and application of science with its publication.