Structural Changes in East Asia: Factor Accumulation,
Technological Progress and Economic Geography
Thesis submitted for the degree of Doctor of
Philosophy (PhD) in the Faculty of Economics
by
Shuvojit Banerjee
Supervisor: Professor Anthony J. Venables
registered at
London School of Economics and Political Science
UMI Number: U198916
All rights reserved
INFORMATION TO ALL USERS
The quality of this reproduction is dependent upon the quality of the copy submitted. In the unlikely event that the author did not send a complete manuscript and there are missing pages, these will be noted. Also, if material had to be removed,
a note will indicate the deletion.
Dissertation Publishing
UMI U198916
Published by ProQuest LLC 2014. Copyright in the Dissertation held by the Author. Microform Edition © ProQuest LLC.
All rights reserved. This work is protected against unauthorized copying under Title 17, United States Code.
ProQuest LLC
789 East Eisenhower Parkway P.O. Box 1346
F
%23b
m
Library
.1 - - ^ i.
-Abstract
This thesis deals with understanding the rapid industrial change in East Asia between the mid 1970s and the mid 1990s. The countries analysed are South Korea, Taiwan, Hong Kong, Singapore, Malaysia, Indonesia, Thailand and China.
Patterns of industrial development are studied across the region in depth. We calculate industrial and regional specialisation indices to obtain an idea of the trends being witnessed. A more formal analysis of the mobility which can be observed is then conducted. Measures of mobility and persistence are obtained for the movement of industries in the region. The nature of industrial growth and decline in the region points to the possible importance of a number of theoretical explanations.
We subsequently analyse whether the patterns of change in industry seen indicate similarity in paths of development across countries. We investigate the industrial structure of pairs of countries in the region over time. We find that there is similarity in the development paths of industry in East Asian countries, with factor endowment considerations not the sole explanators.
We next examine possible theoretical explanations of the industrial change seen. We test for Heckscher-Ohlin and Ricardian effects in a neo-classical frame work. We find discernible patterns and significance in terms of factor endowment effects. Technology is seen to be less important but still plays a considerable part in explaining manufacturing change.
A further theoretical explanation considered is that of economic geography. We analyse various statistics for industrial change related to economic geogra phy. We also test a specification comparing factor endowments and economic geography. The contribution of economic geography to change in the region is measured and seen to be discernible but small and declining in importance when compared to comparative advantage forces.
Acknowledgements
C on ten ts
1 In tro d u ctio n 14
1.1...Introduction... 14
1.2 The T h e s i s ... 19
2 A n E m pirical Investigation o f th e C hanging Structure o f E ast A sian In d u stry 24 2.1 Introduction... 24
2.2 Theoretical Framework...26
2.3 A Regional Specialisation M e a su re ... 28
2.4 Mobility of Comparative A d v a n ta g e ...33
2.5 Measuring Mobility... 39
2.6 Mapping Mobility ... 45
2.7 Conclusion ... 46
2.8 A p p e n d ix ... 49
2.8.1 Data D escription...49
2.8.2 Revealed Comparative Advantage (RCA) T a b le s ... 51
2.8.3 Transition Matrices ... 75
2.8.4 Stochastic kernels ... 77
3 P a ttern s o f Sim ilarity in Industrial Structure in E ast A sia 79 3.1 Introduction... 79
3.2 Empirical A nalysis... 84
3.3 Econometric Analysis ... 93
3.4 Conclusion ...97
3.5 A p p e n d ix ...99
3.5.1 Data D escription... 99
3.5.2 Industrial structure correlation tables for partner coun tries with respect to base countries... 100
3.5.3 Countries’ years of maximum structure correlation with respect to base country ta b le s... 114
3.5.4 Base country similarity to partner country structure graphs and ta b le s... 117
4 Factor E ndow m ents, Technological P rogress, and Structural Transform ation in East A sia 124 4.1 Introduction... 124
4.2 Theoretical fram ework...129
4.3 Data D escription... 132
4.4 Preliminary Data Analysis... 133
4.5 Econometric analysis... 135
4.5.1 Factor E nd ow m en ts... 135
4.5.2 T echnology... 139
4.6 Conclusion ... 147
4.7 A p p e n d ix ... 149
4.7.1 Data D escription... 149
4.7.2 Data analysis... 151
4.7.3 Regression results and t e s t s ... 153
5 Factor E ndow m ents and E conom ic G eography in East A sia 164 5.1 Introduction...164
5.2 Theoretical Framework... 166
5.3 D a t a ... 171
5.4 Preliminary Data Analysis... 172
5.5 Estimation ...177
5.6 Conclusion ... 182
5.7 A p p e n d ix ... 185
5.7.1 Data d escrip tio n ... 185
5.7.2 Derivation of economic geography v a ria b le s... 188
5.7.3 Regression tests and a n a ly s is ... 192
6 C onclusion 201
L ist o f F igures
2-1 Manufacturing labour force (as % of total labour force) ... 25
2-2 Aggregate Index of Regional Specialisation- 2 Dig ISIC Code . . 29
2-3 National Indices of Regional Specialisation- 2 Dig ISIC Code . . 30
2-4 Aggregate Index of Regional Specialisation- 3 Dig ISIC Code . . 31
2-5 National Indices of Regional Specialisation- 3 Dig ISIC Code . . 32
2-6 China RCA 70-74 ... 51
2-7 China RCA 75-79 ... 51
2-8 China RCA 80-84 ... 52
2-9 China RCA 85-89 ... 52
2-10 China RCA 90-94 ... 53
2-11 China RCA 90-94 Reordered ... 53
2-12 HK RCA.70-74 ... 54
2-13 HK RCA.75-79 ... 54
2-14 HK RCA.80-84 ... 55
2-15 HK RCA 85-89 ... 55
2-16 HK RCA 90-94 ... 56
2-17 HK RCA 90-94 Reordered... 56
2-18 Indonesia RCA 70-74 ... 57
2-19 Indonesia RCA 75-79 ... 57
2-20 Indonesia RCA 80-84 ... 58
2-21 Indonesia RCA 85-89 ... 58
2-22 Indonesia RCA 90-94 ... 59
2-23 Indonesia RCA 90-94 Reordered ... 59
2-24 Korea RCA 70-74 60
2-25 Korea RCA 75-79 ... 60
2-26 Korea RCA 80-84 ... 61
2-27 Korea RCA 85-89... 61
2-28 Korea RCA 90-94 ... 62
2-29 Korea RCA 90-94 Reordered ... 62
2-30 Malaysia RCA 70-74 ... 63
2-31 Malaysia RCA 75-79 ... 63
2-32 Malaysia RCA 80-84 ... 64
2-33 Malaysia RCA 85-89 ... 64
2-34 Malaysia RCA 90-94 ... 65
2-35 Malaysia RCA 90-94 R eordered... 65
2-36 Singapore RCA 70-74 ... 66
2-37 Singapore RCA 75-79 ... 66
2-38 Singapore RCA 80-84 ... 67
2-39 Singapore RCA 85-89 ... 67
2-40 Singapore RCA 90-94 ... 68
2-41 Singapore RCA 90-94 R e o rd e re d ...68
2-42 Taiwan RCA 70-74 ... 69
2-43 Taiwan RCA 75-79 ... 69
2-44 Taiwan RCA 80-84 ... 70
2-45 Taiwan RCA 85-89 ... 70
2-46 Taiwan RCA 90-94 ... 71
2-47 Taiwan RCA 90-94 Reordered... 71
2-48 Thailand RCA 70-74 ... 72
2-49 Thailand RCA 75-79 ... 72
2-50 Thailand RCA 80-84 ... 73
2-51 Thailand RCA 85-89 ... 73
2-52 Thailand RCA 90-94 ... 74
2-53 Thailand RCA 90-94 Reordered... 74
2-54 Stochastic kernel- Pooled sample k e r n e l ... 77
2-55 Stochastic kernel- Pooled sample kernel co nto ur... 78
3-1 National GDP Per Capita- in order of 1960 R a n k in g ... 80
3-2 Percentage of population with secondary education or above . . . 82
3-3 Hong Kong similarity to partner country structure at data points 1974-90 ... 117
3-4 Indonesia similarity to partner country structure at data points 1974-90 ... 118
3-5 Korea similarity to partner country structure at data points 1974-90 ... 119
3-6 Malaysia similarity to partner country structure at data points 1974-90 ... 120
3-7 Singapore similarity to partner country structure at data points 1974-90 ... 121
3-8 Taiwan similarity to partner country structure at data points 1974-90 ... 122
3-9 Thailand similarity to partner country structure at data points 1974-90 ... 123
4-1 Manufacturing value added as share of total GDP- 74,84 & 94 . . 125 5-1 Role of a g ric u ltu re... 173
5-2 Capital endowment... 173
5-3 Skilled labour endow m ent...174
5-4 R&D endow m ent...174
5-5 Forward lin k ag es...175
5-6 Transport costs effect ...176
5-7 Backward lin k a g e s...176
List o f Tables
2.1 RCA gains and losses per country 1970-1994 ... 37
2.2 Pooled sample transition matrix ... 41
2.3 Five year transition m a t r i x ... 41
2.4 Transition matrix- China ... 75
2.5 Transition matrix- Hong K o n g ... 75
2.6 Transition matrix- Indonesia ... 75
2.7 Transition matrix- Korea ... 76
2.8 Transition matrix- M alaysia... 76
2.9 Transition matrix- S in g a p o re ... 76
2.10 Transition matrix- T aiw an... 76
2.11 Transition matrix- T h ailan d... 76
3.1 Agriculture percentage share of G D P ... 85
3.2 Example of IS bilateral correlation m a tr ix ... 87
3.3 Partner maximum similarity with base c o u n tr y ... 88
3.4 Base country maximum similarity with p a r tn e r ...88
3.5 Real GDP per c a p ita ... 94
3.6 Regression results with G D P ... 95
3.7 Regression results with GDP and factor endowments...97
3.8 Industrial structure correlations for partner countries with re spect to Hong K o n g ... 100
3.9 Industrial structure correlations for partner countries with re spect to Hong Kong cont... 101
3.10 Industrial structure correlations for partner countries with re spect to In d o n e s ia ... 102 3.11 Industrial structure correlations for partner countries with re
spect to Indonesia cont... 103 3.12 Industrial structure correlations for partner countries with re
spect to K o r e a ... 104 3.13 Industrial structure correlations for partner countries with re
spect to Korea cont... 105 3.14 Industrial structure correlations for partner countries with re
spect to M alaysia... 106 3.15 Industrial structure correlations for partner countries with re
spect to Malaysia cont... 107 3.16 Industrial structure correlations for partner countries with re
spect to S in g ap o re... 108 3.17 Industrial structure correlations for partner countries with re
spect to Singapore cont...109 3.18 Industrial structure correlations for partner countries with re
spect to Taiw an... 110 3.19 Industrial structure correlations for partner countries with re
spect to Taiwan cont... I l l 3.20 Industrial structure correlations for partner countries with re
spect to T hailand... 112 3.21 Industrial structure correlations for partner countries with re
spect to Thailand cont... 113 3.22 Year of maximum similarity of partner country structure to base
country structure in 1974-90 ... 114 3.23 Year of maximum similarity of partner country structure to base
country structure in 1974-90 cont... 115 3.24 Year of maximum similarity of partner country structure to base
country structure in 1974-90 cont... 116
4.1 Industry value added gains and losses per country, 1974-84 and
1984-94 ... 127
4.2 Factor Accumulation- Capital (1990 PPP US Dollar) and Land (ha) divided by total p o p ... 151
4.3 Factor Accumulation- Education (as percentage of total pop) . . 151
4.4 Japanese Relative Factor Intensity- Value Added and Capital in 1990 US Dollars... 152
4.5 Regression with Factor Endowments and only Time Dummies . . 153
4.6 Regression with Factor Endowments and Time and Country Dum mies ... 153
4.7 Joint significance test of fixed effects-unlagged specification . . . 154
4.8 Joint significance test of fixed effects-lagged specification...154
4.9 Regression with Factor Endowments, 1 Period Lag, and Time and Country D um m ies... 155
4.10 Regression with TFP and Factor Endowments, and Time and Country D u m m ie s ... 156
4.11 Regression with TFP and Factor Endowments, 1 Period Lag, and Time and Country Dummies ... 157
4.12 Capital R ankings... 158
4.13 Low Education Rankings ... 158
4.14 Joint significance test of technology and factor endowments- un lagged specification... 159
4.15 Joint significance test of technology and factor endowments- lagged specification... 159
4.16 Prediction Errors Analysis at Industrial L ev e l... 160
4.17 Prediction Errors Analysis at Country Level... 161
4.18 Standardized Coefficients for Regression with TFP and Factor Endowments, and Time and Country D um m ies... 162
4.19 Specification tests ... 163
4.20 Homogeneity t e s t s ... 163
5.1 Country and industry interactions ... 169
5.2 OLS Regression resu lts... 177
5.3 OLS Regression results with United States in c lu d e d ... 180
5.4 Test for Multicollinearity for 1973-76 d a t a ...192
5.5 Test for Multicollinearity for 1978-81 d a t a ...193
5.6 Test for Multicollinearity for 1983-86 d a t a ...194
5.7 Test for Multicollinearity for 1987-90 d a t a ...195
5.8 Test for Multicollinearity for 1991-94 d a t a ...196
5.9 Correlation between predicted and actual values- Periods . . . . 197
5.10 Correlation between predicted and actual values-Countries . . . . 197
5.11 Correlation between predicted and actual values-Industries . . . 198
5.12 Regression results for interaction terms with country and indus try fixed effects... 199
5.13 Joint test of significance of economic geography variables . . . . 200
5.14 Correlation between predicted and actual- with only Compara-tive Advantage and Geography Terms respecCompara-tively... 200
C hapter 1
In trod u ction
1.1
Introduction
This thesis studies structural change of industry in the rapidly developing economies of East Asia. We are interested in change in the dynamics and composition of industry in these countries, with a specific interest in any com mon themes which can be located. The countries which we analyse are the East Asian nations which have experienced rapid industrialisation at different points in the post-war era. The point of take-off in industrialisation of the coun tries was Japan first in the 1950s; followed by Hong Kong, Singapore, Korea and Taiwan in the 1960s; Malaysia, Thailand and Indonesia in the 1980s; and finally China in the 1990s. We are keen to explore whether there was any con nection in the reasons behind the industrial change witnessed. We believe that national data disaggregated to an industrial level and measured over the period of a number of decades offers a rich and previously thinly^explored source of information on this issue. It allows us to discus^ similarities between experi ences in each country with a higher degree of rigorousness as compared to more aggregate level data.
Our analysis offers evidence of similarities in the pattern of industrial struc ture among the countries. We subsequently investigate the reasons behind the common industrial structure pattern seen. This is done through studying
the applicability of Heckscher-Ohlin, Ricardian and economic geography theory predictions for the industrial change seen in the region.
The tradition of analysing international patterns of industrial development is a well-established one. Kuznets was a pioneer in the field in the 1960s (eg Kuznets (1965), Kuznets (1966)) with his cross-sectional study of the connec tion between income levels and structure of production. The subsequent and extensive work of Chenery (eg. Chenery and Taylor (1968), Chenery (1975)) added more information and analysis to the issue. Large groups of countries were studied at a somewhat disaggregated level of economic sectors over time in order to draw conclusions as to the form and degree of similarity in structure of countries at the same stage of development. It was generally concluded that a number of particular paths of development could be traced internationally. Stable relationships were obtained between income and degree of industrialisa tion for distinct groups of countries. Grouping was related to natural-resource endowments and size of country. These factors would determine which would be early or late industrialisation countries. The availability of natural resources would delay the point at which it was worthwhile for an economy to indus trialise. This work was mainly at an intersectoral level considering agriculture, manufacturing and services. We explore a similar idea for East Asia of attempt ing to draw out similarity in the pattern of development among countries. We differ in that we consider data at an intrasectoral level within manufacturing industry.
The work of Learner (1987) extended that of Chenery by increasing the sophistication of the model used. Land was added as an extra factor to the ex isting implied Heckscher-Ohlin ones of capital and labour, allowing for a richer set of theoretical development outcomes. The innovation allowed for countries to be in particular ‘triangles of diversification’ based on their combinations of endowments of the particular factors. Learner was able to explain differences in industrial structural patterns seen by those such as Chenery on a more firm theoretical footing. More disaggregated data at the three-digit ISIC code level was also studied. Learner found some backing for his general predictions in
the data, with his strongest finding being that there could be a clear difference in the industrial development paths of land-scarce and land-abundant coun tries. Industrial development paths in a two factor, multiple good framework have been analysed through the work of Schott (1999). He utilises the charac teristics of the Heckscher-Ohlin framework to discuss the concept of ‘cones of diversification’. Countries’ capital-labour endowment ratios determine which cone they belong to with each cone only producing a subsector of all possible goods depending on the goods’ factor intensity properties. Countries therefore display different industrial structure characteristics based on their relative en dowment position at the time, with particular goods increasing and declining in importance as countries pass through different cones. We wish to see if sim ilarity in paths of industrial change can be found among our sample countries given their diversity of initial factor endowment mixes and our consideration of multiple goods.
Similarities in the pattern of industrial development in East Asia have been a subject of considerable discussion in the last few decades. It is useful to out line how this discussion developed to indicate what issues have already been addressed by the literaturetm the region and what remaining questions we hope to explain in our workvHesearch interest was initially raised by the stellar devel opment performance of the Newly Industrialising Economies (NIEs)- Singapore, Hong Kong, Korea and Taiwan- from the 1960s onwards. The contentious is sue for analysts was the seeming difference in initial conditions and internal policies of the countries. Hong Kong and Singapore were both city-states with no agricultural hinterland. They both also pursued policies of considerable openness towards foreign trade and investment. Korea and Taiwan were larger countries and significantly more closed towards foreign investment. They were also far more involved in their economies in terms of creating new industries and directing investment into them. Nevertheless the fact that all the countries were industrialising at a similar time led to the thinking that certain common forces were at play among them. The subsequent industrialisation of the non- Singapore ASEAN countries- Malaysia, Thailand and Indonesia- led to further
interest in the reasons behind industrialisation spreading in virtuous turn across the region. It should be noted that these countries displayed complex industrial policy mixes just as observed in the NIE case. The countries were not united in a free-market approach to industry. Malaysia and Indonesia were both keen to ‘pick winners’ by using incentives to promote particular industrial sectors (see World Bank (1993)). For example, the state-owned Heavy Industries Corpora tion of Malaysia was formed in the early 1980s to focus public investment on a heavy industrialization push. Indonesia created a domestic automobile and aircraft industry through protection and support. Nevertheless the countries displayed similar openness and emphasis on encouraging exports.
In view of these experiences the phenomenon was suggested of industrial isation moving in waves from Japan to the NIEs to ASEAN (eg Yamazawa (1992) and Kwan (1994)), often referred to as the “flying geese”. The concept developed on the work of Akamatsu (1962) who discussed the regional spread of a particular industry- textiles. The flying geese idea was an exposition of a form of dynamic trade theory. It suggested that trade and investment flows could integrate economies and create a virtuous cycle of development based on evolving comparative advantage. For example, an economy in a region marked by such integration would import raw materials from less developed neighbors and capital goods from more developed neighbors, causing its stock of capi tal to expand more rapidly than its supply of labor: in other words, shifting its relative factor endowments. This economy would thus be induced to move gradually out of labor-intensive manufacturing and into more capital-intensive production. As this process continued, and capital goods continued to be im ported, the economy would move further up the value-added chain. Drawn on a chart, the process takes a “V” shape, like geese flying in formation with a small group of forerunners leading a larger group of followers. Evidence offered included the increasing role played by exports and manufacturing as a propor tion of the countries’ output. Furthermore, attention was drawn to the nature of industrialisation changing in each of the groups over time with more capital- intensive manufacturing increasingly becoming more important. Support was
provided in broad empirical terms through industrial data at high levels of ag gregation for the idea of changes in industrial structure during the process of the countries’ development. The idea differs from the direct concept of factor endowments resulting in an industrial structure in a particular country through the suggestion th at patterns of change in factor endowments are similar across countries at different points in time, leading to their similar development paths. We consider in our work whether a similar predicted pattern and order of in dustrial development can be found in the region but do this through a study of the structure of disaggregated industry between countries. There is little empirical work to date in this area.
We then explore the empirical importance of the Heckscher-Ohlin model in explaining differing industrialisation patterns in East Asia as compared to a number of other specifications. Traditional empirical work with Heckscher- Ohlin theory has been mainly using trade data. However there has been recent work considering the Heckscher-Ohlin model from the production side. Harri- gan (1995) uses OECD data and finds factor endowments to be important in explaining manufacturing production structure. Harrigan and Zakrajsek (2000) use a panel of both OECD and non-OECD countries and also find an important role for factor endowments in determining production levels. An alternative ex planation for industrial structure is the Ricardian model of industry-specific technological differences. This predicts that countries will produce in indus tries in which they have a technological advantage relative to other countries. Harrigan (1997) considers both Ricardian and Heckscher-Ohlin forces in a for mulation for OECD data, finding that industry-specific technological differences are also important in explaining industrial output variation. We apply a simi lar analysis of factor endowment and technology effects to industrial production data in East Asia to see if there are any common forces which explain change across countries in the region. There has been no exploration to our knowledge of these explanations for industrial change using production data across the re gion and very limited work at the country level (eg. Kee (2001) for Singapore). A more recent theoretical attempt to explain such a regional pattern in
industrial development has been through the concepts of economic geography (eg.Krugman (1991a), Krugman and Venables (1990, 1995)). It discusses how industrial change results in a region through the decision of firms to move between countries or remain on the balance of ‘push’ and ‘pull’ forces. The ‘pull’ forces are the desire to be close to suppliers (forward linkages) and to customers (backward linkages). The ‘push’ forces are related to increases in factor costs, representable as wage increases, through the entry of new firms. It has been posited (Puga and Venables (1996)) that development patterns in East Asia are a possible candidate to be explained by such a model. Though there has been a considerable amount of theoretical work done in this field, empirical work has only emerged recently on testing its applicability. This has been due in part to the need for sufficiently tractable versions of the model. There has been empirical work conducted with respect to international data (eg. Redding and Venables (2001)), the OECD (Davis and Weinstein (1997)) and Europe (Midelfart-Knarvik et al. (2001)), though none to date considering East Asia. We therefore apply an adaptation of one of the specifications (Midelfart- Knarvik et al. (2001)) which enable us to compare the relative importance of factor endowments and a number of economic geography variables in explaining East Asian industrial change.
1.2
The Thesis
We now lay out the chapters which compose this thesis and preview their find ings. In the second chapter we study trends in the composition of industrial production and comparative advantage across the region. It is useful to quantify the degree to which industry is localised in the East Asian region. This provides us with evidence of the degree to which industry has agglomerated in different parts of the region, rather than industry being evenly spread throughout the region. Therefore we obtain an idea as to whether industry characteristics in fluence country choice by firms. The empirical measure used is the Krugman (1991b) index of regional specialisation. We find fairly high specialisation by
most sample countries. We then study the evolution of comparative advantage in the region. We are interested in evidence of significant mobility in industrial ^ sectors and the details of which industries are moving at particular stages of development of a country. A derivative of the Revealed Comparative Advantage measure of international specialisation of Balassa (1965) is utilised. Industrial composition is seen to change rapidly as countries develop with movements in line with a constant increase in industrial technological sophistication. A more formal measure of the mobility observed is then attempted. This is done by means of techniques used by Quah ((1993), (1996a) and (1996b)) to analyse in come convergence in the cross-country growth literature. The chapter points to considerable persistence in country specialisation as well as discernible trends in industrial mobility. Heckscher-Ohlin forces through endowments of labour and natural resource endowments, appear to influence the strongest tenden cies toward comparative advantage. Nevertheless the change witnessed in other industries highlight the possible role played by technological and economic ge ography type effects.
Chapter 3 looks in more depth at whether the patterns of change in com parative advantage seen indicate similarity in paths of industrial change across countries. Our manner of investigation is to compare the industrial structure of pairs of countries in the region through use of an industrial structure mea sure derived from Krugman (1991b). We do this first by seeing how each of the countries’ industrial structure compares to its compatriots in terms of time precedence or lag. What emerges from this discussion is that there is a dis cernible pattern of progression in terms of structural similarity between the sample countries. Countries’ structure continuously evolve towards those of countries more developed than them. The least developed countries are the perennial followers with the middle income developing countries of Malaysia and Thailand coming next, and the most developed countries being in the leading group. We then measure more precisely the dynamic characteristics of similar ities in industrial structure. The connection between industrial structure and developmental stage is studied through an econometric specification. The GDP
per capita ratio between countries is used as an approximation to their relative developmental positions at each point in time. The bilateral GDP per capita ratio and fixed effects as a proxy for differences in initial conditions between countries are used as explanators for changes in bilateral industrial structure correlation. It is found that GDP per capita differences are negative and highly significant in terms of explaining differences in industrial structure. This cor roborates our earlier findings. We explore the components of the relationship by estimating a regression comparing developmental stage and industrial structure with the inclusion as additional variables of differences in some factor endow ments measures among countries. It is seen that the additional variables are not enough to explain the patterns of similarity in industrial structure in the East Asian countries along their development path. It is therefore important to investigate factor endowments in more depth as well as alternative theories as explanations for the common pattern of industrial change seen in the region.
Chapters 2 and 3 discuss the nature and extent of similarity between the industrial change of the East Asian countries. Chapters 4 and 5 analyse pos sible explanations which the countries may have in common to explain their industrial change. Chapter 4 considers Heckscher-Ohlin and Ricardian forces in the region. We investigate the relative endowment positions of the countries between each other to see if this provides pointers as to their relative industrial change compared to their neighbours. The chapter then studies factor endow ment and technological change explanations of disaggregated manufacturing patterns observed in the region. The work is important because of its original empirical attem pt to consider the importance of Heckscher-Ohlin and Ricardian specifications in a comparable manner with respect to East Asian industry. This is done by adaptation of a theoretical specification developed by Harrigan (1997) allowing us to derive separate empirically estimatable constructs for factor en dowments effects and factor endowments considered together with technology. We find discernible patterns and significance in terms of factor endowment and technology effects. Standardized coefficients indicate that skilled labour and capital are the most economically significant variables for the greatest number
of industries. Technology is seen to be less important but still plays a role in explaining manufacturing change in all sectors. Industrial change in each of the sample countries is better explained by a specification which includes technology.
ification for countries and industries and see that it generally does better at explaining the latter in East Asia. The contribution of economic geography to explaining change in the region is measured and seen to be discernible but small and declining when compared to comparative advantage forces. We offer a number of suggestions for why our specification does not find economic ge ography forces to be significant in the region in the sample period, related to the particularities of our specification and method of measurement as well as to the nature of the region's industrial change
C hapter 2
A n E m pirical In vestigation o f
th e C hanging S tru ctu re o f
E ast A sian In d u stry
2.1
Introduction
This chapter seeks to conduct a wide-ranging examination of the changing struc ture of East Asian industry over the last three decades. The period has clearly been one of tremendous development and change in the region with the result ing transformation in the industrial landscape. An understanding of the precise nature of this industrial change in terms of factors such as time precedence and persistence and mobility of industries is useful as a first step in the evaluation of competing theories. Our work follows on from a number of papers which seek to explore the industrial development of different regions in terms of exist ing theory. Examples include Kim(1996) with US regional data, Amiti (1997) and Brulhart (1998) with EU national data, Davis and Weinstein (1999) with Japanese regional data and Ruhashyankiko (1998) with international data.
Our sample group in the region includes China, Hong Kong, Indonesia, Korea, Malaysia, Singapore, Taiwan and Thailand. Industrialisation has spread in the region rapidly over the last 40 years. What is seen in the region is industry
spreading in a series of waves- starting from Japan, spreading first to Korea, Taiwan, Hong Kong and Singapore, then to Malaysia, Indonesia and Thailand, and latterly to China and Vietnam. This can be seen from Figure 2-1, which displays the change in percentage of labour force employed in manufacturing for Japan and two aggregate group of countries. The aggregates are of countries in the two separate waves of industrial change. We see the differing rates and directions of change reflect the different phases of the groups’ industrial change. Some countries are reducing their labour force's involvement in manufacturing while others are employing increasingly more of their people in it. Japan is generally moving downwards from an intermediate level, the first wave of Hong Kong, Singapore and Taiwan are decreasing rapidly from a high level while the second wave of Indonesia, Thailand and Malaysia are increasing equally rapidly from a low base.
Manufacturing labour force (% of total labour force)
ADB, ILO d a ta
■average of HK, Taiw an an d S in g ap o re
■average of Indonesia, Thailand, M alaysia ■Japan
Figure 2-1: Manufacturing labour force (as % of total labour force)
There has been a considerable amount of work done on studying patterns of industrial change in various regions. We discuss what the findings have been regarding specialisation across countries and industries and how our work re lates to it. We subsequently present measures for specialisation based on the
[image:27.595.31.505.31.805.2]Krugman (1991b) regional specialisation index and Balassa (1965)’s industrial revealed comparative advantage (RCA) index. Patterns and anomalies across the region are highlighted in an effort to motivate further work to examine theoretical causes behind the observations. Certain trends emerge fairly clearly which raises questions as to which of a number of theories are the most appro priate for the region.
The layout of the chapter is as follows. Section 2.2 provides a theoretical framework for the empirical analysis to follow. Section 2.3 provides calculations of an index of regional specialisation. Section 2.4 provides measures of relative comparative advantage for industries in each of the East Asian countries in our sample over time. Section 2.5 provides a formal analysis of the dynamics of comparative advantage across countries over time. Section 2.6 maps some of the dynamics observed. Section 2.7 concludes.
2.2
T heoretical Framework
Our work builds on previous work by a number of authors who have stud ied patterns of intercountry industrial specialisation and national intraindustry comparative advantage. A substantial amount of empirical analysis of inter- country specialisation has been conducted with respect to Europe. Speciali sation is considered in terms of either production or exports, with the former generally seen to be rising in the region and the latter decreasing. Examples include Sapir (1996), Amiti (1999), Haaland et al (1999), Midelfart-Knarvik et al. (2000) and Brulhart (2001). For example, Amiti (1999), using production data, finds more countries with increase rather than decrease in specialisation in the region. Similar work has been done on specialization patterns within the US economy such as Dumais et al. (1997), Hanson (1998), Kim (1995), and Krugman (1991). Kim (1995) analyses the US regional specialization pattern over a long time series, 1860-1987, showing that regions were more specialised when the US was becoming an integrated country before the First World War, although since the interwar years specialisation has been falling. Specialisation
in the US and EU have been compared by Krugman (1991), Midelfart-Knarvik et al. (2000) and Aiginger et al (1999). Regional specialisation is seen to be higher in the US than in the EU. Our work is similar in that it considers industrial data across countries, but applies such analysis to East Asia.
National intraindustry comparative advantage is often considered through variants of the export-based measure of Revealed Comparative Advantage (RCA) suggested by Balassa (1965). Numerous applications have been made of the measure to analyse industrial change within countries over time. Examples include Aquino (1981) and Crafts et al. (1986). The question of whether a production or trade based measure should be used to calculate RCA is an im portant one. Both have been suggested with theoretical justification as both production and the pattern of trade are affected by the economic conditions which determine the international pattern of comparative advantage. Ballance et al. (1987) tested numerous RCA measures for consistency between each other. They find that the empirical distinction between industries that enjoy comparative advantage and those that do not is not too sensitive to the choice of RCA index. We will use a trade-based RCA measure.
Another issue with RCA is that it utilises post-trade prices to make judge ments about comparative advantage which refers to pre-trade relative prices. Hillman (1980) analyses this issue and concludes that the RCA measure is applicable to cross-country comparisons and is consistent with the empirical nature of individual country and world trade given certain conditions. These are that the country’s exports of a particular good are simultaneously neither overly prominent in its total exports nor overly prominent in total world trade in that good. An underlying assumption is that the reference countries have identical homothetic preferences.
We utilise a variant of a RCA measure, first looking at change in the relative importance of “named” industries over time within countries. Subsequently we attempt to draw out information about patterns of mobility across industries within countries. This is done by means of techniques used by Quah ((1993), (1996a) and (1996b)) to analyse income convergence in the cross-country growth
literature. This methodology is useful because it utilises both time-series and cross-section variability in the data. Proudman and Redding (1998) also use these methods to find the RCA mobility pattern for the G5 countries. We apply their methodology to East Asian data and extend it by considering dynamics not only via transition matrices, but also via stochastic kernels.
2.3
A R egional Specialisation M easure
It is useful to quantify the degree to which industry is localised in the East Asian region. This provides us with evidence of the degree to which industry has agglomerated in different areas, rather than industry being evenly spread throughout the region. The countries in our sample are Hong Kong, Indonesia, Korea, Malaysia, Philippines, Singapore, Taiwan and Thailand.
The measure we use is from Krugman (1991b) as stated in Kim (1996) and is expressed as:
= £
Eij
Eik
Ej Ek (2.1)
1=1
where Eij is the level of employment in industry i = 1, ....,n for country j
and Ej is the total industrial employment for country j and similarly for country
k. An index value of 0 indicates that the industrial structure of region j is identical to that of region k. The other extreme is an index value of 2, indicating that the regions are completely different in structure. This therefore gives us a measure of differences in industrial structure, and so regional specialisation as well.
Using the sample of 8 countries and at the 2-digit ISIC industry level, we obtain 28 bi-regional indices over time. We can then obtain aggregate indices for each country as well as an aggregate regional index. The country aggregate index for country j is made up of the average of the sum of SIjk for all k. The aggregate regional index is the unweighted average of all the country aggregate indices. The results axe presented in Figure 2-2 in graphical form. The index
is stable over the period 1974 to 1991 between 0.60 to 0.69. This indicates that the degree of regional specialisation is between 30% (i.e. 0.60 divided by 2) to 35%. When compared with a maximum value of 43% and a minimum value of 23% in the American Midwest over the considerable time period 1860 to 1987 (see Kim (1996)), the East Asian region can be argued to have a reasonable amount of regional specialisation. However, it is important to note that the aggregate index numbers obtained depend on the sample of countries which are compared to each other. We have utilised a subset of the world which we feel has some unique characteristics and therefore differences within them axe interesting. The ideal case though would be to compare the region with the world.
Index of Regional Specialisation- 2 digit
A g g r e g a t e
:
74 75 76 77 78 79 80 81 82 83 84 85 86 87 88 89 90 91
Figure 2-2: Aggregate Index of Regional Specialisation- 2 Dig ISIC Code
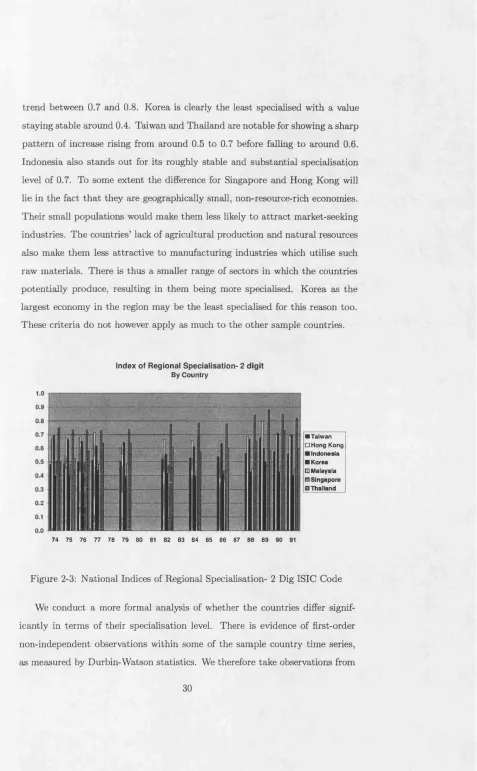
It is perhaps more useful to analyse differences between individual country index numbers to remove some of the issues associated with considering an ag gregate regional index. We therefore disaggregate to a national level to look for variations in specialisation between the sample countries (Figure 2-3). There is a considerable difference in industrial structure with Singapore and Hong Kong being by far the most specialised countries with index numbers on an increasing
[image:31.595.26.506.27.803.2]trend between 0.7 and 0.8. Korea is clearly the least specialised with a value staying stable around 0.4. Taiwan and Thailand are notable for showing a sharp pattern of increase rising from around 0.5 to 0.7 before falling to around 0.6. Indonesia also stands out for its roughly stable and substantial specialisation level of 0.7. To some extent the difference for Singapore and Hong Kong will lie in the fact th at they are geographically small, non-resource-rich economies. Their small populations would make them less likely to attract market-seeking industries. The countries’ lack of agricultural production and natural resources also make them less attractive to manufacturing industries which utilise such raw materials. There is thus a smaller range of sectors in which the countries potentially produce, resulting in them being more specialised. Korea as the largest economy in the region may be the least specialised for this reason too. These criteria do not however apply as much to the other sample countries.
Index of Regional Specialisation- 2 digit
B y C o u n tr y
■ Taiw an □ H ong K ong ■ In d o n esia ■ K orea E) M alaysia § S in g a p o re BD T h ailan d
74 75 76 77 78 79 80 81 82 83 84 85 86 87 88 89 90 91
Figure 2-3: National Indices of Regional Specialisation- 2 Dig ISIC Code
We conduct a more formal analysis of whether the countries differ signif icantly in terms of their specialisation level. There is evidence of first-order non-independent observations within some of the sample country time series, as measured by Durbin-Watson statistics. We therefore take observations from
30
[image:32.595.30.507.34.805.2]every other year for each country to manage this source of autocorrelation. We perform runs tests on each of these country samples and find no evidence of non-randomness. Analysis of the country samples’ residuals also indicates that the specialisation measure is not normally distributed. We therefore conduct a Kruskal-Wallis non-parametric test of similarity of means between the sample countries. We obtain significance at the 0.01% level indicating that the mean specialization levels of the countries are different.
It is worthwhile enquiring as to whether the qualitative nature of the index values is sensitive to the level of disaggregation at industry level. We recalculate all of the above measures at the 3-digit level of ISIC industry classification (Figure 2-4). We find that the pattern of the regional aggregate index is also stable, having a range of between 0.76 and 0.83.
1.0
0.9
0.8
0.7
0.6
0.5 0.4
0.3
0.2
0.1
0.0
Figure 2-4: Aggregate Index of Regional Specialisation- 3 Dig ISIC Code
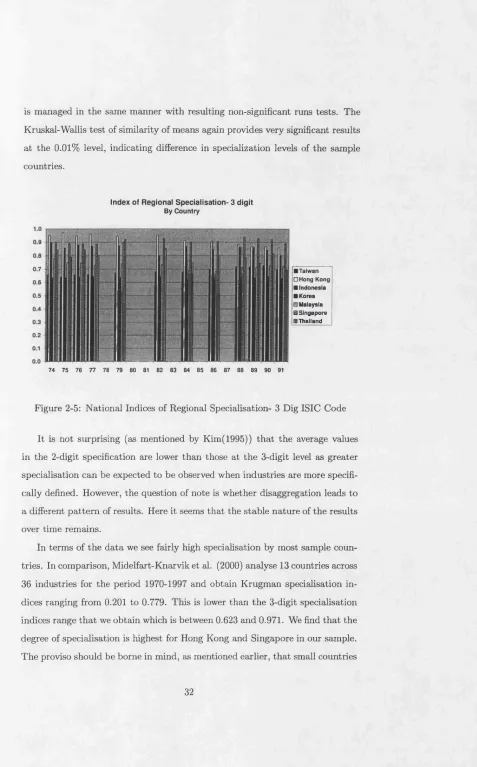
At a national level, similar trends to the previous analysis are seen (Figure 2-5). Hong Kong and Singapore remain the most specialised, though their trend is gradually downwards instead of upwards. Indonesia is also closer to the two leaders than in the previous analysis. We repeat the statistical test for difference in country specialization levels undertaken at the two-digit level. Autocorrelation is found in the country results as in the two-digit case, and
31
Index of Regional Specialisation- 3 digit
A g g r e g a te
I ■
ia n isi i
[image:33.595.25.505.31.799.2]is managed in the same manner with resulting non-significant runs tests. The Kruskai-Wallis test of similarity of means again provides very significant results at the 0.01% level, indicating difference in specialization levels of the sample countries.
Index of Regional Specialisation- 3 digit
B y C o u n tr y
■ Taiwan □ Hong Kong ■ Indonesia ■ Korea 0 Malaysia ■ S ingapore DU Thailand
74 75 76 77 78 79 80 81 82 83 84 85 86 87 88 89 90 91
Figure 2-5: National Indices of Regional Specialisation- 3 Dig ISIC Code
It is not surprising (as mentioned by Kim(1995)) that the average values in the 2-digit specification are lower than those at the 3-digit level as greater specialisation can be expected to be observed when industries are more specifi cally defined. However, the question of note is whether disaggregation leads to a different pattern of results. Here it seems that the stable nature of the results over time remains.
In terms of the data we see fairly high specialisation by most sample coun tries. In comparison, Midelfart-Knarvik et al. (2000) analyse 13 countries across 36 industries for the period 1970-1997 and obtain Krugman specialisation in dices ranging from 0.201 to 0.779. This is lower than the 3-digit specialisation indices range that we obtain which is between 0.623 and 0.971. We find that the degree of specialisation is highest for Hong Kong and Singapore in our sample. The proviso should be borne in mind, as mentioned earlier, that small countries
[image:34.595.29.506.29.796.2]tend to display higher index numbers. Differing specialisation results among the countries may be influenced by a number of other reasons as well. The degree of trade barriers is pinpointed in the theoretical literature as being important. This is because a reduction in tariffs allows the easier separation of production from consumption. Hong Kong and Singapore are known for having the freest trade structures in the region. Korea, Indonesia, Malaysia and Thailand all have trade barriers of various levels for different goods and this may well play some part in the lower specialisation patterns observed.
It is important to note that while the overall extent of specialisation remains relatively constant across countries, which industries a country specialises in may change dramatically over time as we go on to show and discuss. An analysis of regional specialisation along with industrial specialisation serves to provide a rounded picture of the different forces at work in regional industrial change.
2.4
M ob ility o f C om parative A dvantage
We now study the evolution of comparative advantage in East Asia. We are interested in evidence of significant mobility in industrial sectors over the rela tively short sample period of 1970 to 1994 and the details of which industries are moving at particular stages of development. The approach and methodol ogy of the following two sections is adapted from the work of Proudman and Redding (1998) who applied the techniques to EU data.
The index often used for such calculations is the Revealed Comparative Advantage measure of international specialisation of Balassa (1965). RCA of economy i in sector j is defined as the ratio of share of world exports of econ omy i in sector j to share of total world exports of economy i in all sectors. The Balassa index is a relative measure of specialisation as it conditions for country size. This is through its weighting of the export figures in a particu lar industry by the country’s overall share of world exports. Such an idea is sensible if one is concerned about a country’s comparative advantage. This al lows us to understand what factors determine the location of an industry across
countries. However, to understand theories such as new economic geography, it is also useful to think about absolute measures of industry specialisation. These are measures not conditioned by country size. We then obtain an idea of which industries tend to be more concentrated within a region than others, allowing us to consider theories of what determines these industry characteris tics. At present, we will consider a relative specialisation measure but a later investigation of absolute specialisation would be of some interest.
The problem with the Balassa measure is that the mean value of RCA is not necessarily equal to one due to the numerator not being weighted for the proportion of exports accounted for by sector j . At any point in time, one may thus not have a true reflection of the deviation from the mean of a reading. Furthermore, over time the mean may exhibit movement leading to loss of comparability for different data points.
We use instead the alternative RCA measure of Proudman and Redding (1997) which compares the export share of sector j for country i to average export share of country i in all manufacturing sectors N. This provides a logical measure of the relative export strength of a given industry while ensuring through construction that the mean value is constantly one. The measure is as follows,
R C A = , ' (2.2)
Values range from zero to above with a value greater than one indicating a sector in which the country is relatively strong in terms of exports. We study the export composition of manufactures for each sample country over time using trade data for 21 industries obtained from the OECD Bilateral Trade Database (BTD) (as outlined in Appendix 2.8.1). Sample countries used are China, Hong Kong, Indonesia, Korea, Malaysia, Singapore, Taiwan and Thailand.
The data considers exports from these countries to the 23 OECD economies presented in the OECD BTD. The data therefore leaves out intra-country trade between the East Asian sample countries. There is the possibility that an accurate reading of the export structure of the countries, and consequently
their structure of comparative advantage, is not being obtained. In this case we would be obtaining an estimation of the changing structure of the part of a country’s industry involved in extra-regional exports. The use of the data source is not ideal but acceptable for a number of reasons. First, intra-East Asian exports account for a minority of exports in the countries and period concerned. For instance, Bank of Japan (2000) analyses intra-East Asian exports between South Korea, Taiwan, Singapore, Hong Kong, Indonesia, Malaysia Philippines, Thailand and China. It is seen that in the time period 1985-87 intra-regional exports as a percentage of total exports were 17% for the group of South Korea, Taiwan and Singapore, 24% for the group of Thailand, Malaysia, Philippines and Indonesia, and 34% for the group of China and Hong Kong. Another point of concern is the possibility that intra-regional exports may have been increasing significantly during the period analysed. This could lead to the data analysis mistakenly concluding the quantity of exports to have changed for a country when they have actually merely been redirected from extra-East Asian to intra- East Asian destinations. Kreinen and Plummer (1994) analyse intra-East Asian manufacturing exports between South Korea, Hong Kong, Singapore, Thailand, Malaysia, Indonesia and the Philippines in 1981 and 1990. This group does not include China which is discussed separately below. It is seen for the group of Malaysia, Thailand, Philippines and Indonesia that intra-regional exports remained stable at 24.8% from 1981 to 1990. For the group of Singapore, South Korea and Hong Kong intra-regional exports decreased slightly from 14.8% in 1981 to 14.5% in 1990. It may be therefore reasonable to assume that there had not been much change in intra-regional trade in the region during a large part of the time period considered in the analysis.
We have also been keen to use OECD data as the partner countries repre sent relatively stable export markets. We are using trade data to give us an insight into production changes within the East Asian sample countries. We would therefore like this data to be explaining changes within our sample rather than changes within the partner countries. A number of non-OECD countries to which the sample countries export have undergone changes in their tariff
regimes, particularly China. This would affect the amount exported to them by our sample countries, but would not be because of changes in conditions within the sample. Though we see above that intra-East Asian trade for the sample group except for China remained fairly stable over much of the sample period, this is not so much the case if we include China. Mckinnon and Schnabel (2002) see that for the latter group intra-East Asian trade increases from 21.7% in 1980 to 32% in 1990, whereas without China the corresponding figures are 18.9% and 22%. Chinese imports of intermediate manufactured goods rose by 80% between 1984 and 1991, while consumer manufactured goods imports in creased by 999% (World Bank (1994)). The average import tariff in the country fell from 55% in 1982 to 45% by 1994 (Landy (2001)), and quotas and licenses which were applicable to 46% of all tariff lines in the late 1980s were applicable to 18% of tariff lines by 1992. In comparison, the average weighted tariff rate for the OECD between 1980 and 1990 stayed relatively stable at 8-9% (World Bank (2001)).
At each point in time we see the make-up of RCA, and across time we study its evolution. To smooth out shocks we consider five year RCA averages. We obtain 5 sets of RCA figures for each country covering the periods 1970- 74, 1975-79, 1980-84, 1985-89 and 1990-94. The results are listed in Appendix
2.8.2.
Sectors are ranked in order of increasing RCA for the first period. In sub sequent periods, the initial order of ranking is maintained while displaying the new RCA values. This provides an indication of how RCA is changing com pared to the starting date. In each graph, RCA is displayed around the mean value of one. It is clear that there is a substantial degree of RCA mobility for every country in the sample. This is seen most directly if one compares the RCA ordering in the final period to the first period. A grouping of the gains and losses of RCA for each country between the two periods is also instructive as seen in Table 2.1.
C H IN A H O N G K O N G
Gain Loss Gain Loss
Comm, semicond Stone, clay Computers Fabricated metal Electrical machinery Food, drink Instruments
Rubber, plastics Electrical machinery IN D O N E S IA K O R E A
Gain Loss Gain Loss
Rubber, plastics Chemicals Shipbuilding Wood, cork Textiles, leather Computers
Wood, cork Electrical machinery M A LA Y SIA S IN G A P O R E
Gain Loss Gain Loss
Computers Food, drink Computers Chemicals Rubber, plastics Non-ferr metals Wood, cork TA IW A N T H A IL A N D
Gain Loss Gain Loss
Computers Computers Non-ferr metals Fabricated metal Comm, semicond
Electrical machinery Rubber, plastics
Table 2.1: RCA gains and losses per country 1970-1994
Most countries have similar ratios of gains to losses. However Thailand is notable for gains in four sectors the largest of the group, whereas Singapore only gains in one sector the lowest of the sample countries. Singapore, Malaysia and China also stand out for losing two sectors, whereas the others lose one or none in the case of Taiwan. A closer look at the composition of gains and losses is highly instructive and raises many possible questions. The computer industry is gained by all the countries except China and Indonesia. It seems that only the two poorest countries in the sample fail to gain this industry. The widespread distribution of the industry could be explained by the fact that when industries spread to new countries they do not abandon their previous host but instead maintain some resources there. Singapore, for instance, has gradually lost many lower-end high-technology operations while maintaining top-end production, R&D and headquarters divisions.
Newer developing countries such as Indonesia, Malaysia, Thailand and China have gained less-skilled sectors such as rubber, plastics, wood and cork whereas their more developed neighbours have not gained operations of as great a labour- intensity. Indeed, Singapore and Korea lost sectors such as wood and cork over the period. This matches the expectations of factor endowments theory. It also chimes with new trade theory models which foresee labour-intensive industries with no great agglomeration forces being the first to move between countries as wage cost pressures are critical to them. However, a model such as Young (1992) also fits the data with countries gradually moving up the technological ladder. To establish the more relevant model, tests of the causes of regional industry movement analysing factor endowments, technology and economic geography need to be undertaken.
In addition to an actual gain or loss of RCA, there are substantial changes in the degree of RCA for a sector. This is seen by a change in the height of columns. For example, while Taiwan did not lose its RCA in textiles and footwear, its degree was dramatically reduced from 2.85 to 1.08 (remembering that 1 is the mean). Therefore the changes expected by theory such as move
ment of industries to lower-wage countries are often occurring but not to a great enough degree to show up as a change in the direction of RCA.
We can obtain an idea of the overall extent of specialisation in a country by looking at a graph of RCA for the final period 1990-94 displayed in increasing order. We do not find systematically higher RCA figures in specific sectors and smaller RCA in others when comparing their evolution with the first period 1970-74. This would exhibit itself as more concentrated end-points of the graph in the final period compared to the first one.
2.5
M easuring M obility
A more formal analysis of the mobility which can be observed from the above graphical analysis is now attempted. This is done by means of techniques used by Quah ((1993), (1996a) and (1996b)) to analyse income convergence in the cross-country growth literature.
Considering RCA for an industry in a country as x, distribution of its val ues across industries at a point in time is referred to as G{x)t. If we assume for simplicity that the behaviour of RCA follows a first-order autoregressive process, the behaviour of RCA over time can be modelled as,
G{x)t+1 = A.G{x)t (2.3)
where A is a vector term which describes the mapping of the previous dis tribution of RCA to the current distribution of RCA in the country. RCA distribution at any point further ahead in time can be considered in the same manner by an iteration of the above process forward. We thus have,
G(x)t+m = (A.A A).G(x)t (2.4)
= Am.G(x)t
The above formulation taken to a point forward m of oo provides the ex pected long run behaviour of RCA if we believe that changes in RCA behave in a first-order autoregressive manner. This allows us to see whether RCA in the long rim displays increasing specialisation, equivalent to understanding the evo lution of the external shape of the RCA distribution rather changes within it. The division of the space of possible values of x into a number of discrete cells
w (in our case four) allows us to obtain a transition matrix of the probabilities of annual RCA observations remaining the same or moving to another of the value spaces w. These probabilities are measured by counting the number of entrants and leavers with respect to a particular cell (which for us represents a particular range of RCA). This provides us with a measure of mobility of RCA from its lower to higher regions. Measures of movement in the RCA distribu tion as time tends to oo are also obtained and referred to below as the ergodic distribution. The cells in all cases were calculated to provide a roughly equal number of industry-year observations in each. All calculations were undertaken with Quah’s TSRF econometrics package.
Transition matrices were obtained using annual RCA data for each of the sample countries and the tables are presented in Appendix 2.8.3. As a guide to reading the tables, we use the example of the pooled sample which is presented in Table 2.2. The pooled sample is also very useful as a guide against which the individual country matrices are compared to check for differences. The numbers in the first column represent the number of industry-year observations beginning in the relevant cell (1112, 937,1001 and 998). The top numerical row numbers are the upper end-point RCA values of the relevant cells (0.04, 0.22, 0.99, oo). The subsequent numerical rows have the following interpretation. They provide the probability of leaving a particular state of RCA and moving to each of the other possible RCA states. For example, the third numerical row shows the probability of remaining in the lower-intermediate RCA state (0.81) or moving to either the lowest (0.08), higher-intermediate (0.11) or highest (0.00) RCA states. The sixth numerical row provides the ergodic distribution.
Pooled Number (1112) (937) (1001) (998)
UpperEndpoint
0.04 0.22 0.99 oo 0.89 0.10 0.01 0.00 0.08 0.81 0.11 0.00 0.00 0.07 0.84 0.08 0.00 0.00 0.06 0.93 Ergodic 0.156 0.195 0.289 0.360 Table 2.2: Pooled sample transition matrix
To see if the assumption of a first-order process is valid in the long run, we check for the degree of similarity between the one-year transition matrix iterated five times and the five year transition matrix. If the evolution of RCA was fully characterised by a first-order time-homogenous model we would expect both sets of results to be identical. This comparison is conducted for the pooled sample as shown in Table 2.3. We see that there are differences between the two, indicating that the evolution of RCA is not exactly characterised by a first-order autoregressive process. The probabilities of persistence for the five year transition matrix are higher than the one-year transition matrix iterated five times. Nevertheless the order of the probabilities of moving between states is very similar in both cases. In addition to the one year iterations listed in the tables in Appendix 2.8.3, we calculate five year iterated transition matrices for each of the sample countries as an approximation to medium-term patterns of movement between states.
5 Year Pooled UpperEndpoint
Number 0.10 0.42 1.29 oo (144) 0.73 0.23 0.04 0.00 (117) 0.07 0.63 0.29 0.01 (114) 0.01 0.18 0.65 0.17 (129) 0.00 0.00 0.15 0.85 Ergodic 0.062 0.201 0.340 0.397
lx transitions iterated 5x
0.61 0.28 0.10 0.01 0.22 0.44 0.28 0.06 0.03 0.17 0.50 0.25 0.00 0.03 0.19 0.73 Table 2.3: Five year transition matrix
The main diagonal for each table shows the probability of remaining in any particular state as opposed to all other states. The probability of mobility from each state is therefore one minus the probability of persistence in the state. Analysing this, we see in the transition matrices in Appendix 2.8.3 that the range between lowest and highest probabilities of moving states from a par ticular state is 8%-22% (China), 6%-19% (Hong Kong), 5%-35% (Indonesia), 6%-14% (Korea), 6%-16% (Malaysia), 6%-31% (Singapore), 7%-23% (Taiwan) and 6%-26% (Thailand). The lowest probability of moving states is very simi lar between countries while the highest probability of moving states displays a considerable range. Still, all of the highest probability figures axe substantial enough to support our belief of considerable mobility in all sample countries. We can confirm our belief that there is substantial mobility by looking at the values for the one year transition matrix iterated five times. This gives us an approx imate idea of outcomes in a longer time frame. We obtain much higher mobil ity values as compared to one-year transitions, of 30%-49% (China), 24%-55% (Hong Kong), 19%-52% (Indonesia), 33%-46% (Korea), 23%-49% (Malaysia), 23%-69% (Singapore), 27%-61% (Taiwan) and 24%-65% (Thailand). There ap pears to be a rather substantial tendency to move between RCA states over the longer term.
It is highly instructive to look into the details of the transition matrices. It is seen that in all cases the lowest probability of leaving a state is when RCA is highest. This seems to indicate that a sector in which an economy is clearly highly specialised does not change easily. A more informal view by means of studying the RCA graphs provides further detail of this phenomenon. The industries at the highest RCA level in the initial period for most countries (Hong Kong, Thailand, Singapore, Korea and China) tend to