M E T H O D
Open Access
High-efficiency RNA cloning enables accurate
quantification of miRNA expression by deep
sequencing
Zhaojie Zhang
1†, Jerome E Lee
1†, Kent Riemondy
1, Emily M Anderson
2and Rui Yi
1*Abstract
Small RNA cloning and sequencing is uniquely positioned as a genome-wide approach to quantify miRNAs with single-nucleotide resolution. However, significant biases introduced by RNA ligation in current protocols lead to inaccurate miRNA quantification by 1000-fold. Here we report an RNA cloning method that achieves over 95% efficiency for both 5′and 3′ligations. It achieves accurate quantification of synthetic miRNAs with less than two-fold deviation from the anticipated value and over a dynamic range of four orders of magnitude. Taken together, this high-efficiency RNA cloning method permits accurate genome-wide miRNA profiling from total RNAs.
Background
MicroRNAs (miRNAs) are a class of small (approximately 20 to 22 nucleotides), non-coding RNA species that are broadly expressed in almost all eukaryotes. They regulate diverse biological processes by targeting a large number of protein-coding mRNA transcripts [1]. The widespread regulation of mRNAs by miRNAs is supported by the evidence obtained from computational analysis [2,3], transcriptome analysis [4,5] and proteome profiling [6,7]. With recent developments in quantitative mRNA profiling, it is estimated that the median copy number of an mRNA is 17 molecules, and the dynamic range for
mRNA copy number is approximately 104 in a single
mammalian cell [8,9]. Because miRNAs regulate mRNA expression in a stoichiometric manner [10,11] and a conserved miRNA is predicted to recognize approximately 400 target sites [1,12], such broad variation in mRNA expression suggests miRNAs could differentially regulate highly or lowly expressed mRNAs. Indeed, it was recently demonstrated that miRNAs could function either as a switch or a fine-tuner, depending on the copy number of both miRNAs and their cognate mRNA targets [10]. Adding to the complexity of miRNA-mediated regulation,
other RNA species, including competing endogenous mRNAs or circular RNAs, were recently shown to function as a molecular decoy by titrating miRNAs from their functional mRNA targets [13-16]. Collectively, these studies suggest that a highly expressed miRNA is capable of regulating many more mRNA targets and/or repressing mRNA targets more potently than a lowly expressed miRNA within a cell. Therefore, these findings highlight the importance of accurately determining the relative expression levels of different miRNAs in a given cellular context.
Three major platforms, quantitative real-time reverse transcription PCR (qRT-PCR), microarray and small RNA cloning followed by deep sequencing (miRNA-Seq), have been developed for genome-wide miRNA profiling. However, both qRT-PCR and microarray platforms are hybridization-based techniques suitable only for known miRNAs and are unable to provide single-nucleotide reso-lution for miRNA detection. Furthermore, due to the limitation of probe design for such a short sequence of miRNAs, absolute quantification of individual miRNAs requires extensive optimization and individual internal controls [17]. In contrast, with the rapid development of next-generation sequencing techniques, miRNA-Seq has the potential to provide single-nucleotide resolution of
miRNA species, facilitate de novo miRNA discovery, and
offer nearly unlimited dynamic range for miRNA quantifi-cation [18]. The enthusiasm towards miRNA-Seq, however, * Correspondence:[email protected]
†Equal contributors 1
Department of Molecular, Cellular, and Developmental Biology, University of Colorado, Boulder, CO, 80305, USA
Full list of author information is available at the end of the article
© 2013 Zhang et al.; licensee BioMed Central Ltd. This is an open access article distributed under the terms of the Creative Commons Attribution License (http://creativecommons.org/licenses/by/2.0), which permits unrestricted use, distribution, and reproduction in any medium, provided the original work is properly cited.
has been severely dampened by the identification of signifi-cant biases introduced during small RNA cDNA library preparation, often more than three orders of magnitude for individual miRNAs [19,20]. Although the cloning biases are likely caused by many factors, the RNA ligation has been identified as one of the major sources [20]. Consistent with this view, recent studies with modifications to the ligation reactions have shown some promise to reduce the cloning bias [21-23]. However, a highly effective method for genome-wide miRNA quantification by deep sequencing has yet to be successfully developed.
In this study, we investigate the highly biased miRNA quantification by current miRNA-Seq methods with 29 representative miRNAs. We demonstrate that inefficient
and biased RNA ligation for both 3′ and 5′ adapter
ligation is the major contributing factor for the inaccurate quantification. To develop an unbiased RNA cloning protocol, we have performed extensive tests with multiple customized adapters, RNA ligases as well as ligation con-ditions. As a result, we have established an RNA cloning strategy that allows nearly 100% ligation efficiency for both 3′and 5′ligation steps. When applied to a pool of either equimolar or differentially mixed synthetic miRNAs, our method achieves less than two-fold deviation from the expected results for each miRNA. We further demonstrate that the unbiased cloning is applicable to complex RNA mixtures usingCaenorhabditis eleganstotal RNA with the synthetic mix spiked in. Finally, we apply our method to biological samples isolated from multiple mouse tissues as well as HeLa cells. Our results provide a quantitative view of miRNA expression for each of these samples. These data also reveal that most cistronic miRNAs that are derived from a single transcript are expressed at similar levels, and that miRNAs repress their target expression in a dose-dependent manner. Taken together, we have established a highly efficient miRNA-Seq method that accurately quantifies individual miRNAs whose expression levels are across four orders of magnitude. Furthermore, the optimized RNA ligation can be readily applied to other RNA ligation-based RNA-Seq methods to provide quanti-tative insights for RNA transcripts.
Results and discussion
Characterization of systematic bias in current miRNA-Seq method
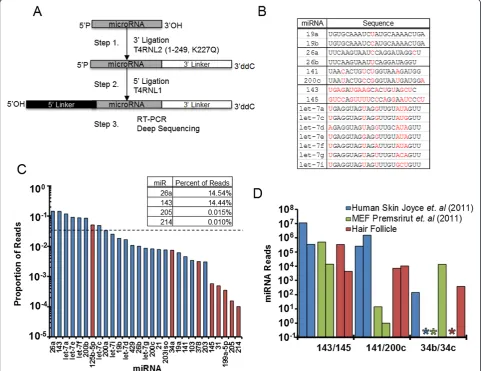
Since the original small RNA cloning technique was devel-oped forde novomiRNA discovery, it has played an instru-mental role in uncovering the fascinating world of small RNAs that includes miRNAs [24-26], piwi-interacting RNAs (piRNAs) [27,28] and endogenous small-interfering RNAs (siRNAs) [29,30]. To characterize the molecular identity of small RNAs, 3′and 5′adapters are sequentially attached to these tiny molecules by RNA ligase (Figure 1A). The ligation steps provide anchor sequences for subsequent
reverse transcription and PCR reactions that amplify and convert the pool of small RNA molecules into a double-stranded DNA library (Figure 1A). To investigate the systematic biases and optimize the quantitative performance of the existing method, we synthesized a small but representative pool of 29 miRNAs (Table S1 in Additional file 1). This pool included closely related miRNA family members that differ by one, two or multiple nucleotides at different positions (for example, miR-19, miR-26, let-7 and miR-200 families), miRNAs that are clustered in the same genomic locus but with unrelated sequences (for example, miR-143/145), as well as miRNA isoforms that are derived from the same hairpin but with a single-nucleotide difference (Figure 1B). In addition, we also included in the pool miR-31, one of the least cloned miRNAs from a previous study [20]. When tested with the current protocol, this pool of 29 synthetic miRNAs has recapitulated the >1,000-fold deviation in cloning frequency as reported previously with a large collection of synthetic miRNAs [20] (see below for details). Finally, with the exception of let-7a, which is identical to let-7 in C. elegans, 28 out of these 29 miRNAs are also specific to vertebrates. This design allows the synthetic miRNAs to be mixed with total RNAs obtained fromC. elegansand, in doing so, simulates complex RNA substrates represented in biological samples (see below for details).
RNA folding contributes to the systematic bias
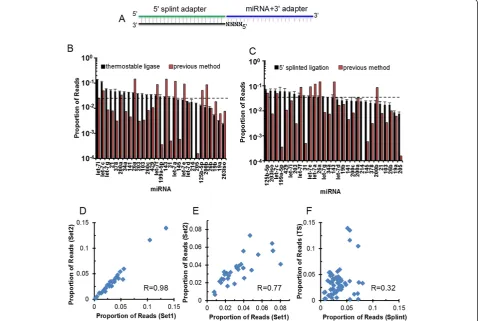
We noted that miRNAs with >50% GC content were consistently among the poorest cloned ones in our syn-thetic pool (Figure 1C, red bars; Table S2 in Additional file 1). These results suggest the possibility that stable hybridization between 3′ligated RNA substrates and the 5′ adapter may inhibit ligation. We then took two approaches to reduce the RNA folding during 5′ligation. First, we employed a thermostable RNA ligase and performed the 5′ ligation at 60°C instead of room temperature as required for T4 RNA ligase 1. We reasoned that with the elevated temperature we would significantly reduce intermolecular base-pairing. The second approach made use of a splint adapter that is the reverse complement of the full-length 5′adapter plus a randomized four-nucleotide 5′overhang
[image:3.595.57.539.91.462.2]at the 3′end of the 5′adapter (Figure 2A). This pre-annealed splinted adapter should largely eliminate any intermolecular hybridization between the 5′adapter and 3′ligated RNA substrates. Consistent with our hypothesis, both modifications achieved considerable improvement in quantitative representation of individual miRNAs by miRNA-Seq. Compared to >1,000-fold deviation from the anticipated value (each miRNA's cloning frequency is expected to be 3.45% from the equimolar mix) by the current method (Figure 1C), the deviation was reduced to approximately 14.7-fold by the thermostable ligase (Figure 2B) and to approximately 4.5-fold by the splint adapter (Figure 2C). When we repeated the experi-ments under identical conditions for each modification, we obtained reproducible results (r = 0.98 and 0.77,
Figure 1Current miRNA-Seq method yields inaccurate miRNA quantification. (A)Schematic of the two-step ligation protocol used to prepare small RNA libraries for deep sequencing.(B)Table of representative miRNAs from the 29 synthetic miRNA pool grouped by cluster where sequence differences are in red.(C)Representative result of deep sequencing from an equimolar mixture of the 29 synthetic miRNAs. Dashed line indicates expected cloning frequency for all, red bars indicate miRNAs with≥50% GC content. Note the deviation is more than three orders of magnitude.(D)Deep sequencing data from previously published results, and one of our skin samples obtained from mouse hair follicle, grouped by miRNA clusters. Asterisks denote the absence of sequencing reads for a miRNA.
Zhanget al. Genome Biology2013,14:R109 Page 3 of 13
respectively; Figure 2D,E). However, the correlation coeffi-cient between these two approaches is low (r = 0.32; Figure 2F). This suggests that different ligation reactions have variable efficiency for individual miRNAs.
High-efficiency RNA ligation
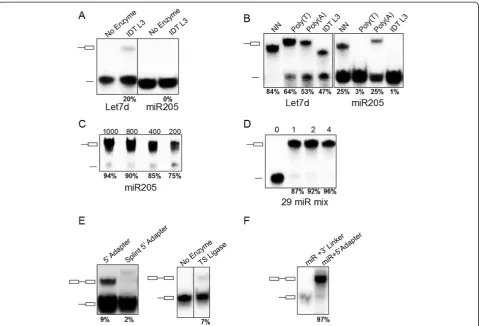
We then examined RNA ligation efficiency for both 3′and 5′ligation steps with different ligases and RNA substrates. Because let-7d was routinely found in our miR-Seq dataset at expected or greater than expected levels and miR-205 was often under-represented, we selected these two miRNAs for the initial test. We first 5′end-labeled let-7d and miR-205 with32P and examined 3′ligation efficiency with a previously published 3′ linker [24]. We observed low ligation efficiency for both substrates. Whereas let-7d showed modest levels of ligation, miR-205 was a particu-larly poor substrate in the reaction (Figure 3A). This result prompted us to include polyethylene glycol in subsequent reactions and to design several additional 3′adapters, as
previous reports indicate these factors influence ligation preference [21,35]. We synthesized DNA oligonucleotides
beginning with T10, A10, and NN randomized adapters
[image:4.595.60.539.91.412.2]followed by Illumina 3′adapter sequences (see Table S3 in Additional file 1 for details) and converted them into pre-adenylated adapters with a recently established reaction (Figure S2 in Additional file 1) [22]. Interestingly, miR-205 and let-7d showed strong preferences for 5′-A and 5′-T, respectively (Figure 3B). Importantly, both miR-205 and let-7d ligated most efficiently to the 5′-NN randomized adapter (Figure 3B). These observations suggest that different miRNAs exhibit different preferences for the 5′nucleotide(s) of the 3′adapter, and that the randomized adapter has the best potential to be ligated to diverse RNA substrates with high efficiency. Furthermore, we reasoned if ligation efficiency can be enhanced to near 100% for all miRNAs, the bias introduced by RNA ligase in the miRNA-Seq method could be largely eliminated. Previous studies of individual RNA ligation reactions suggest that
Figure 2Improved 5′ligation reactions reduce cloning bias. (A)Schematic of the 5′ligation splint where the DNA splint is shown in black, the 5′RNA ligation adapter is shown in green, the randomized nucleotides are shown as 'N', and the product of the 3′ligation (miRNA + 3′ adapter) is shown in blue.(B)Representative result of deep sequencing from an equimolar mixture of the 29 synthetic miRNAs using the original cloning method (red bars) and the thermostable RNA ligase for the 5′ligation (black bars). Dashed line indicates expected cloning frequency.
a high concentration of polyethylene glycol (PEG)8000 improves ligation efficiency [35], and that RNA ligation efficiency is correlated with the concentration of RNA ligase [36], and that dimethylsulfoxide (DMSO) stimulates ligation to highly structured tRNAs [37]. We therefore tested all of these conditions and determined that with
10% PEG8000 and gradually increased 3′adapter
concen-tration we could approach 100% ligation efficiency even for miR-205, a particularly poor substrate (Figure 3C). To test whether our optimized condition is suitable for a broad range of substrates, we labeled a mix of all 29 synthetic
miRNAs and performed the 3′ ligation. As shown in
Figure 3D, all RNA substrates were effectively ligated by a 2-hour ligation reaction.
Having established an effective ligation method for the 3′ligation, we re-visited the 5′ligation. Similar to the 3′
[image:5.595.59.539.88.414.2]ligation, the 5′ligation efficiency in the current method was also very low. We observed 9% efficiency collectively for the mixed synthetic miRNAs (Figure 3E). In addition, the ligation efficiency for the thermostable ligase and the 5′ splint adapter was also very low at 7% and 2%, respectively (Figure 3E). These results prompted us to optimize the 5′ ligation efficiency. We took a similar approach based on our success in the 3′ligation. This included: 1) the use of 3′end NN randomized adapter; 2) further increasing the PEG8000 concentration to 20% in the reaction buffer; and 3) elevating the reaction temperature to 37°C. As shown in Figure 3F, these modifications optimized the 5′ligation to approximately 97% efficiency. Taken together, these results demonstrate that we have established a highly efficient method for attaching both 3′and 5′adapters to miRNA substrates.
Figure 3Optimized RNA ligation conditions achieve high efficiency for both 3′and 5′ligation steps. (A)3′ligation efficiencies were determined by resolving ligation reactions with radiolabeled synthetic miRNA substrates and Linker-3 (Integrated DNA Technologies) on 15% Urea-PAGE. A dash indicates free miRNA; a dash with a box indicates 3′ligation product. The numbers at the bottom indicate the percentage of ligated species relative to the total.(B)3′ligation efficiencies were tested as in(A)with varying 3′linkers and 10% w/v PEG8000.
(C)3′ligation efficiency was enhanced by increasing the amount of NN linker used. The numbers at the top indicate fold molar excess of linker to substrate RNA.(D)A mixture of 29 synthetic miRNAs were radiolabeled and subjected to enhanced 3′ligation conditions in the presence of 0.5μg of total RNA obtained from mouse skin. The numbers at top indicate time in hours the reaction was carried out.(E)5′ligation efficiencies were assessed using gel-purified, radiolabeled, 3′ligated, equimolar 29 synthetic miRNA mixtures with T4 RNL1 (left panel) at room temperature or with thermostable (TS) RNA ligase at 60°C (right panel) for 2 hours. The numbers at the bottom indicate the ligation efficiency, and a dash between two boxes indicates 5′ligation product.(F)Optimized 5′ligation reaction achieves 96% ligation efficiency.
Zhanget al. Genome Biology2013,14:R109 Page 5 of 13
High-efficiency RNA ligation allows quantitative measurement of synthetic miRNAs by miRNA-Seq
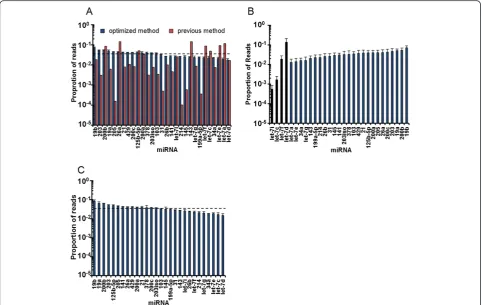
We next applied our optimized ligation method to miRNA-Seq. We first tested with the equimolar mix of 29 synthetic miRNAs. As shown in Figure 4A, our method drastically improved the quantitative performance of miRNA-Seq. In sharp contrast to the >1,000-fold deviation obtained by the current method, each miRNA was cloned within 1.8-fold deviation by our optimized miRNA-Seq. The reproducibil-ity of our method was high (r > 0.9) even when we used different amounts of input RNAs (Figure S3 in Additional file 1). We further tested the dynamic range of our opti-mized method by mixing four individual let-7 members at concentrations across 4 orders of magnitude together with 25 other synthetic miRNAs. We observed a cloning ratio of 8.0:1.0:0.1:0.03 for the four let-7 members, compared with the anticipated ratio of 10:1.0:0.1:0.01 (Figure 4B). This further validated that our method is quantitative over a broad dynamic range (approximately 104). Finally, to examine the performance of our approach with biological samples, we made use of a more complex RNA mixture
whereC. eleganstotal RNA was spiked with 28 vertebrate-specifi miRNAs. When we examined the cloning frequency of these 28 miRNAs, they were indistinguishable from the results obtained from synthetic miRNA-only reactions (Figure 4C). This result indicates that our optimized miRNA-Seq is applicable to total RNA samples. Col-lectively, these results demonstrate that our optimized miRNA-Seq method has achieved a highly quantitative miRNA measurement with a broad dynamic range.
Quantitative miRNA-Seq provides insights into miRNA expression in biological samples
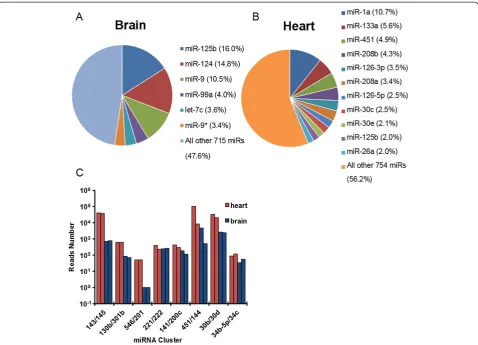
[image:6.595.57.540.359.664.2]We then applied our quantitative miRNA-Seq to biological samples obtained from neonatal mouse (postnatal day 7.5) heart and brain in which many individual miRNAs have been functionally characterized. Consistent with previous individual studies, we identified miR-125-5p, miR-124 and miR-9/9* as the most abundantly expressed miRNAs in the brain [38-42] and miR-1, miR-133a, miR-451, miR-208 and miR-126 as the most abundantly expressed miRNAs in the heart (Figure 5A,B) [43-46]. Interestingly, for both brain
and heart, the total miRNA pool is dominated by a small number (approximately 10) of highly expressed miRNAs, although more than 700 miRNAs were detectable in both samples (Figure 5A,B). To further examine the quantitative performance of our method in these biological samples, we analyzed the cloning frequency of several clustered, cistronic miRNAs in both samples. We obtained very similar cloning frequency for many of these clustered miRNAs across a broad range of cloning frequencies (Figure 5C). For example, two highly expressed miRNAs in the heart but not in the brain, miR-143 and miR-145, showed very similar read numbers within each sample despite their expression levels differing by 50-fold amongst the two samples (Figure 5C). As an example of lowly expressed miRNAs, miR-546 and miR-201 were both cloned 51 times in the heart and yet only one time in the brain (Figure 5C). The ability to clone these clustered miRNAs very similarly in each biological sample indicates that our method quantitatively represents miRNAs likely across four orders of magnitude in biological samples,
similar to the benchmark with synthetic miRNAs (compared with Figure 4B). We also noted that among all of the clustered miRNAs examined, 451 and miR-144 consistently showed approximately 10-fold differential expression in both heart and brain (Figure 5C). This is likely explained by the fact that miR-451’s biogenesis is uniquely Ago2-dependent and Dicer-independent [47-49], unlike all other miRNAs known to date, including miR-144. Thus, such differential expression captured by our method is likely reflective of the differential processing efficiency between different miRNA biogenesis pathways.
Quantitative miRNA-Seq also provides the opportunity to accurately quantify miRNA isoforms differing by only one nucleotide. Although most miRNA isoforms vary at
the 3′end, these sequence changes are thought to have
little impact on targeting as the 5′ seed region is the primary determinant for target recognition [1]. However,
miRNA isoforms that differ at the 5′end would cause a
[image:7.595.59.538.88.433.2]shift in seed sequence, likely altering their target recogni-tion. In a recent study, we identified in vivo targets of
Figure 5Optimized miRNA-Seq faithfully captures miRNAs from biological samples. (A)Deep sequencing data of mapped miRNA reads cloned from total RNA isolated from mouse brain and(B)heart. The most cloned miRNAs are shown with the cloning frequencies.(C)Deep sequencing data of miRNA reads for cistronic miRNAs obtained from mouse heart and brain. Note the highly similar representation of each cistronic miRNA by read numbers across four orders of magnitude, except for the miR-451/144 cluster.
Zhanget al. Genome Biology2013,14:R109 Page 7 of 13
miR-203, a highly expressed miRNA in the skin. We found that down-regulated mRNAs upon miR-203 induction showed enrichment for not only the 2-8 seed matches in their 3′UTRs, but at positions 3-9 as well [50]. Although the 2-8 seed match is expected, the 3-9 seed match on the mRNA indicates a shifted seed region. We then examined the cloning results for miR-203 in the skin. Interestingly, we found a major miR-203 isoform that was trimmed by one nucleotide from the 5′end (Figure 6A). Importantly, this isoform was cloned at approximately 50% of the frequency of the canonical miR-203 (6.7% compared to 13.3% total cloning frequency). The apparent 3-9 seed match we observed previously was likely the result of targeting of the shortened isoform at position 2-8. To validate the expression of these two miR-203 isoforms, we
performed 5′ end primer extension analysis that allows
specific detection and quantification of each isoform. As expected, the canonical form was indeed expressed at approximately two-fold higher than the shortened isoform (Figure 6B). As a control, we did not detect any signal in a Dicer knockout sample where all miRNAs, including miR-203, are depleted [31]. To further confirm the identity of these two isoforms, we performed northern blotting on RNA isolated from mouse total epidermis and again observed two differentially expressed miR-203 isoforms that differ by a single nucleotide (Figure 6C). Taken together, these results further illustrate the applica-tion of our quantitative miRNA-Seq in the identificaapplica-tion of functionally important miRNA species with single-nucleotide resolution.
Differentially expressed miRNAs repress their targets in a dose-dependent manner
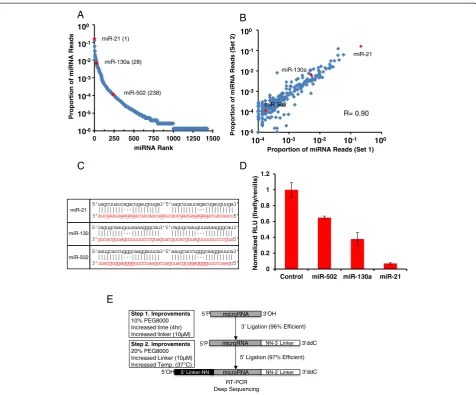
Having demonstrated the quantitative capacity of our optimized miRNA-Seq, we asked whether we can leverage the information of relative expression level of individual miRNAs to determine their functional potency in a cellular
context. Because miRNAs function in a dose-dependent manner [10], we reasoned that a highly expressed miRNA would exert a stronger degree of repression on its targets than lowly expressed ones. To test this hypothesis, we performed miRNA-Seq with HeLa cell total RNAs and determined miR-21 as the most highly expressed miRNA in these cells (Figure 7A). In addition, independent experi-ments with these biological samples were also highly reproducible (Figure 7B). To determine whether highly expressed miRNAs are indeed more potent in repressing their targets, we generated a series of heterologous lucifer-ase reporters for three miRNAs expressed at different levels in HeLa cells (Figure 7A). Each reporter contained 2× targeting sites for each miRNA with a central bulge located between 10 to 12 nucleotides (Figure 7C). As expected, miR-21, the most highly expressed miRNA, showed strongest repression; miR-130a, a modestly ex-pressed miRNA, showed intermediate repression; whereas miR-502, a lowly expressed miRNA, showed weak re-pression of the luciferase activity (Figure 7D). This result supports the functional significance of highly expressed miRNAs in a specific cellular context and that our quantitative miRNA-Seq allows rapid identification of these miRNAs in a high-throughput manner.
Conclusions
[image:8.595.55.540.549.664.2]In this study, we have developed a highly efficient miRNA-Seq method to quantify individual miRNAs within a biological sample (Figure 7E). Although the RNA-ligase-introduced bias has been widely recognized [19-22], a systematic solution generally applicable for a broad spec-trum of small RNA substrates has not previously been developed. Such a bias, often leading to more than 1,000-fold deviation, has significantly hindered the utilization of miRNA-Seq for quantitative miRNA profiling in a high-throughput manner. Although in some studies the se-quencing depth has approached billions of reads [33],
the power of accurate quantification of miRNAs based on the cloning frequency remains poor [20]. Because intermolecular RNA hybridization contributes to bias, the application of a thermostable RNA ligase or a 5′ splint adapter significantly reduces such bias. However, the ligation efficiency is low and the improvement by each strategy appears to vary for different RNA substrates. By examining individual steps during the small RNA cDNA library preparation, we have defined optimal conditions to achieve high ligation efficiency for both 3′and 5′ligation steps. We determined that the nucleo-tide composition of the linkers, the concentration of linkers, molecular crowding through the use of PEG8000, and ligation temperature are the primary determinants for
highly efficient RNA ligation. We demonstrated with a wide spectrum of small RNA substrates that the ligation efficiency can approach 100%, a drastic improvement compared with the existing method. As a result, the high-efficiency RNA cloning leads to quantitative measure-ment of miRNAs by miRNA-Seq. To achieve such quanti-tative results for a pool of approximately 700 miRNAs for a single sample, we usually need approximately 4 to 5 million reads. With the data output routinely over 200 million reads from a single lane of a sequencer, in combination with the multiplexing capacity of the Illumina Hi-Seq platform, our miRNA-Seq method provides an extremely cost-effective and accurate approach for large scale miRNA analyses from numerous samples.
Proportion of
miRNA
Reads
(Set
2)
Proportion of miRNA Reads (Set 1) 0 250 500 750 1000 1250 1500
Proportion of miRNA
Reads miRNA Rank A B 0 0.2 0.4 0.6 0.8 1 1.2
Control miR-502 miR-130a miR-21
Normalized RLU (firefly
[image:9.595.60.537.87.482.2]/renilla ) miR-21 (1) miR-130a (28) miR-502 (238) C 5’uagcuuaucagacugauguuga3’5’uagcuuaucagacugauguuga3’ |||||||||···|||||||||| |||||||||···|||||||||| 3’aucgaauagagagacuacaacugaucaucgaauagagagacuacaacu5’ miR-21
miR-130
miR-502
5’cagugcaauguuaaaagggcau3’5’cagugcaauguuaaaagggcau3’ |||||||||···|||||||||| |||||||||···|||||||||| 3’gucacguuaguuuuuucccguaguacgucacguuaguuuuuucccgua5’
5’aaugcaccugggcaaggauuca3’5’aaugcaccugggcaaggauuca3’ |||||||||···|||||||||| |||||||||···|||||||||| 3’uuacguggagggguuccuaagucuaguuacguggagggguuccuaagu5’
D R= 0.90 miR-21 miR-130a miR-502 E 100 10-1 10-2 10-3 10-4 10-5 10-6 100 10-1 10-2 10-3 10-4 10-5 100 10-1 10-2 10-3 10-4 microRNA 5’P 3’OH
3’ Ligation (96% Efficient)
Step 1. Improvements
10% PEG8000 Increased time (4hr) Increased linker (10µM)
microRNA
5’P NN-3’ Linker 3’ddC
5’ Ligation (97% Efficient)
Step 2. Improvements
20% PEG8000 Increased Linker (10µM) Increased Temp. (37°C)
microRNA NN-3’ Linker 3’ddC
5’ Linker-NN
5’OH
RT-PCR Deep Sequencing
Figure 7The potency of miRNA-mediated repression correlates with expression levels. (A)miRNA-Seq results from 1μg of HeLa total RNA. Red dots indicate miRNAs of interest with their rank by cloning frequency shown in parentheses.(B)Scatter plot of the top 250 miRNAs from two HeLa miRNA-Seq experiments; miRNAs of interest are in red.(C)Schematic of the luciferase targeting constructs for miR-21, miR-130 and miR-502. The red sequences are the tandem target sites located in the 3′UTR of the luciferase mRNA, and the black sequences are the miRNAs.(D)Ratios of firefly to renilla luciferase activities in HeLa cultures transfected with miRNA-reporter constructs. Shown is a representative result from three independent experiments. Error bars are the standard deviation from a single experiment where transfections were done in quadruplicate for each construct.(E)Schematic depicting the workflow for the optimized miRNA-Seq approach to profiling miRNAs.
Zhanget al. Genome Biology2013,14:R109 Page 9 of 13
The ability to measure relative expression levels of different miRNAs within a single sample also offers an important approach to identify functionally significant miRNAs. Conventional gene expression analysis by qRT-PCR and microarray usually characterizes differential expression levels of individual miRNAs and identifies miRNAs with the largest fold changes from two or more samples. With the detection sensitivity of qRT-PCR ap-proaching single molecules, some very lowly expressed miRNAs could be identified as highly differentially ex-pressed, though their biological importance may be limited due to low copy number. Since miRNAs function by guiding the RNA-induced silencing complex to their cognate mRNAs and sequestering the mRNAs from productive translation [51], the ratio between miRNAs and mRNA targets is a key factor in determining the potency of a miRNA [10]. In support of this, we dem-onstrate that the most highly expressed miRNA in HeLa cells, miR-21, has the highest capacity to repress the reporter expression, and the intermediately and lowly expressed ones (for example, miR-130a and miR-502) show much weaker repression. Thus, functionally im-portant miRNAs could be identified as the most highly expressed miRNAs within a cellular context without the knowledge of differential expression patterns. Interestingly, in our analysis of miRNAs in both brain and heart, we ob-served that a small number (approximately 10) of miRNAs count for a major portion of the miRNA pool. This raises a possibility that the function of the miRNA pathway could be mediated by a handful of highly expressed miRNAs in each cell population.
Finally, our approach to enhance RNA ligation efficiency offers a general guide to improve all RNA ligation-based RNA-Seq methods. The enhanced ligation not only re-duces the required amount of RNA input but also, more importantly, improves the representation of different RNA species/fragments in the sequencing libraries. These improvements will allow quantitative analysis of gene ex-pression by fully harnessing the power of deep sequencing.
Materials and methods Linker adenylation
DNA oligonucleotides to serve as 3′ linkers for miRNA
cloning were ordered from Integrated DNA Technologies Coralville, Iowa, USA(see Table S3 in Additional file 1 for sequences). All oligonucleotides were ordered with a 5′ phosphate group; those used in sequencing experiments also included a 3′ dideoxycytosine. Prior to ligation, 3′
linkers were adenylated at the 5′ end using the MTH
adenylation kit (New England Biolabs #E2610L Ipswich, Massachusetts, USA). Oligonucleotides were phenol/chloro-form extracted, precipitated with 2.5 volumes of ethanol,
and quantified by A260. Adenlyation was confirmed by
18% PAGE (Figure S2 in Additional file 1).
3′ligation reactions
Five picomoles of indicated synthetic miRNA were 5′
end labeled using T4 polynucleotide kinase (Fermentas
Hanover, Maryland, USA) with 25 μCi of γ-(32P) ATP
(3,000 Ci/mmol). Labeled RNA was phenol/chloroform extracted, ethanol precipitated, and resuspended in distilled H2O. Initial reactions (Figure 3A) were composed of 25
femtomoles of labeled RNA, 1 picomole of 5′ adenylated
DNA cloning linker, 50 mM Tris-HCl pH 7.5, 10 mM
MgCl2, 1 mM dithiothreitol, 20 units truncated T4 RNA
Ligase 2 (residues 1 to 249, K227Q point mutant) (New England Biolabs M0242S Waltham, Massachusetts, USA), and 20 units RNase Inhibitor (Invitrogen N2611 Carlsbad, California, USA). Ligations were permitted to proceed for 90 minutes at room temperature. Reactions were stopped by the addition of an equal volume of 2X loading dye (7 M urea, 1× TBE, 0.01% bromophenol blue and 0.005% xylene cyanol), briefly heated to 95°C, and snap cooled on ice. RNA species were resolved on 15% acrylamide gels containing 7 M urea, exposed to a phosphorimager screen, and visualized by scanning on a Storm Imager (GE Healthcare Piscataway, New Jersey, USA). Subsequent, high efficiency reactions were identical with the following modifications; a final concentration of 10% (w/v) PEG mo-lecular weight 8000 Da (PEG 8000) was included. Reaction times were increased from 90 minutes to 4 hours, and 3′ linker concentration was increased to 10μM.
5′ligation reactions
Synthetic 5′32P labeled RNA was subject to 3′ligation and resolved on 15% PAGE-urea gels as described previ-ously. The ligated product was excised and eluted and served as substrate for 5′ligation tests. Initial 5′ligation reactions were composed of the following: 50 mM
Tris-HCl pH 7.5, 10 mM MgCl2, 1 mM dithiothreitol, 1 mM
ATP, 20% (v/v) DMSO, 10 units T4 RNA Ligase 1 (New England Biolabs M0204S), 20 units RNase Inhibitor (Invitrogen N2611), 5μM 5′RNA cloning linker, and 25 femtomoles of eluted substrate RNA. Reactions were carried out at room temperature for 2 hours. Subsequent high efficiency ligations were identical with the following
modifications: no DMSO, 20% (w/v) PEG8000, 5′RNA
cloning linker increased to 10 μM, and temperature
in-creased to 37°C. Reactions were stopped, resolved, and vi-sualized as described above. For the thermostable ligation, a thermostable RNA ligase (Epicentre TRL8101K Madison,
Wisconsin, USA) was used following the manufacture’s
instruction.
Synthetic RNA library preparation
volume to generate an equimolar mixture of the 29 synthetic RNAs.
Small RNA cloning
RNA samples (5 to 1.25 picomoles for synthetic samples and 1 to 4 μg of total RNA for biological samples) were subject to high efficiency 3′ ligation as described above. Products were resolved on 15% PAGE-urea gels and stained with SybrGold (Molecular Probes S-11494 Carlsbad, California, USA). The region corresponding to ligated miRNAs (46 nucleotides) was excised, gel slices were thoroughly minced, and eluted in HSCB (400 mM NaCl, 25 mM Tris-HCl pH 7.5, 0.1% SDS) overnight at 4°C. Nucleic acids were precipitated in the presence of glycogen carrier via 2.5 volumes ethanol and 0.1 volumes sodium acetate. Pellets were washed in 70% ethanol, and resuspended in the 5′ligation mix without enzyme. Sam-ples were briefly heated to 70°C, snap chilled on ice, and enzyme added. Following ligation reactions cDNA was prepared using Superscript III RT (Invitrogen 18080-085)
according to the manufacturer′s recommendation using
3′ linker-specific RT primer. Subsequent cDNA libraries served as templates for PCR amplification; amplicons were resolved on 8% native acrylamide gels. Bands of the correct molecular weight were isolated and used for high-throughput sequencing on the Illumina HiSeq2000.
Read mapping
A customized miRNA reference database was built with mature miRNA sequences obtained from miRBase [52]. Sequencing reads were mapped to the customized database with BLAST [53].
Primer extension
A 17-bp DNA primer reverse complementary with nucle-otides 6 to 22 of the canonical sequences of miR-203 was used in the primer extension experiment to detect the 5′ length variants of miR-203. Each isoform was quantified using Image J software where the signal from the two bands was summed and each presented as a proportion of the total signal. The assay was performed following the manufacture’s instructions (Promega #E3030 Madison, Wisconsin, USA).
Northern blotting
Total RNA (10 μg) was electrophoresed through 20%
denaturing urea-PAGE gels and electrophoretically trans-ferred to GeneScreen Plus® Nylon Membranes (Perkin-Elmer, Inc. Waltham, Massachusetts, USA). Radiolabeled oligonucleotides complementary to mature miR-203 sequence (miRbase accession MIMAT0000236) were hybridized to the membranes in ExpressHyb Hybridization
Solution™(Clontech Laboratories, Inc. Mountain View,
California, USA). Synthetic miR-203 and miR-203iso were
loaded as size standards. Bands were quantified as de-scribed in the primer extension experiment.
Luciferase assay
HeLa cell cultures were propagated according to ATCC guidelines. Cells were plated in 24-well trays at a density of 0.1 × 10⁶ cells per well. Sixteen hours post-plating cells were transfected with LT1 (Mirrus Bio Madison, Wisconsin, USA) according to the manufacturer’s instruc-tions with 20 ng of the following constructs: pGL3 con-trol, pGL3-miR502, pGL3-miR130a, and pGL3-miR21 along with 2 ng of Renilla (pRL-CMV), and 378 ng of 'filler' DNA (pLL3.7). Twenty-four hours post-transfection cells were assayed for luciferase activity using the Promega Dual Luciferase Assay Kit according to the manufacturer’s instructions. Data are the ratio of firefly to renilla luciferase activity, normalized to the control construct. Shown is a representative result from an experiment done in triplicate; error bars represent standard deviations.
Data access
All miRNA-Seq data have been deposited to the National Center for Biotechnology Information Gene Expression Omnibus with accession number GSE47858.
Additional file
Additional file 1:Tables S1 to S3 and figures S1 to S3. Table S1:
synthetic miRNA library. Complete list of 29 synthetic miRNAs and the primary sequences used in miRNA-Seq studies.Table S2:GC content of synthetic miRNA library. List of 29 synthetic miRNAs used in this study, their corresponding GC content listed as a percentage of total nucleotide number, and their observed cloning frequency listed as a percentage of total mapped miRNA reads.Table S3:oligonucleotides used in this study. List of oligonucleotides used in the ligation optimization and miRNA-Seq experiments.Figure S1:clustered miRNAs 143/145 exhibit differential quantification in a method-specific manner. (A) miRNA-Seq from mouse hair follicle. (B) qRT-PCR quantification of mouse epidermis determined byΔΔCt method where sno25 serves as the reference gene.
Figure S2:DNA oligos can be readily adenylated by MTH
(Methanobacterium thermoautotrophicum) RNA ligase. 18% urea-PAGE of 3′DNA linkers shows shift in electrophoretic mobility corresponding to 5′ adenylation where plus and minus signs indicate the presence or lack of MTH enzyme, respectively.Figure S3:enhanced miRNA-Seq approach is highly correlative for varying amounts of input RNA. Differing amounts of the 29 synthetic miRNA mix were subjected to enhanced miRNA-Seq.
Abbreviations
DMSO:Dimethylsulfoxide; miRNA: Micro RNA; miRNA-Seq: Small RNA cloning followed by deep sequencing; PEG: Polyethylene glycol; qRT-PCR: Quantitative reverse-transcription polymerase chain reaction; UTR: Untranslated region.
Competing interests
EMA is an employee of Thermo Fisher Scientific, Inc.
Authors’contributions
RY, JEL and ZZ designed the experiments. ZZ performed initial
characterizations of the miRNA-Seq biases and initial optimizations, prepared libraries from biological samples, and performed the primer extension assay and all bioinformatics analyses. JEL optimized 5′and 3′ligation reactions, prepared the optimized synthetic and HeLa libraries and performed the luciferase assays. KR performed the northern blotting. EMA provided the
Zhanget al. Genome Biology2013,14:R109 Page 11 of 13
synthetic miRNAs. RY, JEL and ZZ wrote the manuscript. All authors read and approved the final manuscript.
Acknowledgements
We thank D Wang for discussion and providing total RNAs from heart and brain and other members of the Yi lab for suggestions; M Han and B Kudlow for discussion and providing total RNAs from worm; N Lau, S Bradley, W Regan, M Rosbash and J Huntley for reagents and Illumina sequencing; R Dowell for advice on bioinformatics analysis; T Blumenthal for reading the manuscript. This publication was made possible by a start-up fund provided by the University of Colorado and a grant from the NIH (AR059697) to RY and awards from the American Cancer Society to RY and JEL.
Author details
1
Department of Molecular, Cellular, and Developmental Biology, University of Colorado, Boulder, CO, 80305, USA.2Dharmacon Inc., a wholly owned subsidiary of Thermo Fisher Scientific, Inc., Lafayette, CO, 80026 USA.
Received: 14 August 2013 Accepted: 7 October 2013 Published: 7 October 2013
References
1. Bartel DP:MicroRNAs: target recognition and regulatory functions. Cell2009,136:215–233.
2. Lewis BP, Burge CB, Bartel DP:Conserved seed pairing, often flanked by adenosines, indicates that thousands of human genes are microRNA targets.Cell2005,120:15–20.
3. Xie X, Lu J, Kulbokas EJ, Golub TR, Mootha V, Lindblad-Toh K, Lander ES, Kellis M:Systematic discovery of regulatory motifs in human promoters and 3′UTRs by comparison of several mammals.Nature2005, 434:338–345.
4. Lim LP, Lau NC, Garrett-Engele P, Grimson A, Schelter JM, Castle J, Bartel DP, Linsley PS, Johnson JM:Microarray analysis shows that some microRNAs downregulate large numbers of target mRNAs.Nature2005,433:769–773. 5. Giraldez AJ, Mishima Y, Rihel J, Grocock RJ, Van Dongen S, Inoue K, Enright
AJ, Schier AF:Zebrafish MiR-430 promotes deadenylation and clearance of maternal mRNAs.Science2006,312:75–79.
6. Baek D, Villen J, Shin C, Camargo FD, Gygi SP, Bartel DP:The impact of microRNAs on protein output.Nature2008,455:64–71.
7. Selbach M, Schwanhausser B, Thierfelder N, Fang Z, Khanin R, Rajewsky N: Widespread changes in protein synthesis induced by microRNAs. Nature2008,455:58–63.
8. Schwanhausser B, Busse D, Li N, Dittmar G, Schuchhardt J, Wolf J, Chen W, Selbach M:Global quantification of mammalian gene expression control. Nature2011,473:337–342.
9. Wang L, Dowell RD, Yi R:Genome-wide maps of polyadenylation reveal dynamic mRNA 3′-end formation in mammalian cell lineages.RNA2013, 19:413–425.
10. Mukherji S, Ebert MS, Zheng GX, Tsang JS, Sharp PA, van Oudenaarden A: MicroRNAs can generate thresholds in target gene expression.Nat Genet
2011,43:854–859.
11. Zeng Y, Yi R, Cullen BR:MicroRNAs and small interfering RNAs can inhibit mRNA expression by similar mechanisms.Proc Natl Acad Sci U S A2003, 100:9779–9784.
12. Friedman RC, Farh KK, Burge CB, Bartel DP:Most mammalian mRNAs are conserved targets of microRNAs.Genome Res2009,19:92–105. 13. Cesana M, Cacchiarelli D, Legnini I, Santini T, Sthandier O, Chinappi M,
Tramontano A, Bozzoni I:A long noncoding RNA controls muscle differentiation by functioning as a competing endogenous RNA. Cell2011,147:358–369.
14. Tay Y, Kats L, Salmena L, Weiss D, Tan SM, Ala U, Karreth F, Poliseno L, Provero P, Di Cunto F, Lieberman J, Rigoutsos I, Pandolfi PP: Coding-independent regulation of the tumor suppressor PTEN by competing endogenous mRNAs.Cell2011,147:344–357.
15. Hansen TB, Jensen TI, Clausen BH, Bramsen JB, Finsen B, Damgaard CK, Kjems J:Natural RNA circles function as efficient microRNA sponges. Nature2013,495:384–388.
16. Memczak S, Jens M, Elefsinioti A, Torti F, Krueger J, Rybak A, Maier L, Mackowiak SD, Gregersen LH, Munschauer M, Loewer A, Ziebold U, Landthaler M, Kocks C, le Noble F, Rajewsky N:Circular RNAs are a large class of animal RNAs with regulatory potency.Nature2013,495:333–338.
17. Bissels U, Wild S, Tomiuk S, Holste A, Hafner M, Tuschl T, Bosio A:Absolute quantification of microRNAs by using a universal reference.RNA2009, 15:2375–2384.
18. Hafner M, Landgraf P, Ludwig J, Rice A, Ojo T, Lin C, Holoch D, Lim C, Tuschl T:Identification of microRNAs and other small regulatory RNAs using cDNA library sequencing.Methods2008,44:3–12.
19. Linsen SE, de Wit E, Janssens G, Heater S, Chapman L, Parkin RK, Fritz B, Wyman SK, de Bruijn E, Voest EE, Kuersten S, Tewari M, Cuppen E: Limitations and possibilities of small RNA digital gene expression profiling.Nat Methods2009,6:474–476.
20. Hafner M, Renwick N, Brown M, MihailovićA, Holoch D, Lin C, Pena JT, Nusbaum JD, Morozov P, Ludwig J, Ojo T, Luo S, Schroth G, Tuschl T: RNA-ligase-dependent biases in miRNA representation in deep-sequenced small RNA cDNA libraries.RNA2011,17:1697–1712.
21. Jayaprakash AD, Jabado O, Brown BD, Sachidanandam R:Identification and remediation of biases in the activity of RNA ligases in small-RNA deep sequencing.Nucleic Acids Res2011,39:e141.
22. Zhuang F, Fuchs RT, Sun Z, Zheng Y, Robb GB:Structural bias in T4 RNA ligase-mediated 3′-adapter ligation.Nucleic Acids Res2012,40:e54. 23. Sorefan K, Pais H, Hall AE, Kozomara A, Griffiths-Jones S, Moulton V, Dalmay
T:Reducing ligation bias of small RNAs in libraries for next generation sequencing.Silence2012,3:4.
24. Lagos-Quintana M, Rauhut R, Lendeckel W, Tuschl T:Identification of novel genes coding for small expressed RNAs.Science2001,294:853–858. 25. Lau NC, Lim LP, Weinstein EG, Bartel DP:An abundant class of tiny RNAs
with probable regulatory roles in Caenorhabditis elegans.Science2001, 294:858–862.
26. Lee RC, Ambros V:An extensive class of small RNAs in Caenorhabditis elegans.Science2001,294:862–864.
27. Aravin A, Gaidatzis D, Pfeffer S, Lagos-Quintana M, Landgraf P, Iovino N, Morris P, Brownstein MJ, Kuramochi-Miyagawa S, Nakano T, Chien M, Russo JJ, Ju J, Sheridan R, Sander C, Zavolan M, Tuschl T:A novel class of small RNAs bind to MILI protein in mouse testes.Nature2006,442:203–207. 28. Girard A, Sachidanandam R, Hannon GJ, Carmell MA:A germline-specific class
of small RNAs binds mammalian Piwi proteins.Nature2006,442:199–202. 29. Tam OH, Aravin AA, Stein P, Girard A, Murchison EP, Cheloufi S, Hodges E,
Anger M, Sachidanandam R, Schultz RM, Hannon GJ:Pseudogene-derived small interfering RNAs regulate gene expression in mouse oocytes. Nature2008,453:534–538.
30. Watanabe T, Totoki Y, Toyoda A, Kaneda M, Kuramochi-Miyagawa S, Obata Y, Chiba H, Kohara Y, Kono T, Nakano T, Surani MA, Sakaki Y, Sasaki H: Endogenous siRNAs from naturally formed dsRNAs regulate transcripts in mouse oocytes.Nature2008,453:539–543.
31. Yi R, O'Carroll D, Pasolli HA, Zhang Z, Dietrich FS, Tarakhovsky A, Fuchs E: Morphogenesis in skin is governed by discrete sets of differentially expressed microRNAs.Nat Genet2006,38:356–362.
32. Premsrirut PK, Dow LE, Kim SY, Camiolo M, Malone CD, Miething C, Scuoppo C, Zuber J, Dickins RA, Kogan SC, Shroyer KR, Sordella R, Hannon GJ, Lowe SW:A rapid and scalable system for studying gene function in mice using conditional RNA interference.Cell2011,145:145–158. 33. Joyce CE, Zhou X, Xia J, Ryan C, Thrash B, Menter A, Zhang W, Bowcock AM:
Deep sequencing of small RNAs from human skin reveals major alterations in the psoriasis miRNAome.Hum Mol Genet2011,20:4025–4040.
34. Xin M, Small EM, Sutherland LB, Qi X, McAnally J, Plato CF, Richardson JA, Bassel-Duby R, Olson EN:MicroRNAs miR-143 and miR-145 modulate cytoskeletal dynamics and responsiveness of smooth muscle cells to injury.Genes Dev2009,23:2166–2178.
35. Harrison B, Zimmerman SB:Polymer-stimulated ligation: enhanced ligation of oligo- and polynucleotides by T4 RNA ligase in polymer solutions.Nucleic Acids Res1984,12:8235–8251.
36. Walker GC, Uhlenbeck OC, Bedows E, Gumport RI:T4-induced RNA ligase joins single-stranded oligoribonucleotides.Proc Natl Acad Sci U S A1975, 72:122–126.
37. Bruce AG, Uhlenbeck OC:Reactions at the termini of tRNA with T4 RNA ligase.Nucleic Acids Res1978,5:3665–3677.
38. Wienholds E, Kloosterman WP, Miska E, Alvarez-Saavedra E, Berezikov E, de Bruijn E, Horvitz HR, Kauppinen S, Plasterk RH:MicroRNA expression in zebrafish embryonic development.Science2005,309:310–311. 39. Cheng LC, Pastrana E, Tavazoie M, Doetsch F:miR-124 regulates adult
neurogenesis in the subventricular zone stem cell niche.Nat Neurosci
40. Chi SW, Zang JB, Mele A, Darnell RB:Argonaute HITS-CLIP decodes microRNA-mRNA interaction maps.Nature2009,460:479–486. 41. Zhao C, Sun G, Li S, Shi Y:A feedback regulatory loop involving
microRNA-9 and nuclear receptor TLX in neural stem cell fate determination.Nat Struct Mol Biol2009,16:365–371.
42. Delaloy C, Liu L, Lee JA, Su H, Shen F, Yang GY, Young WL, Ivey KN, Gao FB: MicroRNA-9 coordinates proliferation and migration of human embryonic stem cell-derived neural progenitors.Cell Stem Cell2010, 6:323–335.
43. Liu N, Bezprozvannaya S, Williams AH, Qi X, Richardson JA, Bassel-Duby R, Olson EN:microRNA-133a regulates cardiomyocyte proliferation and suppresses smooth muscle gene expression in the heart.Genes Dev2008, 22:3242–3254.
44. van Rooij E, Sutherland LB, Qi X, Richardson JA, Hill J, Olson EN:Control of stress-dependent cardiac growth and gene expression by a microRNA. Science2007,316:575–579.
45. Zhao Y, Samal E, Srivastava D:Serum response factor regulates a muscle-specific microRNA that targets Hand2 during cardiogenesis. Nature2005,436:214–220.
46. Wang S, Aurora AB, Johnson BA, Qi X, McAnally J, Hill JA, Richardson JA, Bassel-Duby R, Olson EN:The endothelial-specific microRNA miR-126 governs vascular integrity and angiogenesis.Dev Cell2008,15:261–271. 47. Cheloufi S, Dos Santos CO, Chong MM, Hannon GJ:A dicer-independent
miRNA biogenesis pathway that requires Ago catalysis.Nature2010, 465:584–589.
48. Cifuentes D, Xue H, Taylor DW, Patnode H, Mishima Y, Cheloufi S, Ma E, Mane S, Hannon GJ, Lawson ND, Wolfe SA, Giraldez AJ:A novel miRNA processing pathway independent of Dicer requires Argonaute2 catalytic activity.Science2010,328:1694–1698.
49. Yang JS, Maurin T, Robine N, Rasmussen KD, Jeffrey KL, Chandwani R, Papapetrou EP, Sadelain M, O'Carroll D, Lai EC:Conserved vertebrate mir-451 provides a platform for Dicer-independent, Ago2-mediated microRNA biogenesis.Proc Natl Acad Sci U S A2010,107:15163–15168. 50. Jackson SJ, Zhang Z, Feng D, Flagg M, O'Loughlin E, Wang D, Stokes N, Fuchs E, Yi R:Rapid and widespread suppression of self-renewal by microRNA-203 during epidermal differentiation.Development2013, 140:1882–1891.
51. Bazzini AA, Lee MT, Giraldez AJ:Ribosome profiling shows that miR-430 reduces translation before causing mRNA decay in zebrafish.Science
2012,336:233–237.
52. Kozomara A, Griffiths-Jones S:miRBase: integrating microRNA annotation and deep-sequencing data.Nucleic Acids Res2011,39:D152–D157. 53. Altschul SF, Madden TL, Schaffer AA, Zhang J, Zhang Z, Miller W, Lipman DJ:
Gapped BLAST and PSI-BLAST: a new generation of protein database search programs.Nucleic Acids Res1997,25:3389–3402.
doi:10.1186/gb-2013-14-10-r109
Cite this article as:Zhanget al.:High-efficiency RNA cloning enables accurate quantification of miRNA expression by deep sequencing.
Genome Biology201314:R109.
Submit your next manuscript to BioMed Central and take full advantage of:
• Convenient online submission
• Thorough peer review
• No space constraints or color figure charges
• Immediate publication on acceptance
• Inclusion in PubMed, CAS, Scopus and Google Scholar
• Research which is freely available for redistribution
Submit your manuscript at www.biomedcentral.com/submit
Zhanget al. Genome Biology2013,14:R109 Page 13 of 13