International Journal of Emerging Technology and Advanced Engineering
Website: www.ijetae.com (ISSN 2250-2459, ISO 9001:2008 Certified Journal, Volume 7, Issue 10, October 2017)
367
Dispersion Characteristics by Modes
Dinesh Kumar
1, Dr. Taran Kumari
21Research Scholar, 2Associate Professor, University Department of Physics, B.R.A.Bihar University, Muzaffarpur, India
Abstract-- The dispersion relation for the HE11 mode is
determined primarily by the waveguide fiber bore radius a. The effect of the dielectric layer on dispersion is minimal. Nevertheless the dielectric layer is essential to form the low loss hybrid modes. The layer thickness determines the frequency band where the transmission loss is reduced and the propagation constant can be approximated. So the information carrying capacity of optical fiber in this HE11
mode will be increased for tetrahertz (THZ) waves. It is
important to note that the group velocity dispersion for the HE11 and TE01 modes is relatively small because the wave
travels mostly outside the dielectric in contrast to the surface wave modes on dielectric-coated metal wires and plates. We estimate that the waveguide fiber dispersion parameter D=0.08 ps / (mm) for the HE11 mode at 2.3 THz.
It corresponds to the pulse broadening of ~1 ps for a 0.15m long test guide and the pulse band width of 80m. For terahertz (THz) waves the thin dielectric layers deposited on the inner surface of hollow cylindrical metallic waveguides reduce transmission losses below 1dB/m.
Keywords: Dispersion, Dispersion parameter, propagation constant (), Group velocity, HE11 and TE01
modes, Terahertz (THz).
I. INTRODUCTION
Here we determine the optical fiber dispersion characteristics and its effect with dielectric layer. We consider polystyrene-coated hollow cylindrical silver (Ag/PS) waveguides [1]. For a multimode waveguide, characterization of dispersion requires knowledge of mode composition at the input and the output of the test waveguide. We recently showed that the required information can be obtained using THz near-field microscopy [10]. This method is applied here to identify the propagating modes at the input and the output of the tested waveguides. We first allow the waveguide modes to form in the launch waveguide. Spectroscopic analysis is then performed using THz time-domain spectroscopy together with monitoring the mode structure at the input and the output of the test waveguide positioned immediately after the launch guide. This approach allows us to obtain mode-specific dispersion characteristics in a wide range of frequencies.
Two modes in the dielectric-coated cylindrical metallic waveguide are considered: the hybrid linearly-polarized HE11 mode and the azimuthally polarized TE01
mode. These modes experience small absorption due to vanishing electric field at the waveguide wall [13].
The HE11 mode has the lowest transmission loss and
very high coupling efficiency to free-space propagating beams [13]. The TE01 mode, the lowest-loss mode in
metallic waveguides, is considered for comparison. We provide dispersion characteristics for the HE11 and
TE01 modes and show that the effect of the dielectric
layer on phase velocity is small for these modes. However, the linearly polarized HE11 mode has an
unusual cut-off frequency behavior, substantially different from the dominant TE11 mode in metallic
waveguides. The TE01 mode on the other hand follows
characteristics of the TE01 mode in a metallic waveguide
very closely within the full range of measured frequencies (0.5-3.0 THz). We also show that the propagation constants can be approximated by analytical functions in the low-loss region suggesting that the effect of the dielectric coating for these modes can be treated by the perturbation theory.
Mostly dispersion is the factor which causes the signal loss in the optical Fiber communication system. Dispersion limits the performance of the optical-fiber medium as a data transmission channel. The rate at which data may be transmitted through the fiber, since it governs the temporal spreading of the optical waves carrying the data.
International Journal of Emerging Technology and Advanced Engineering
Website: www.ijetae.com (ISSN 2250-2459, ISO 9001:2008 Certified Journal, Volume 7, Issue 10, October 2017)
368
Depending on the device configuration of a light-emitting diode (LED), the spectral width is approximately 4 to 9 percent of a central wavelength. It is found that, if the peak wavelength of an LED is 850nm, a typical source spectral width would be 36nm: that is, such an LED emits most of its light in the 832-to-868-nm wavelength band. Laser diode optical sources exhibit much narrower spectral widths, with typical values being 1-2 nm for multimode lasers and 10-4 nm for single-mode lasers. The two main causes of intramodal dispersion are as follows :
Material dispersion arises due to the variations of the refractive index of the core material as a function of wavelength. Material dispersion also is referred to as chromatic dispersion, since this is the same effect by which a prism spreads out a spectrum. This refractive index property causes a wavelength dependence of the group velocity of a given mode: that is, pulse spreading occurs even when different wavelengths follow the same path.
Waveguide dispersion causes pulse spreading because only part of the optical power propagation along a fiber is confined to the core. Dispersion arises because the fraction of light power propagating in the cladding travels faster than the light confined to the core, since the index is lower in the cladding. For example, a single-mode fiber confines only about 80 percent of the power in the core for V values around 2. The amount of waveguide dispersion depends on the fiber design, since the modal propagation constant is a function of a/ (the optical fiber dimension relative to the wavelength; here a is the core radius). Waveguide dispersion usually can be ignored in multimode fibers, but its effect is significant in single-mode fibers.
Polarization-mode Dispersion results from the fact that optical wave-signal energy at a given wavelength in a single-mode fiber actually occupies two orthogonal polarization states or modes. At the start of the fiber the two polarization states are aligned. However, since fiber material is not perfectly uniform throughout its length, each polarization mode will encounter a slightly different refractive index. Consequently each mode will travel at a slightly different velocity. The resulting difference in propagation times between the two orthogonal polarization modes will cause pulse spreading. (Source : Optical fiber communications, fourth edition, Tata McGraw Hill, Gerd Keiser).
Dispersion characteristics by modes
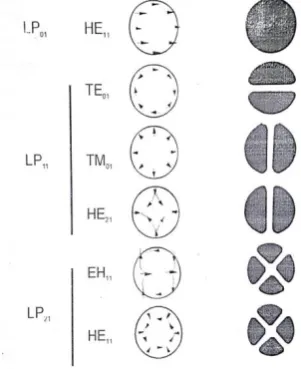
The electric field intensity profiles for the lowest three LP modes together with the electric field distribution of their constituent exact modes, are shown in Fig. 2.
It may be observed from the field configuration of the exact modes that the field strength in the transverse direction (Ex or Ey) is identical for the modes which belong to the same LP mode.
For the cylindrical homogeneous core waveguide fiber under the weak guidance condition outlined above the scalar wave equation can be written in the form.
2 2
2 2 2 1
2 2 2
1
1
0
d
d
d
n k
dr
r dr
r
d
..(1)where is the field (E or H), a detailed explanation is done in the chapter 1 under topic analysis of optical wave
communicating in cylindrical wave guide section 1.6,
n
1is the refracting index of the fiber core, k is the propagation constant for light in a vacuum and r and are cylindrical co-ordinates. The propagation constants of the guided modes lie in the range
2 1
n k
n k
...(2)where
n
2 is the refractive index of the fiber cladding.Solutions of the wave equation for the cylindrical fiber are separable, having the form.
( )
Cosl
exp
E r
t
z
Sinl
... (3)where in this case represents the dominant transverse electric field component. The periodic
dependence on following
Cosl
orSinl
gives a mode at radial order l. Hence the fiber supports guided modes of the form of equation 3. A large portion of the wave energy can be coupled in either the HE11 or theTE01 mode as shown in Fig.1(a) & 1(b). The quasi single
International Journal of Emerging Technology and Advanced Engineering
Website: www.ijetae.com (ISSN 2250-2459, ISO 9001:2008 Certified Journal, Volume 7, Issue 10, October 2017)
369
Fig. 1. Space-time maps of the THz wave coupled to different combinations of waveguide modes. Maps of the electric field Ex(t) are shown in the left column and the corresponding maps of the field amplitude Ex(ω) at 2.3 THz are shown in the right column. The position of the input pinhole,
the incident field polarization and the spatial scan lines are schematically shown on the right.
First we compare the dispersion characteristics in an uncoated silver guide with the theory for the classical HE11 mode to verify the characterisation method. The
HE11 mode is formed at the end of a 142mm long launch
Ag guide illuminated uniformly by the unfocussed THz
beam. After propagation through a 151mm long test Ag waveguide fiber the THz i.e. (10
12
[image:3.595.356.507.336.521.2]Hz) optical wave is measured in the centre of the output. The pulse waveform is also measured in the far field zone by a photo conductive antenna equipped with a 1mm radius hyper hemi-spherical silicon lens. The input wave forms for the test guide are obtained at the output of the launch phase velocity plots extracted from both the near field and far field measurements show excellent agreement with the exact theory for a perfect metal wave guide fiber confirming that the characterization method is reliable. The phase error caused by the presence of higher order modes is not significant. (Source : Oleg Mitrofanov and James A. Harrington, "Dielectric-lined cylindrical metallic THz waveguides : mode structure and dispersion", Optics Express, Vol.18, No.3, Feb. 2010.
Fig. 2 : The Electric field configuation for the three lowest LP modes.
International Journal of Emerging Technology and Advanced Engineering
Website: www.ijetae.com (ISSN 2250-2459, ISO 9001:2008 Certified Journal, Volume 7, Issue 10, October 2017)
370
4.4.1 Dispersion characteristics of TE01 modeHere, we consider consider the TE01 mode in the
dielectric coated waveguide fiber. For this mode the far field measurement is not simple because of the mode symmetry. The input and the output waveforms however can be detected in the near field zone at the mode maximum, located close to the half radius point along the vertical axis (y=0.45). A 133.5 mm long, waveguide fiber section is used as the launch waveguide fiber and a 149mm long section as the test waveguide fiber. To evaluate the effect of the dielectric layer we compare the phase velocity data with the theoretical dispersion curve for the TE01 mode in the uncoated metallic waveguide
fiber (Fig. 3). The phase velocity is determined by the bore radius a in the metallic waveguide fiber. It can be expressed in terms of the TE01 cut off frequency
2
c c
f
.= 3.832.c / (2a) = 0.203 THz.1 2 2
2
1
c pV
c
... (4)The experimental data for the dielectric-lined guide follows this phase velocity relation. The dielectric layer therefore produces no noticeable effect on dispersion for this mode. The result is consistent with the fact that only a small fraction of the wave travels in the dielectric.
Finally we consider the dominant HE11 mode. Unlike
the TE01 mode, the HE11 mode couples very efficiently
[image:4.595.325.536.142.341.2]into free space[13]. The input and output waveforms for this mode are therefore obtained using the far field detector with a silicon lens (Fig. 3). This arrangement gives a higher signal to noise ratio. The phase velocity plot for this mode (Fig. 3) exhibits a diverging behaviour at low frequencies similar to the other modes. However the experimental data noticeably deviates from the standard cutoff frequency behaviour of eqn. 4.
Fig. 3 : Phase velocity Vs frequency plots for the HE11 and TE01 modes in the dielectric coated waveguide fibers.
To explain this behaviour we consider the relationship between the spatial mode profile and the cut off frequency. The mode profile is determined by the
transverse component of the mode wave vector
k
t which is proportional to the cut off frequency.c
k c
t [image:4.595.164.435.610.722.2]
... (5)
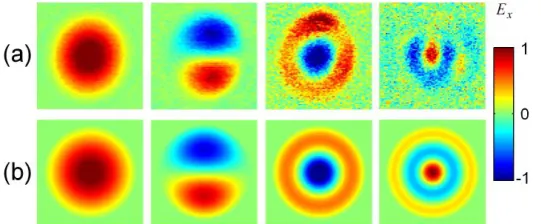
The mode profiles in fig. 2(a) can be used to determine the corresponding cut off frequencies. We first compare the detected profiles with an approximate solution derived by Miyagi and Kawakami for the hybrid modes in the case of the transmission loss minimum [5]. The detected profiles agree with the approximation of Fig. 2(b), therefore the characteristics ktcan be found directly
from the approximation.
Fig. 4. Spatial distribution of normalized electric field Ex for the modes in the dielectric-lined cylindrical metallic waveguide: HE11, TE01, HE12, and HE13 (from left to right). Experimental profiles (a) are measured at t = 0, 1.5, 4.2, and 10.2 ps respectively. Each map shows a 2x2 mm2 area
International Journal of Emerging Technology and Advanced Engineering
Website: www.ijetae.com (ISSN 2250-2459, ISO 9001:2008 Certified Journal, Volume 7, Issue 10, October 2017)
371
4.4.2 Dispersion characteristics of HE11 modeWe consider the following equations :-
,
0 0
x t
E
r
E J
k r
;
,
0
y
E
r
... (6)where
J
0 is the Bessel function of the zeroth orderand
E
0 is the dielectric field amplitude at the waveguidefiber centre.[5] The minimum loss condition requires that the electric field is zero at the metallic wall;
0
x y
E
E
at r = a. The corresponding value ofk
ttherefore must be given by the first root of
J
0
k a
t
0
t
k
=2.405/a. Consequently, the cut off frequency for the HE11 mode is related to the guide radius a as follows.
/ 2
2.405. / 2
0.128
c c
f
c
a
THz = 0.128 × 10¹²HzThis cut off frequency and equation (4) offer a good approximation to the dispersion characteristics for the HE11 mode in the low attenuation band (2-3 THz). Where
the boundary condition
E
x
E
y
0
is satisfied. The data deviates from the standard dispersion curve only at frequencies lower than ~1.7 THz, indicating that the spatial profile of the hybrid mode can no longer be described by equation (6) and the transverse wave vectort
k
=(2.405/a). The simple analytical approximation however holds within the low attenuation region (2-3 THz).We conclude that the dispersion relation for the HE11
mode is determined primarily by the waveguide bore radius a. The effect of the dielectric layer on dispersion is minimal. Nevertheless the dielectric layer is essential to form the low-loss hybrid modes. The layer thickness determines the frequency band where the transmission loss is reduced and the propagation constant can be approximated by Eq. (4).
It is important to note that the group-velocity dispersion for the HE11 and TE01 modes is relatively
small because the waves travel mostly outside the dielectric in contrast to the surface wave modes on dielectric-coated metal wires and plates. We estimate that the waveguide dispersion parameter D = 0.08 ps/(μm·m)
for the HE11 mode at 2.3 THz. It corresponds to the pulse
broadening of ~1 ps for a 0.15 m long test guide and the pulse bandwidth λ of 80 μm.
This (Fig.3) agrees with the experimentally detected broadening in Fig. 3 (inset). More precise measurements can be performed with longer test waveguides, where the effect of the dielectric becomes noticeable.
II. CONCLUSION
The phase velocity of the HE11 mode follows the
standard dispersion relation in the region of low attenuation (2.0 - 3.0 THz for the considered waveguide fibers). The cutoff frequency for the HE11 mode is
determined by the waveguide bore radius and it reflects the boundary condition for the vanishing electric field at the waveguide wall. Here we note that this cut off frequency is equal to the cut off frequency of the TM01
mode in a metallic waveguide fiber; however these modes should not be confused because their configuration are substantially different. It is also important to note that the dispersion characteristics in the dielectric coated waveguide fiber do not approach the theoretical curve for the TE11 mode at low frequencies
despite the fact that the dielectric layer, thickness becomes much smaller than the wavelength in the region close to the cut off frequency. The dielectric coated waveguide fiber also supports the TE01 mode in metallic
waveguide fibers.
These findings simplify signal propagation analysis in the dielectric lined hollow metallic waveguide fibers. We expect that the provided approximation can be used to estimate dispersion in any oversized waveguide fiber (a >> ), while more precise evaluation for the dielectric layer effect can be treated by perturbation theory.
REFERENCES
[1] B. Bowden, J. A. Harrington, and O. Mitrofanov, “Silver/polystyrene-coated hollow glass waveguides for the transmission of terahertz radiation,” Opt. Lett. 32(20), 2945– 2947 (2007).
[2] M. Miyagi, and S. Kawakami, “Design theory of dielectric-coated circular metallic waveguides for infrared transmission,” J. Lightwave Technol. 2(2), 116– 126 (1984).
[3] O. Mitrofanov, T. Tan, P. R. Mark, B. Bowden, and J. A. Harrington, “Waveguide mode imaging and dispersion analysis with terahertz near-field microscopy,” Appl. Phys. Lett. 94(17), 171104 (2009).
[4] B. Bowden, J. A. Harrington, and O. Mitrofanov, “Low-loss modes in hollow metallic terahertz waveguides with dielectric coatings,” Appl. Phys. Lett. 93(18), 181104 (2008).